方案详情文
智能文字提取功能测试中
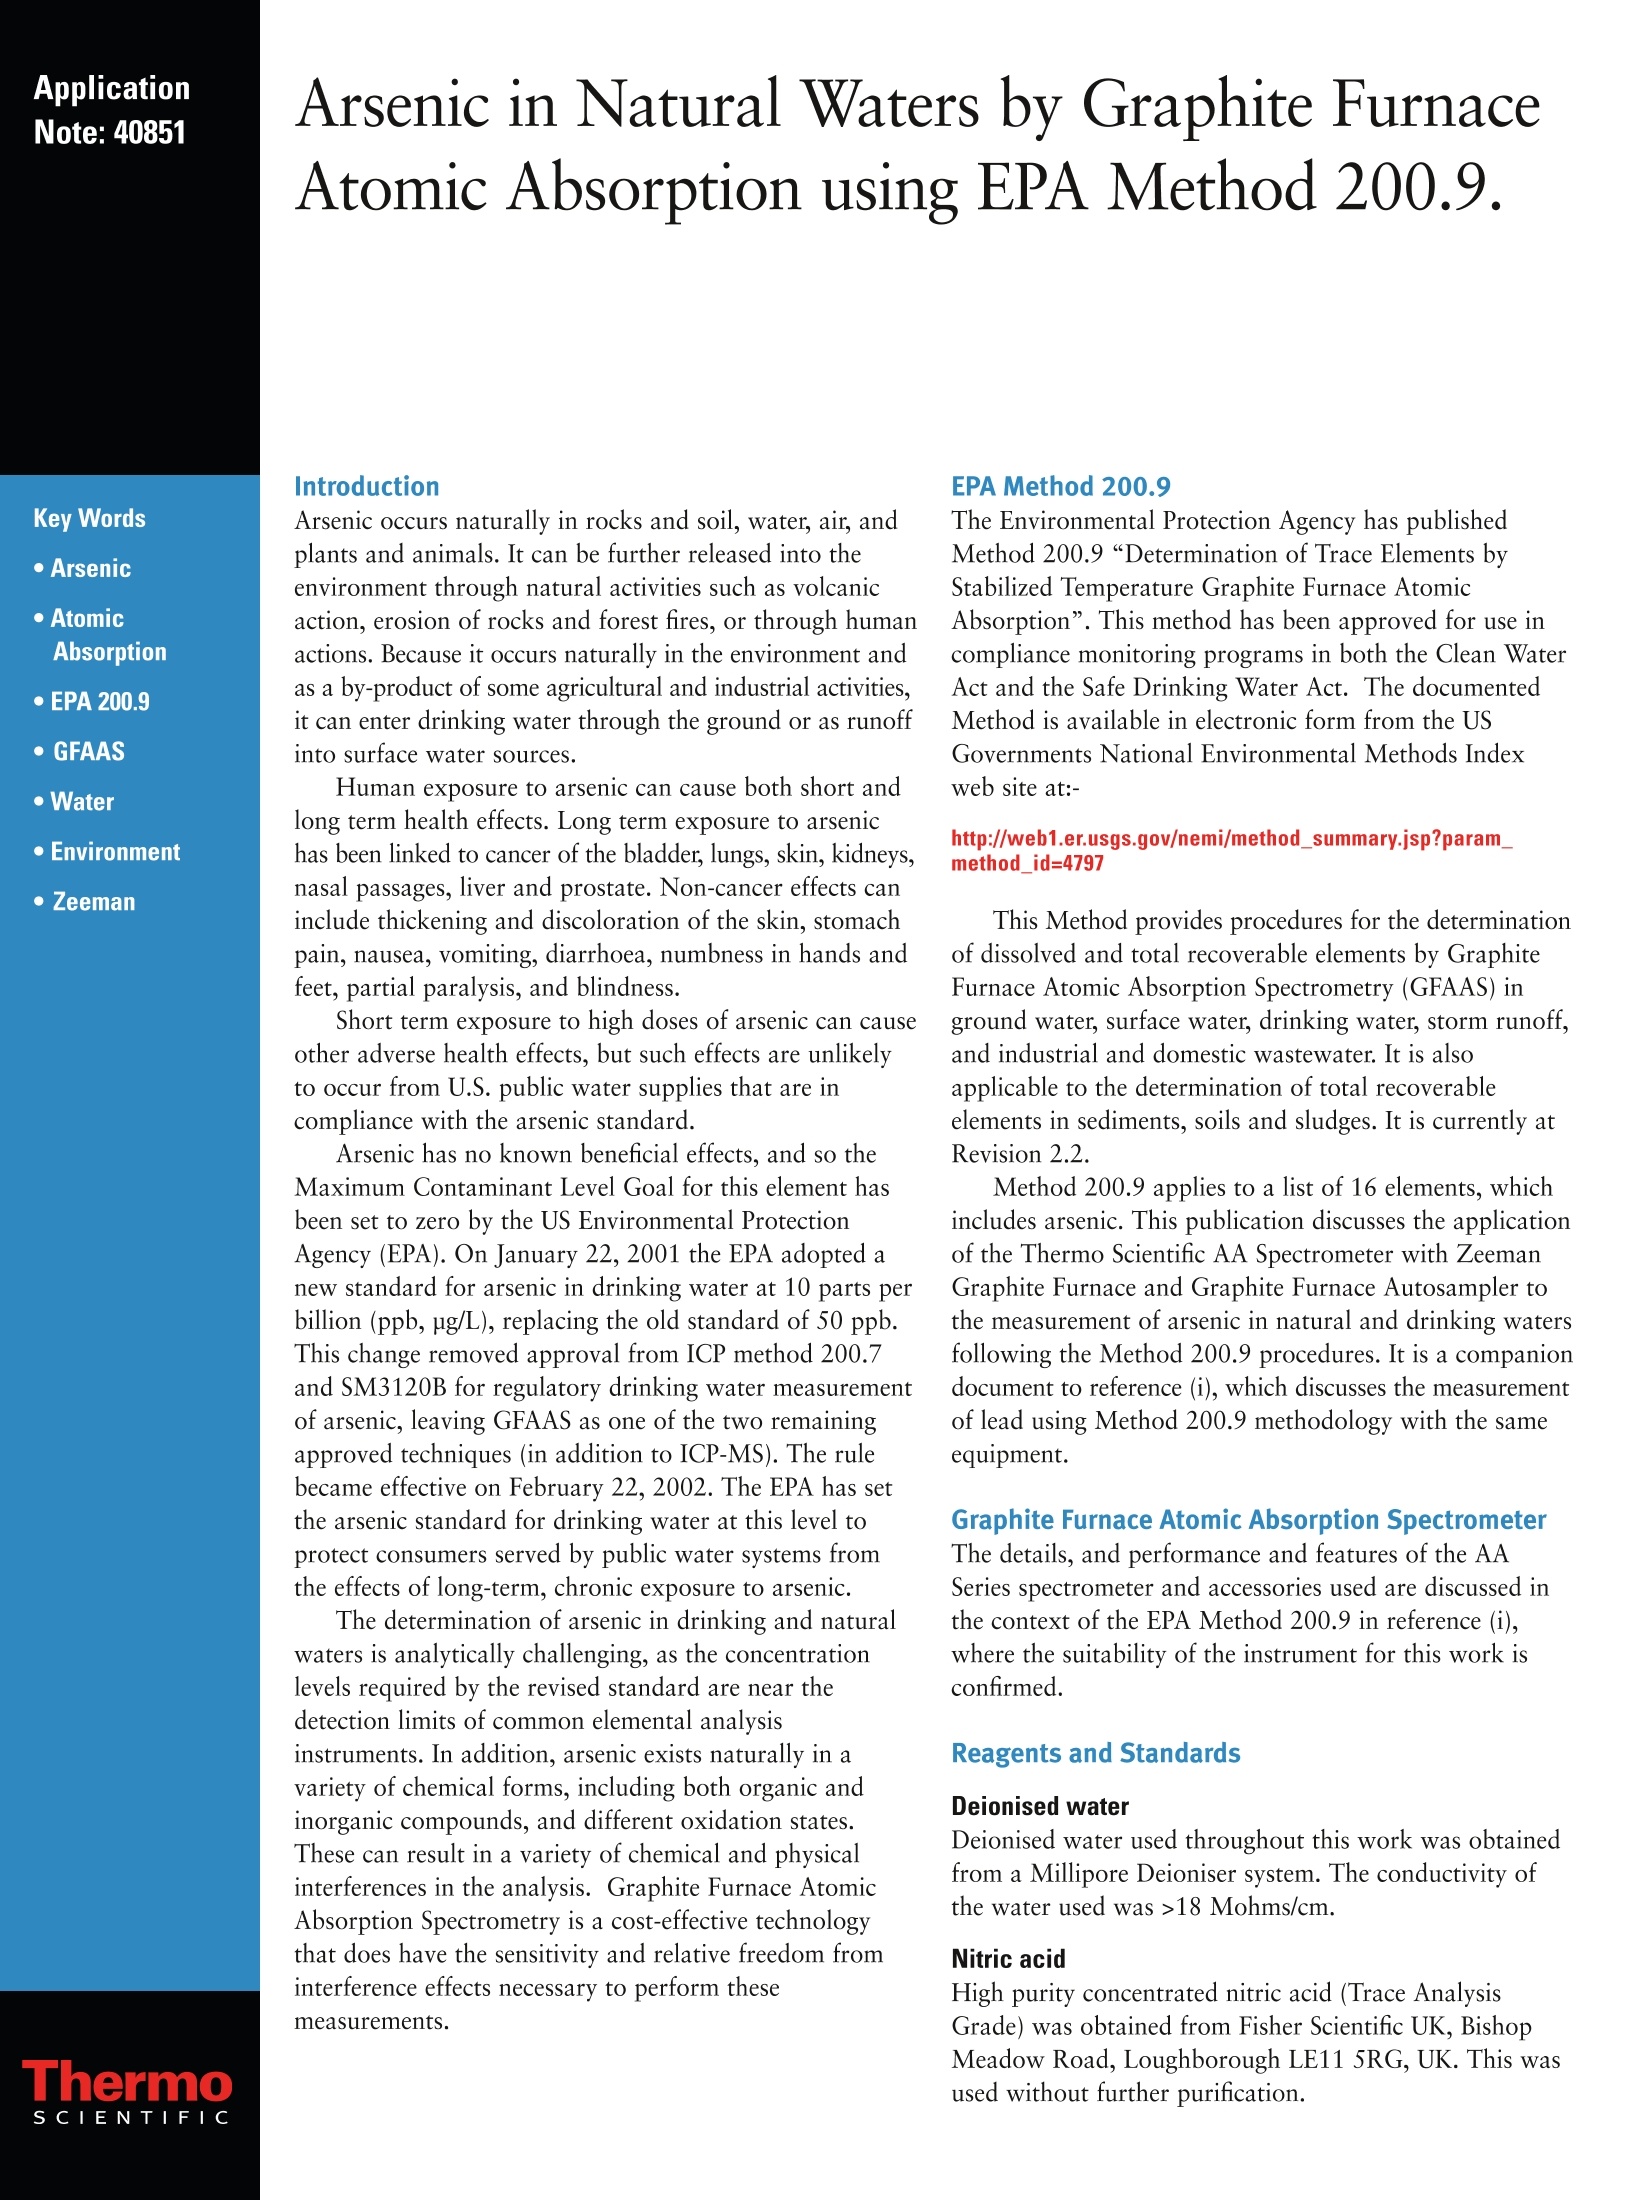
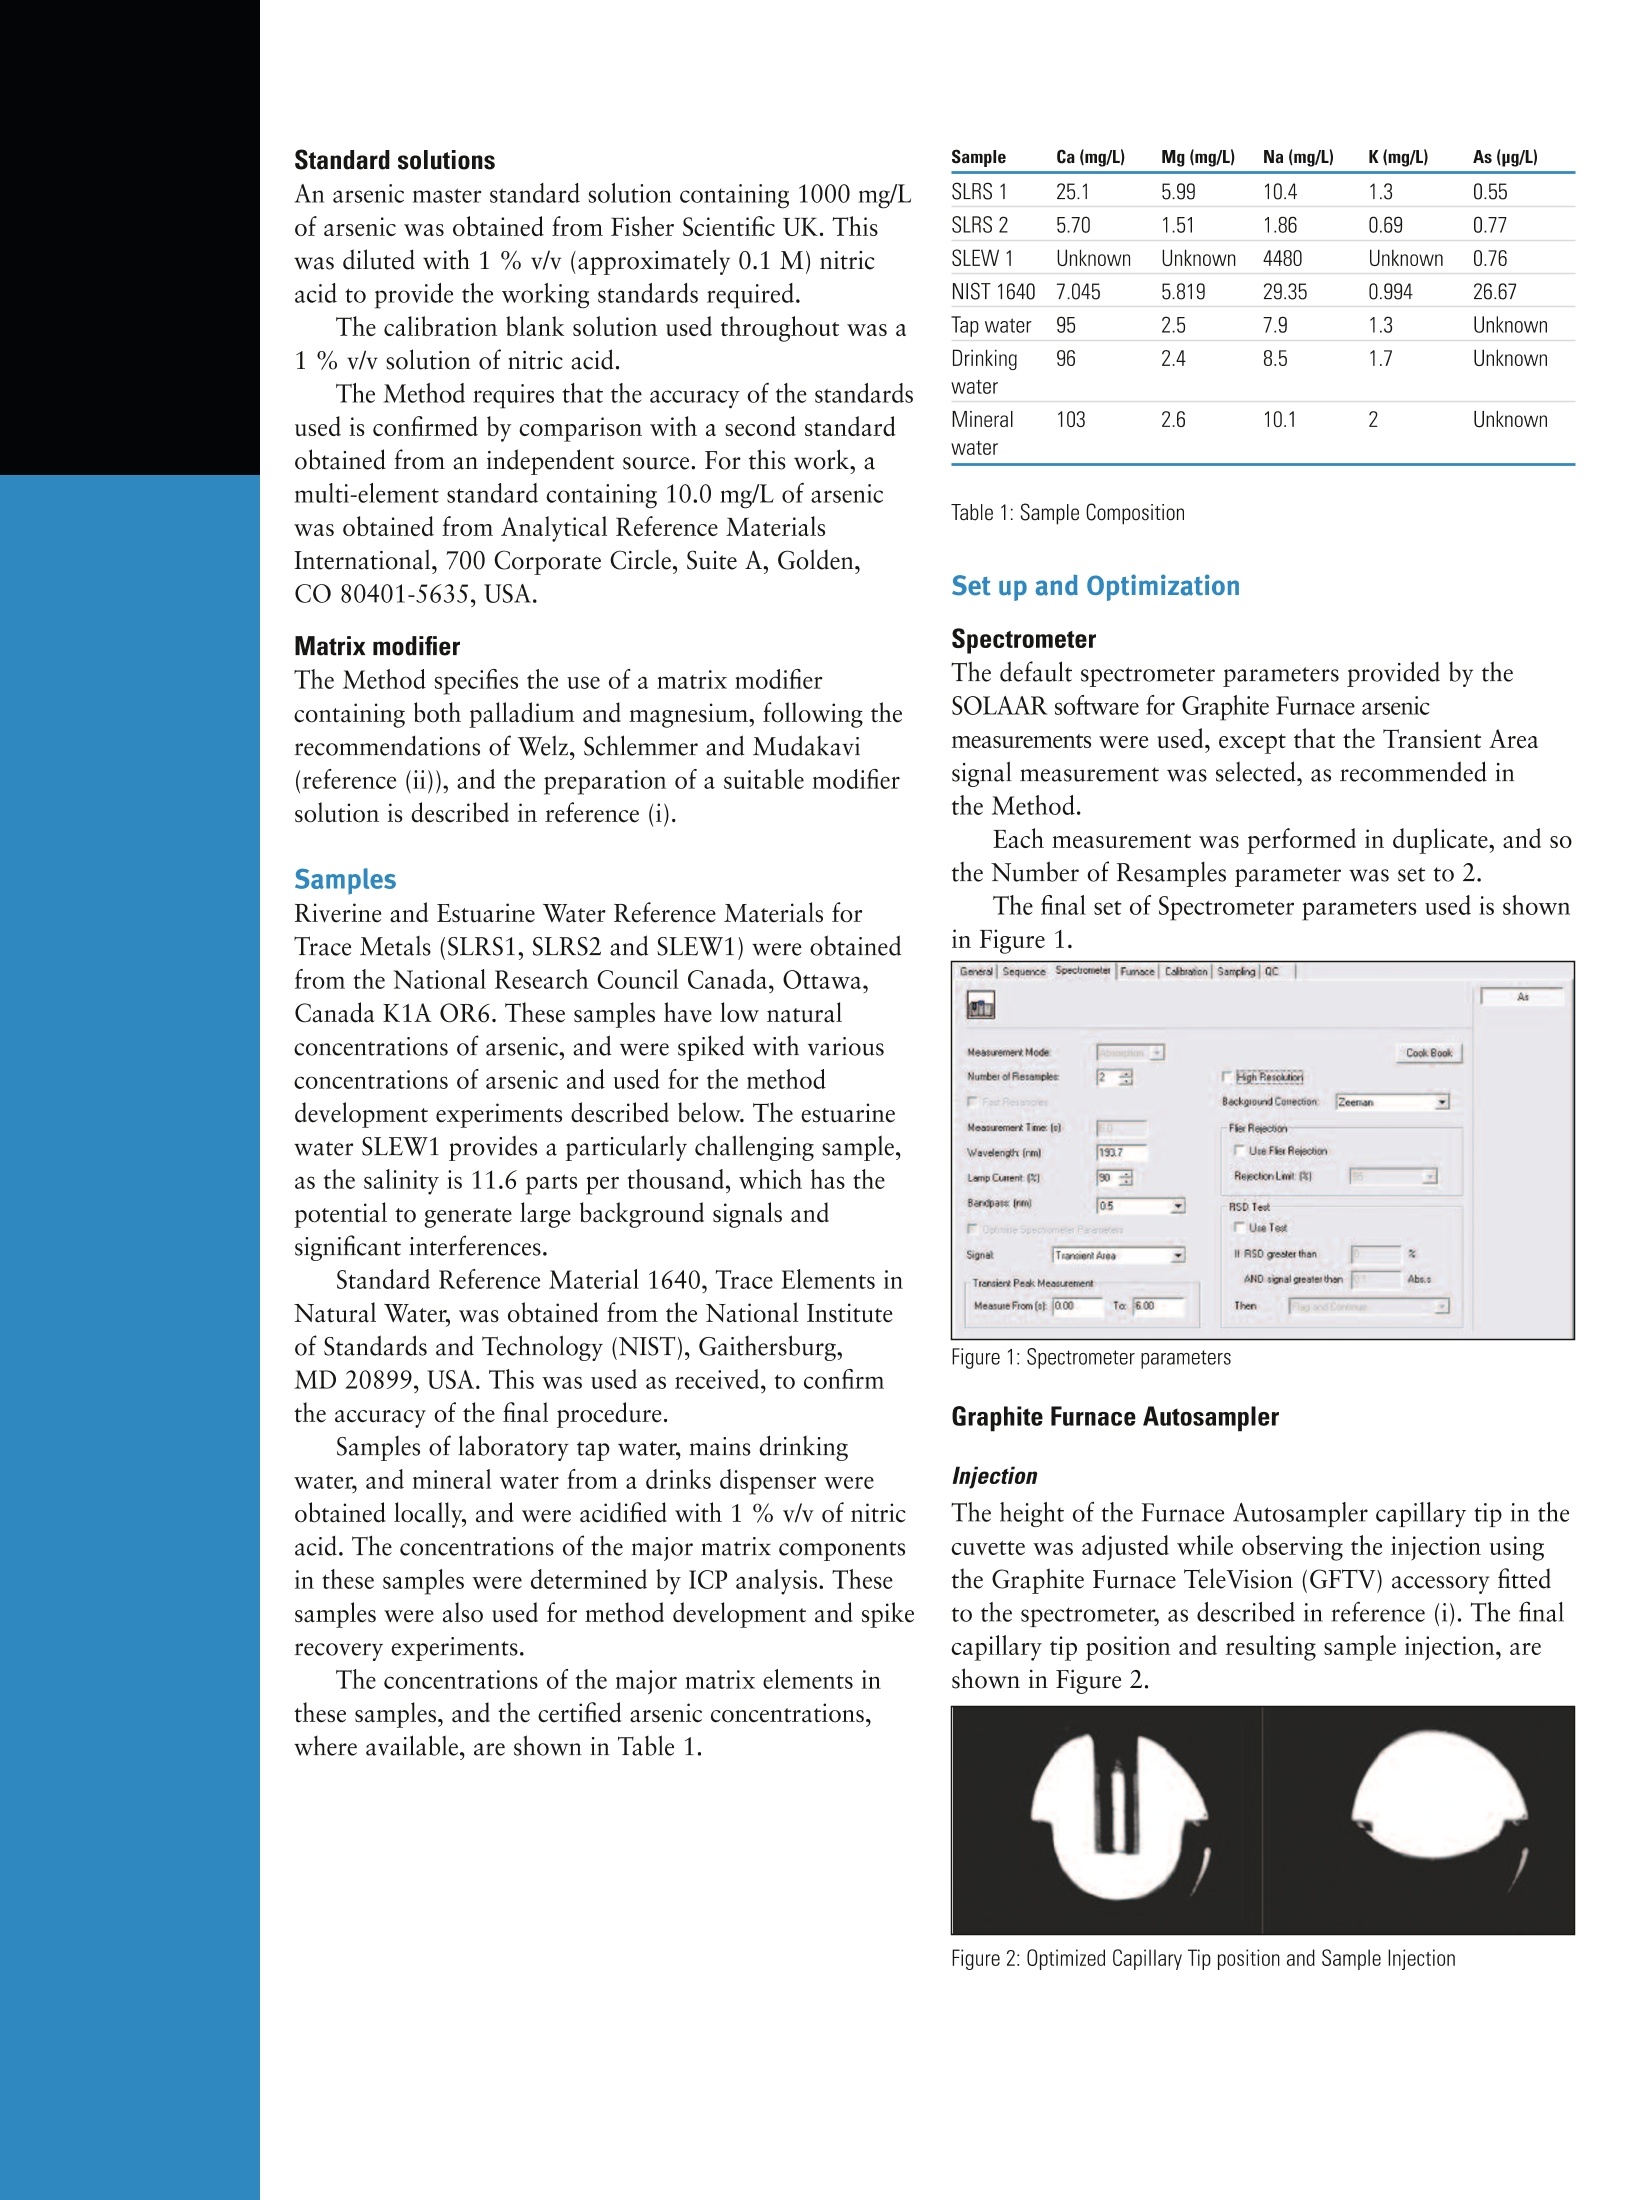
Sampling The results obtained are shown in Table 2 and Figure 8.2009 Thermo Fisher Scientific Inc. All trademarks are the property of Thermo Fisher Scientific Inc. and its subsidiaries. Specifications, terms and pricing are subject to change. Not all productsare available in all countries. Please consult your local sales representative for details.Part of Thermo Fisher Scientific Arsenic in Natural Waters by Graphite FurnaceAtomic Absorption using EPA Method 200.9. Introduction Arsenic occurs naturally in rocks and soil, water, air, andplants and animals. It can be further released into theenvironment through natural activities such as volcanicaction, erosion of rocks and forest fires, or through humanactions. Because it occurs naturally in the environment andas a by-product of some agricultural and industrial activities,it can enter drinking water through the ground or as runoffinto surface water sources. Human exposure to arsenic can cause both short andlong term health effects. Long term exposure to arsenichas been linked to cancer of the bladder, lungs, skin, kidneys,nasal passages, liver and prostate. Non-cancer effects caninclude thickening and discoloration of the skin, stomachpain, nausea, vomiting, diarrhoea, numbness in hands andfeet, partial paralysis, and blindness. Short term exposure to high doses of arsenic can causeother adverse health effects, but such effects are unlikelyto occur from U.S. public water supplies that are incompliance with the arsenic standard. Arsenic has no known beneficial effects, and so theMaximum Contaminant Level Goal for this element hasbeen set to zero by the US Environmental ProtectionAgency (EPA). On January 22, 2001 the EPA adopted anew standard for arsenic in drinking water at 10 parts perbillion (ppb,ng/L),replacing the old standard of 50 ppb.This change removed approval from ICP method 200.7and SM3120B for regulatory drinking water measurementof arsenic, leaving GFAAS as one of the two remainingapproved techniques (in addition to ICP-MS). The rulebecame effective on February 22, 2002. The EPA has setthe arsenic standard for drinking water at this level toprotect consumers served by public water systems fromthe effects of long-term, chronic exposure to arsenic. The determination of arsenic in drinking and naturalwaters is analytically challenging, as the concentrationlevels required by the revised standard are near thedetection limits of common elemental analysisinstruments. In addition, arsenic exists naturally in avariety of chemical forms, including both organic andinorganic compounds, and different oxidation states.These can result in a variety of chemical and physicalinterferences in the analysis. Graphite Furnace AtomicAbsorption Spectrometry is a cost-effective technologythat does have the sensitivity and relative freedom frominterference effects necessary to perform thesemeasurements. EPA Method 200.9 The Environmental Protection Agency has publishedMethod 200.9“Determination of Trace Elements byStabilized Temperature Graphite Furnace AtomicAbsorption”. This method has been approved for use incompliance monitoring programs in both the Clean WaterAct and the Safe Drinking Water Act. The documentedMethod is available in electronic form from the USGovernments National Environmental Methods Indexweb site at:- http://web1.er.usgs.gov/nemi/method_summary.jsp?param_method_id=4797 This Method provides procedures for the determinationof dissolved and total recoverable elements by GraphiteFurnace Atomic Absorption Spectrometry (GFAAS) inground water, surface water, drinking water, storm runoff,and industrial and domestic wastewater. It is alsoapplicable to the determination of total recoverableelements in sediments, soils and sludges. It is currently atRevision 2.2. Method 200.9 applies to a list of 16 elements, whichincludes arsenic. This publication discusses the applicationof the Thermo Scientific AA Spectrometer with ZeemanGraphite Furnace and Graphite Furnace Autosampler tothe measurement of arsenic in natural and drinking watersfollowing the Method 200.9 procedures. It is a companiondocument to reference (i), which discusses the measurementof lead using Method 200.9 methodology with the sameequipment. Graphite Furnace Atomic Absorption SpectrometerThe details, and performance and features of the AASeries spectrometer and accessories used are discussed inthe context of the EPA Method 200.9 in reference (i),where the suitability of the instrument for this work isconfirmed. Reagents and Standards Deionised water Deionised water used throughout this work was obtainedfrom a Millipore Deioniser system. The conductivity ofthe water used was>18 Mohms/cm. Nitric acid High purity concentrated nitric acid (Trace AnalysisGrade) was obtained from Fisher Scientific UK, BishopMeadow Road,Loughborough LE11 5RG, UK. This wasused without further purification. An arsenic master standard solution containing 1000 mg/Lof arsenic was obtained from Fisher Scientific UK. Thiswas diluted with 1 % v/v (approximately 0.1 M) nitricacid to provide the working standards required. The calibration blank solution used throughout was a1% v/v solution of nitric acid. The Method requires that the accuracy of the standardsused is confirmed by comparison with a second standardobtained from an independent source. For this work, amulti-element standard containing 10.0 mg/L of arsenicwas obtained from Analytical Reference MaterialsInternational, 700 Corporate Circle, Suite A, Golden,CO 80401-5635、USA. Matrix modifier The Method specifies the use of a matrix modifiercontaining both palladium and magnesium, following therecommendations of Welz, Schlemmer and Mudakavi(reference (ii)), and the preparation of a suitable modifiersolution is described in reference (i). Samples Riverine and Estuarine Water Reference Materials forTrace Metals (SLRS1, SLRS2 and SLEW1) were obtainedfrom the National Research Council Canada, Ottawa,Canada K1A OR6. These samples have low naturalconcentrations of arsenic, and were spiked with variousconcentrations of arsenic and used for the methoddevelopment experiments described below. The estuarinewater SLEW1 provides a particularly challenging sample,as the salinity is 11.6 parts per thousand, which has thepotential to generate large background signals andsignificant interferences. Standard Reference Material 1640, Trace Elements inNatural Water, was obtained from the National Instituteof Standards and Technology (NIST), Gaithersburg,MD 20899, USA. This was used as received, to confirmthe accuracy of the final procedure. Samples of laboratory tap water, mains drinkingwater, and mineral water from a drinks dispenser wereobtained locally, and were acidified with 1 % v/v of nitricacid. The concentrations of the major matrix componentsin these samples were determined by ICP analysis. Thesesamples were also used for method development and spikerecovery experiments. The concentrations of the major matrix elements inthese samples, and the certified arsenic concentrations,where available, are shown in Table 1. Sample Ca (mg/L) Mg (mg/L) Na (mg/L) K (mg/L) As (pg/L) SLRS 1 25.1 5.99 10.4 1.3 0.55 SLRS 2 5.70 1.51 1.86 0.69 0.77 SLEW 1 Unknown Unknown 4480 Unknown 0.76 NIST 1640 7.045 5.819 29.35 0.994 26.67 lap water 95 2.5 7.9 1.3 Unknown Drinking 96 2.4 8.5 1.7 Unknown water Mineral 103 2.6 10.1 2 Unknown water Table 1: Sample Composition Set up and Optimization Spectrometer The default spectrometer parameters provided by theSOLAAR software for Graphite Furnace arsenicmeasurements were used, except that the Transient Areasignal measurement was selected, as recommended inthe Method. Each measurement was performed in duplicate, and sothe Number of Resamples parameter was set to 2. The final set of Spectrometer parameters used is shownin Figure 1. Figure 1: Spectrometer parameters Graphite Furnace Autosampler Injection The height of the Furnace Autosampler capillary tip in thecuvette was adjusted while observing the injection usingthe Graphite Furnace TeleVision (GFTV) accessory fittedto the spectrometer, as described in reference (i). The finalcapillary tip position and resulting sample injection, areshown in Figure 2. Figure 2: Optimized Capillary Tip position and Sample Injection The Furnace Autosampler Sampling parameters were setup as described in reference (i). Although the Furnace Autosampler automaticallyincludes a wash cycle after every injection, it has an additionalfacility that will cause a second wash cycle to be performedif the previous signal exceeds a specified value. This wasfound to be useful to improve the on-going CalibrationBlank QC measurements described below. A trigger value of0.3 abs.s was used, equivalent to a concentration ofapproximately 60 pg/L. The final set of Sampling parameters used is shown inFigure 3. Figure 3: Sampling parameters Graphite Furnace Program Dry phase Optimization of the Dry phase of the Furnace Programusing the GFTV image was described in reference (i). Ash and Atomize phases Table 2 of the Method recommends Ash (Char) andAtomisation temperatures of 1300°℃ and 2200℃respectively for arsenic, but also suggests that these shouldbe optimized for individual instruments. The automaticAsh Atomize function provided in the SOLAAR softwarewas therefore used to optimize these parameters. A typical, automatically generated Ash Atomise plotfor a sample of the NIST 1640 water CRM is shown inFigure 4. This plot also shows that Ash (Char) temperaturesup to 1550 °C can be used without loss of the analyte. Figure 5: Automatic Ash Atomize plot for spiked SLEW1 sample The Ash Atomize plot for the high matrix SLEW1sample is shown in Figure 5. This shows that, as expectedfrom the high salinity of this sample, there is a very highbackground signal, which decreases as the ash temperatureincreases. Although the Zeeman background correctionsystem that is fitted to the spectrometer is perfectly capableof handling these large background signals, it is preferableto select conditions to minimize the background signal inorder to reduce the severity of gas phase interferencesresulting from the co-volatilisation of the analyte and theresidual matrix. Paragraph 10.2 of the Method suggeststhat the Ash temperature should be set to at least 100 Cbelow the maximum that can be used without analyteloss,and for this work, a final Ash temperature of 1350 ℃was used. The estuarine water sample SLEW1 showed the largestbackground signal of any of the samples investigated, andso the Ash time was selected to minimize this. A final timeof 30 seconds was used, with a fast ramp of 1000 °C/sfrom the Dry phase. The plots show that an Atomize temperature of 2250 ℃is the optimum for these samples, slightly higher than the2200 ℃ value suggested in the Method.Although the areaof the signal remained approximately constant as theatomize phase temperature was increased above 2250 ℃,the signal peaks became significantly narrower and higherat the higher atomization temperatures, and as little as100C change increased the signal peak height by 40 %(Figure 6). There are benefits from working with thelower, broader peaks generated using the minimum usableatomization temperature, particularly in extending thelinear dynamic range (LDR), and so an atomizationtemperature of 2250 ℃ was used. At this temperature, anatomization time of 6 s was required to ensure that theentire signal was captured. Figure 6: Arsenic signals at different Atomization Temperatures Although the default furnace program automaticallyincludes a Cuvette Clean phase, there is an additionalfacility that will cause a full Cuvette Clean cycle to beperformed if the previous signal exceeds a specified value.This was found to be useful to improve the on-goingCalibration Blank QC measurements described below.The trigger value was set to 0.3 abs.s, equivalent to aconcentration of approximately 60 ug/L. The final set of Graphite Furnace parameters used isshown in Figure 7. Figure 7: Optimized Furnace Program Initial Demonstration ofPerformance Each laboratory using the 200.9 Method is required tooperate a formal Quality Control (QC) program, includingan Initial Demonstration of Performance. This is discussedin detail in reference (i). Linear Dynamic Range The details of the experiments used to determine theLinear Dynamic Range (LDR) using the automaticstandard preparation facilities provided by theFurnace Autosampler are described in reference (i).A master standard solution containing 200 pg/L ofarsenic was used. concentration response signal estimation (pg/L) (abs.s) response (abs.s) (abs.s) 0 0.00137 20 0.14969 40 0.28474 60 0.41777 80 0.54436 100 0.64355 0.68580 0.04225 6% 120 0.74585 0.82121 0.07536 9% 140 0.82665 0.95662 0.12997 14% 160 0.92893 1.09202 0.16309 15% 180 1.0118 1.22743 0.21563 18% 200 1.09035 1.36283 0.27248 20% Table 2: LDR Results Figure 8: LDR Estimation The results show that, as expected, the calibration issignificantly curved at the higher signal values. A leastsquares linear fit to the blank and first four calibrationpoints gave an excellent straight line, with a correlationcoefficient (R2 value) of 0.9992. The signal response forthe 120 ug/L standard is 9 %down from the value estimatedby extrapolating this line, and so the upper limit of theLDR is at this level. Although the peak area signal used to calculate thesample concentration results remains reasonably constantfor any sample as the atomization temperature is increasedabove the minimum value, the peak height increases sharplywith increasing atomisation temperature, as shown inFigure 6. The curvature of the calibration plot dependsstrongly on the height of the signal, even though it is thearea that is actually being measured. Higher atomizationtemperatures, that generate tall, narrow peaks, therefore,reduce the upper limit of the LDR. For this work, theminimum atomization temperature was used, giving lowerbroad peaks that in turn maximise the upper limit of theLDR. Calibration parameters Based on the results of the LDR estimation, a top standardconcentration of 100 pg/L was used. Even though this iswell below the upper limit of the LDR defined by the Method,the calibration graph shows a small amount of curvature.The Furnace Autosampler was used to automatically dilute a 100 ug/L standard to provide three calibrationpoints, and the Segmented Curve calibration algorithmprovided in the SOLAAR software was used to eliminatethe effects of the residual curvature. The final calibration parameters used are shown inFigure 9, and a typical calibration graph measured withthese parameters is shown in Figure 10. Figure 9: Calibration parameters Figure 10: Typical calibration graph Quality Control Sample The Method specifies that the calibration standards andacceptable instrument performance must be verified by thepreparation and analysis of a Quality Control Sample (QCS).The QCS used in this work contained 20.0 pg/L of arsenic,and was prepared from a Test Standard supplied byAnalytical Reference Materials International, as describedin reference (i) Five separate samples of the QCS were analyzed atvarious times throughout this work, and the results areshown in Table 3. QCS 1 20.0 QCS 2 20.4 QCS 3 19.3 QCS 4 20.0 QCS 5 19.5 Mean 19.8 Relative standard deviation 2.3 % Recovery 99.0 % Table 3: QCS Analysis Results The signal response recorded for the QCS measurementswas approximately 0.13 abs.s. The Method requires thatthe analytical signal measured for the QCS should beapproximately 0.1 abs.s, and the measured concentrationshould be within ±10 % of the stated value. These resultsconfirm that the calibration standards and instrumentperformance are acceptable. Method Detection Limit The Method requires that the Method Detection Limit(MDL) must be established for all analytes, and the procedurefor doing this is described in detail in reference (i). The Check Instrument Performance Wizard providedin the SOLAAR software was first used to estimate the[nstrumental Detection Limit. The results of three separateruns of the Wizard,performed at various times throughoutthis investigation are shown in Table 4. Concentration Detection (pg/L) Limit (pg/L) 1 0.7 1.5 0.1 None 2 0.6 1.4 0.6 None 3 0.7 1.2 0.2 None Mean 0.67 1.4 Table 4: IDL Results The Drift factor estimates the contribution that anytime dependent variations of the results make to thecalculated detection limit -values less than 1 indicate thattime dependent variations are not significant. The Wizarddid not generate any warnings, indicating that its internalstatistical tests were satisfied. The IDL for arsenic measuredunder the conditions described has therefore been shown tobe1.4 pg/L. The procedure for estimating the MDL requires thatthe laboratory blank (1 % nitric acid) should be fortifiedwith the analyte at a level of 2-3 times the estimated IDL.For initial estimates of the MDL, the laboratory blank wastherefore fortified with 2.5 ug/L of arsenic. The Methodrequires that the relative standard deviation of the sevenreplicate results used to calculate the MDL should be greaterthan 10%, to confirm that the analyte concentration in thefortified blank is not inappropriately high. For thesemeasurements, the relative standard deviation of the sevenmeasurements was consistently lower than 10 %, and so anew set of solutions fortified to 1.0 ug/L was used. Theresults of a typical set of 7 replicate analyses of thesesolutions is shown in Table 5. MDL1 1.18 MDL2 0.77 MDL3 0.70 MDL4 1.16 MDL5 0.91 MDL6 0.98 MDL7 1.24 Mean 0.99 Method Detection Limit 0.66 Relative Standard Deviation 21.2% Table 5: MDL Results The MDL was estimated five times during this work,as part of other analytical runs. All estimates met the criteriaset out in the Method. The mean value of all the estimateswas 0.6 ug/L, which can be considered to be representativeof the performance of the laboratory and the instrument.The relative standard deviation of the MDL from all theestimates was 12 %. Table 2 of the Method shows some typical singlelaboratory MDLs; the MDL value given for arsenic is0.5 ug/L. However, MDL values themselves will showvariations, as they are calculated using statistics based onsmall numbers of replicates. The upper limit of the LDR for arsenic has been shownto be 120 pg/L. Recovery of the arsenic contained in theQCS sample was 99.0 %, and the Method Detection Limitwas found to be 0.6 ug/L. These results obtained confirm that the Thermo ScientificGFAAS instrument meets or exceeds the requirements setout for the Initial Demonstration of Performance in theEPA 200.9 Method for the determination of arsenic. Assessing Laboratory Performance Section 9.3 of the Method sets out a number of QCprocedures intended to assess the laboratory performance.These must be followed for each batch of samples that areanalysed, and are discussed in detail in reference (i). Several typical batches of samples were analyzed duringthis work, using the analysis parameters developed asdescribed above, and the specified QC procedures wereincluded in the Analysis Sequence. The QC procedureswere implemented using the automatic QC Test functionalityprovided in the SOLAAR software. The QC results obtained during a typical run areshown in Table 6. Result(pg/L) Result (pg/L) Initial IPC 51.2 50.0 ±5 % PASS (47.5-52.5 pg/L) Calibration 0.6 0 ±DL PASS blank (±1.2 ug/L) LRB nd 0 <2.2*MDL PASS (<1.3 ug/L) LFB 19.3 20.0 85-115% PASS (17-23 pg/L) Continuing 53.0 50.0 ±10% PASS IPC 1 (45-55 pg/L) Calibration nd 0 +IDL PASS blank (±1.2 ug/L) Continuing 51.9 50 ±10% PASS IPC 2 (45-55 pg/L) Calibration 0.7 0 ±IDL PASS blank (±1.2 ug/L) Final IPC 50.7 50 ±10% PASS (45-55 pg/L) Calibration nd 0 ±IDL PASS blank (±1.2 pg/L) nd= not detected. The measured result was below the MDL of 0.6 ug/L.Table 6: Typical QC Results from a sample run The database filtering functions provided by the SOLAARsoftware were used to automatically collate the results forthe Continuing Instrument Performance Check for thesample runs performed over a four week period, andpresent them as QC Control Chart, shown in Figure 11. Figure 11: Continuing IPC results over 4 weeks All the results are comfortably within the controllimits, and show that the analysis is under control. Analyte Recovery and Data Quality Section 9.4 of the Method defines a series of procedures fordetermining the analyte recovery of Laboratory FortifiedMatrix (LFM) samples. Analyte recoveries must be in therange 70 -130 %. The Method also specifies that thebackground absorbance signal from the samples must be<1.0 abs.s before the results can be considered to be reliable. For this work, analyte recoveries for all the samplesanalysed were assessed by automatically spiking the samplesusing the Furnace Autosampler facilities. The spike increasedthe sample concentration by an amount equivalent to 25 ug/Lin the original sample. Typical results obtained are shown in Table 7. signal concentration sample Recovery (abs.s) (pg/L) concentration (pg/L) SLRS 1 0.04 nd 23.0 92% SLRS 2 0.04 nd 25.0 100 % SLEW1 0.30 nd 19.8 79 % lap water 0.07 nd 22.8 91 % Drinking water 0.06 nd 22.1 88% Mineral water 0.07 0.7 23.3 93 % nd= not detected. The measured result was below the MDL of 0.6 pg/L. Table 7: LFM results The background signals recorded for these samples areall well below the 1.0 abs.s limit, and so the results can beconsidered to be reliable. All the recoveries are within theacceptable range, and so this implementation of the Methodhas been shown to give acceptable analyte recoveries for thesamples examined. The Method goes on to define procedures that should beused when the analyte recoveries fall outside the acceptablelimits. Although the recovery from the SLEW1 LFM sampleis within the limits specified in the Method, it is significantlypoorer than the recovery from the other samples investigated.The SLEW1 sample, and an LFM prepared from it, weretherefore analyzed using the Method of Standard Additions(MSA), as defined in Section 11.5 of the Method. The LRB,LFB and QCS samples were also measured using the MSAin the same run. signal concentration concentration (abs.s) (pg/L) (pg/L) LRB nd LFB 20.2 104% QCS 19.6 99.2% SLEW1 0.15 nd 25.1 100.4% nd= not detected. The measured result was below the MDL of 0.6 pg/L.Table 8: Results using MSA calibration The Standard Additions calibration graph for theSLEW1 LFM is shown in Figure 12. As a further check on the Data Quality, a sample of theNIST 1640 Certified Reference Material (Trace Elements inNatural Water) was analyzed five times over a period offour weeks. The arsenic concentration in this material iscertified at 26.67±0.41 ug/Kg. The mean measured resultobtained was 25.0 pg/L, with a relative standard deviationof 4.6 %. This is 94 % of the Certified value. The Analyte Recovery criteria set out in the 200.9Method have been easily achieved with a range of samplesanalyzed using the Thermo Scientific instrument. The recoverywas close to the lower limit of the criteria for one sampleinvestigated, but calibration using the Method of StandardAdditions resulted in full recovery. The Data Quality ofthe measurement system has been further confirmed by theacceptable recovery of the analyte from a CertifiedReference Material. Conclusions The Thermo Scientific Spectrometer fitted with the ZeemanGraphite Furnace and Graphite Furnace Autosampler is entirelysuitable for the determination of arsenic concentrations innatural water samples using the EPA 200.9 methodology. TheMethod Development Tools provided, particularly theGraphite Furnace TeleVision accessory and the automatic AshAtomize experiment, allow the instrument parameters to bequickly and reliably optimized. The analytical performance of the system meets all theperformance criteria set out in the Method, and thecomprehensive QC Tests facilities provided in the SOLAARsoftware permit the detailed Quality Control requirementsof the Method to be quickly and simply set up. The flexibleCalibration functions, together with Furnace Autosamplerfacilities, allow the Method of Standard Additions calibration strategy to be easily implemented if necessary. References i) Lead in Natural Waters by Graphite Furnace Atomic Absorption usingEPA Method 200.9. Thermo Scientific publication number AN40849ii) Palladium Nitrate-Magnesium Nitrate Modifier for Electrothermal AtomicAbsorption Spectrometry. Welz, Schlemmer and Mudakavi, Journal ofAnalytical Atomic Spectrometry, vol. 7, p1257, 1992. The method of sample treatment described in this publication should be performedonly by a competent chemist or technician trained in the use of safe techniques inanalytical chemistry. Users should acquaint themselves with particular hazardswhich may be incurred when toxic materials are being analysed and handled in theinstruments, and the instrument must be used in accordance with the operatingand safety instructions given in the Operators manual. The exact model of instrument on which this analysis was performed may differfrom that stated. A/though the contents have been checked and tested, thisdocument is supplied for guidance on the strict understanding that neither ThermoFisher Scientific, nor any other person, firm, or company shall be responsible forthe accuracy or reliability of the contents thereof, nor shall they be liable for any/oss or damage to property or any injury to persons whatsoever arising out of theuse or application of this method.
关闭-
1/7
-
2/7
还剩5页未读,是否继续阅读?
继续免费阅读全文产品配置单
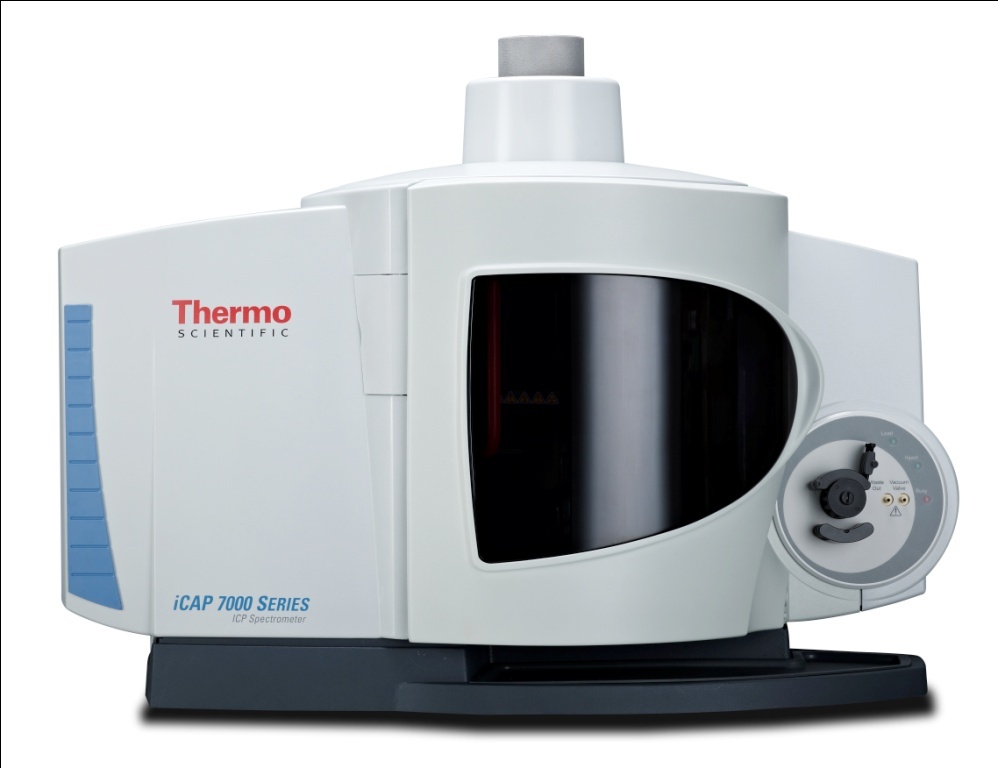
深圳市瑞盛科技有限公司为您提供《环境水中(类)金属及其化合物检测方案 》,该方案主要用于环境水(除海水)中(类)金属及其化合物检测,参考标准《暂无》,《环境水中(类)金属及其化合物检测方案 》用到的仪器有赛默飞iCAP Q ICP-MS、Thermo Fisher ICAP-7200 电感耦合等离子发射光谱仪、Thermo Scientific iCAP 7000 。
我要纠错
推荐专场
ICP-MS电感耦合等离子体质谱
更多相关方案


 咨询
咨询