丙酮,水,液体混合,吉布斯表面,吸附层,结构和能级中和频光谱,分子能级,表面特性,分子光谱检测方案(其它光谱仪)
检测样品 其他
检测项目 和频光谱,分子能级,表面特性,分子光谱

 金牌会员
752 篇解决方案
金牌会员
752 篇解决方案
方案详情文
智能文字提取功能测试中
J. Phys. Chem. B 2005, 109,8053-80638053 Chen et al.J. Phys. Chem. B, Vol. 109, No. 16,20058054 10.1021/jp050188e CCC: $30.25 C 2005 American Chemical SocietyPublished on Web 03/26/2005 Determination of Structure and Energetics for Gibbs Surface Adsorption Layers of BinaryLiquid Mixture 1. Acetone + Water Hua Chen,t Wei Gan, Bao-hua Wu,t Dan Wu,t* Yuan Guo, and Hong-fei Wang* State Key Laboratory of Molecular Reaction Dynamics, Institute of Chemistry, Chinese Academy of Sciences,Beijing, P.R. China 100080 Received: January 11, 2005; In Final Form: February 27, 2005 The orientation, structure, and energetics of the vapor/acetone-water interface are studied with sum frequencygeneration vibrational spectroscopy (SFG-VS). We used the polarization null angle (PNA) method in SFG-VS to accurately determine the interfacial acetone molecule orientation, and we found that the acetone moleculehas its C=0 group pointing into bulk phase, one CHs group pointing up from the bulk, and the other CHgroup pointing into the bulk phase. This well-ordered interface layer induces an antiparallel structure in thesecond layer through dimer formation from either dipolar or hydrogen bond interactions. With a double-layeradsorption model (DAM) and Langmuir isotherm, the adsorption free energies for the first and second layerare determined as AG°ads,1 =-1.9 ± 0.2 kcal /mol and AG°ads,2 =-0.9±0.2 kcal /mol, respectively.Since AG°ads,l is much larger than the thermal energy kT = 0.59 kcal /mol, and AG°ads,2 is close to kT, thesecond layer has to be less ordered. Without either strong dipolar or hydrogen bonding interactions betweenthe second and the third layer, the third layer should be randomly thermalized as in the bulk liquid. Therefore,the thickness of the interface is not more than two layers thick. These results are consistent with previousMD simulations for the vapor/pure acetone interface, and undoubtedly provide direct microscopic structuralevidences and new insight for the understanding of liquid and liquid mixture interfaces. The experimentaltechniques and quantitative analysis methodology used for detailed measurement of the liquid mixture interfacesin this report can also be applied to liquid interfaces, as well as other molecular interfaces in general. 1. Introduction Gibbs and Langmuir laid out the basis for thermodynamictreatment and structural understanding of the structure andenergetics of free liquid and liquid mixture interfaces in 1875and 1917, respectively.-3 Even though surface and colloidalchemistry have found great applications in various chemical,food, and pharmaceutical industries, based on the knowledgeaccumulated over the decades after applying Gibbs and Lang-muir’s ground breaking ideas,4-6 the lack of effective methodsfor probing molecular detail of liquid and liquid mixtureinterfaces has kept us from better microscopic understandingof the chemically and biologically important phenomena at theseinterfaces, even for the simplest systems, until very recently.7-9Recent progress on intensive experimental,7,8,10-15 theoreti-cal,16,17 and simulation and computational18-24 studies of liquidand liquid mixture interfaces have provided much promise forbetter detailed microscopic understanding of the vapor/liquidand liquid/liquid interfaces, especially for the aqueous inter-faces.25 Comparison between experimental and theoreticalsimulations for benchmark molecular systems has been con-ducted intensively.9,12,23,26-30 However, the liquid interface isstill a very elusive entity, being generally considered dynamic,disordered, and small, and it is still difficult for directexperimental measurement and accurate simulation of theirstructure and energetics.6,9,24,31 ( * T o w hom c o rrespondence s h ould be addressed. E-mail: ho ngfei@ mrdlab.icas.ac.cn. Tel . 8 6 -10-62555347; Fax 86-10-62563167. ) ( t Also graduate s tudents o f the Graduate school of the Chinese Academy of Sciences. ) ( 7 Also research intern at Institute of Chemistry, and undergraduate student at the Department o f C hemical P hysics, University of Science and Technology of Shinan hefore Hly2004, ) The promises of direct experimental measurement of liquidinterfaces and of discerning their structure and energetics at themolecular and microscopic detail dawned upon the developmentof the nonlinear optical spectroscopic techniques, such as thesurface second harmonic (SHG) and sum frequency generationvibrational spectroscopy (SFG-VS), since the early 1980s, forSHG and SFG-VS are nonintrusive and with unique submono-layer sensitivity and interface specificity.7,8,32,33 SFG-VS isespecially promising because it is the only technique that canyield a vibrational spectrum for molecules at a free liquid orliquid mixture interface, and it is common knowledge inchemistry and biology that molecular vibrational spectra canbe directly related to molecular structure, conformation, andenergetics of molecular species. However, obstacles for accuratespectral assignment and quantitative interpretation of the SFG-VS and SHG data have persisted until very recently, and thissituation has been holding the progress for further applicationsof SFG-VS and SHG as the quantitative and accurate interfaceprobing techniques.34,35 There has been a continuous andsystematic effort for trying to remove such obstacles and toimprove the capability of accurate and quantitative applicationsof SFG-VS and SHG techniques by many research groups,36-43including progress in our laboratory most recently.44-49 Based on the ideas pioneered by Shen, Hirose, and Eisenthalet al.,35,38-41 we have developed quantitative orientational andpolarization analysis methodologies with SHG and SFG-VS forinterfaces with macroscopic symmetry of Coou, i.e.,rotationallyisotropic around the interface normal.44-48 In this and a seriesof following reports we shall show that these developments areparticularly useful for detailed analysis of the structure, con-formation, and energetics of the free liquid and liquid mixtureinterfaces. We have shown and shall continue to show that these advancements are not only merely simplification with bettermathematical formulations but also imply conceptual signifi-cance in exploring the capability of SHG and SFG-VS onordered molecular systems.44,47 Some of the key developmentsare summarized in the following in particular. (a) SHG and SFG intensity from a Coou interface in anyparticular polarization configuration can be expressed in thefollowing form.35,44,46 Equation 1 is the general expression for the SFG-VS intensityas known in the literature. SHG is the degenerated case for SFG,so these expressions also stand for SHG with minor differencesof constants.35,44 Equations 2, 3, and 4 are from our recentdevelopments.44,46,47 In eq 1, w, ωi, and ω are the frequenciesof the SF signal, visible laser beam, and IR laser beam,respectively. The term n(ω;) is the refractive index of bulkmedium i at frequency ωi, and n’(ω;) is the effective refractiveindex of the interface layer at ωj. is the incident or reflectionangle from interface normal of the ith light beams; I(ω;) is theintensity of the SFG signal or the input laser beams, respectively.The notations and the experimental geometries were describedin detail previously 35,46 We have shown that xe could besimplified into eq 2 for interfaces with macroscopic symmetryof Cou, i.e., rotationally isotropic around the interface normal.44,46We also pointed out that a general formulation for treatmenton linear and nonlinear susceptibilities of ordered monolayers,as well as ordered molecular films, with coherent and incoherentlinear and nonlinear optical techniques can also be similarlyformulated.47 In eq 2, N, is interface molecular number density,0 is thetilting angle between the molecular main (z') axis and theinterface normal (z axis) in the laboratory coordinates, r(0) iscalled the “orientational field functional", which contains allmolecular orientational information at a given SFG experimentalconfiguration; while the dimensionless parameter c is called the"general orientational parameter”, which determines the orien-tational response r(0) to the molecular orientation angle 0; andd is the susceptibility strength factor, which is a constant in acertain experimental polarization configuration with a givenmolecular system. The d and c values are both functions of therelated Fresnel coefficients, including the refractive index ofthe interface and the bulk phases, and the experimentalgeometry. Both d and c could be derived from the expressionsof the Xen in relationship to the macroscopic susceptibility andmicroscopic (molecular) hyperpolarizability tensors for a par-ticular molecular (microscopic) symmetry.44,46 In eq3, A is an experimental constant. It is clear that theSFG intensities for different experimental configurations areclearly parametrized in eq 3, and the term dR(0),r(0) combinedor separately, plays a central role in quantitative polarizationand orientation analysis of the SFG and SHG experiments.44,46More comprehensive discussions of the advantages, details foranalysis, and possible applications in SHG and SFG with sucha formulation was presented in our previous works.44,46 (b) With the formulation in (a), polarization selection rulesfor vibrational spectral analysis in SFG-VS have been derivedfor molecular groups with different molecular (microscopic)symmetries, using the C-H stretching vibrational modes formethyl (C3u), methylene (C2v), and methine (Coou) groups asworking examples.46,48 C-H stretching vibrational modes havebeen complex and difficult in IR and Raman spectroscopy.50-54With these polarization selection rules, not only have clear andunambiguous assignment of the SFG-VS spectra for C-Hstretching vibrational modes been achieved, but also quite a fewissues in the previous IR, Raman, and SFG-VS spectralassignments were clarified.46,48 From these applications, it hasbeen shown that the formulation is very effective for solvingproblems in polarization and orientation analysis with SFG-VS. It is because the SHG and SFG-VS are coherent polarizationspectroscopic methods, and interfaces are preferentially orientedmolecular systems. The polarization selection rules and polar-ization analysis of other molecular groups and symmetries canbe worked out similarly. This development could significantlyhelp the applications of SFG-VS for more complex molecularinterfaces, such as polymer films and biomembranes. (c) With eq 4, it is clear that when R(0) = 0, co = D =(cos0)/(cos30). Therefore, the orientational parameter D couldbe accurately measured with the polarization null angle (PNA)method.44,45,49 Because x can be expressed as the linearcombination of the sin and cos9 terms, in PNA, a polarizationangle nul for the SF signal satisfies a zero (null) value of theSF intensity, i.e., I(ω) cc| sin(Q - nuli)12= 0, when thepolarization angle for visible (Qi) and IR (Q2) are at fixedvalues, usually with =0 and Q2=45°or-45°45 Usingthis accurately measured null value, a D value can be explicitlycalculated with the known experimental configuration param-eters.44,45,49 Thus, the determined D value has a high accuracy,even for the case when the widely used intensity ratio betweentwo different polarizations, usually with Issp(@)/Isps(@), failedto have a certain value when Isps(w) is close to the noiselevel.44,45 Here s is defined as the polarization perpendicular tothe incident plane; and p is polarization in the incident plane.The symbol ssp indicates that the SF, visible, and IR beamsare polarized in s, s, p directions, respectively, and so on. Wehave shown that with PNA, as well as with the generalformulation of the orientational parameter D,49 the orientationaltilt angle O for the CH groups at vapor/methanol and vapor/acetone interfaces can be determined accurately.45,49 Thisdevelopment not only provides a direct measurement of theinterface structure and conformation, but also provides a wayto decouple the orientational contribution R(0) and surfacedensity N, in eq 3, ensuring detailed structural and energeticsanalyses of the Gibbs adsorption thermodynamics. A particularly important issue in above quantitative polariza-tion and orientational analysis is what is the value for theeffective dielectric constant, i.e., microscopic local field factors,in the interface layer.35,44-46A general treatment of themicroscopic local field factors in a polarizable two-dimensionalmolecular layer adsorbed on metal interface was formulated byYe and Shen in 1983.55 Recently, a formulation for the simpleliquid interface based on a modified Lorentz model was alsodescribed by Shen et al.35 These two treatments agree well forsimple liquid interfaces under the nonresonant conditionsbecause the value of the linear molecular polarizability is usuallysmall. The problem and consequences of the microscopic localfield corrections in SHG and SFG-VS can also be explicitlyaddressed with the formulation in (a). We shall report thiselsewhere. Without much further ado, we will follow the modified Lorentz model in our SFG-VS treatment of the liquidinterfaces, which has been successfully applied to SFG-VS sofar 35,45,46,48 We shall show in this report that a general approach in SFG-VS based on the above developments can be used to obtaindetailed information on the structure and energetics of the Gibbssurface layers at the vapor/acetone-water mixture interface.First, we shall use the PNA method to determine the orientationof acetone molecule at the interface at various acetone concen-trations. Second, by separating the contributions from theorientation and surface density, we shall identify the two-layerstructure of the vapor/acetone-water mixture interface. Finally,we use a double-layer adsorption model (DAM) and Langmuirisotherm to obtain the adsorption free energies of the acetonemolecule for the first and second layer adsorptions. Our findingsshow that the acetone molecules are well ordered in the firstlayer, and this layer induces a partially ordered second layerwith an antiparallel structure. This structure should prevent theformation of the third layer, which is already fully thermalizedas part of the bulk phase. The adsorption free energies for thetwo adsorption layers are AG°ads,1=-1.9±0.1 kcal/mol andAG°ads,2=-0.9±0.2 kcal/mol,respectively. AG ads,2 is notmuch bigger than the thermalization energy kT = 0.59 kcal/mol at the ambient temperature of 295 K. Therefore, the secondlayer can only be partially ordered, i.e., not as ordered as thefirst layer. This is the first time such detailed information hasbeen directly obtained for any liquid or liquid mixture interface,and it opens the door for further understanding of the importantissues for liquid interface in general. 2. Experimental Section Our picosecond SFG-VS spectrometer was from EKSPLA,and it has been described in detail previously.46 Briefly, the 10Hz and 23 picosecond SFG spectrometer laser system is usinga co-propagating configuration. Some of the SFG polarizationoptics were rearranged from the original design by EKSPLAto improve the polarization control in the SFG experiment.4The visible wavelength is fixed at 532 nm and the full range ofthe IR tunability is 1000 cm-l to 4300 cm-l. The incident anglesare i = 62°±1° for the visible beam, and β2 = 52°±1° forthe IR beam. The SFG signal is collected around 60.5°(B) atthe reflection geometry, within a small range (about 0.3°) whichdepends on the corresponding IR wavelength tuning range (from2800 to 3000 cm- in the experiment). Each scan was with a 2cm- increment and was averaged over 100 laser pulses perpoint. The energy of visible beam is typically less than 300microjoules and that of IR beam less than 200 microjoules. Sothe intensity in our experimental conditions cannot damage orcause any heat effect and other photochemical reactions to theliquid samples. The spectrum intensity is normalized to theintensities of the corresponding visible and IR laser pulses. The PNA experiments were performed at the peak of the CHsymmetric stretching mode of the SFG-VS spectra at eachconcentration. The polarization of the IR beam is kept at ppolarization, and the polarization angle of the visible beam is-45°(positive sign is clockwise when facing the comingdirection of the beam).4s Particular attention has to be paid to accurate control of thepolarizations in PNA experiment. We have found that in theSFG optical arrangements of the original design for the EKSPLASFG spectrometer, the polarization of the visible beam is purelylinear only for s or p polarizations. This optical arrangement isfine for measurement only with the ssp, ppp, sps, and psspolarization combinations. It had not been an issue because the TABLE 1: Values of c and d for the CH3-Ss Mode ofVapor/Acetone-Water Mixture Interface in DifferentPolarization Configurations polarization d ssp -0.306 0.344 p ppp 1.491 0.176β sps -0.122B pss -0.119B general practice in the SFG-VS has not gone beyond these fourpolarization combinations until very recently,44,45and themajority of the works deals only with the ssp or ppp polarizationcombination. However, in this EKSPLA design, any polarizationother than s or p for the visible beam is somewhat elliptical.This certainly gives incorrect null angle values when the visiblepolarization angle is set at Q1=-45°. We have found outthat simple adjustment of a few optical components forpolarization control of the visible beam can correct theproblem.45 We have made the due adjustment for all ourexperiments since. Any laboratory who has been using thecomplete EKSPLA SFG spectrometer system is suggested totake notice if they plan to perform any measurement with visiblelight polarization other than s and p. Comparisons of the existingresults with such measurements have to be cautiously taken. All measurements were carried out at controlled roomtemperature (22.0 ±0.5℃). The liquid acetone is GC gradefrom Fluka (99.5%), used without further treatment. Doublydistilled water was prepared with Millipore Simplicity 185 (18.2M Q.cm). The liquid sample is filled in a round Teflon beaker(diameter ~5 cm) for SFG measurement. The whole experi-mental setup on the optical table was covered in a plastichousing to reduce the air flow and the evaporation. 3. Results and Discussion 3.1. SFG-VS Spectra and Orientation of the Vapor/Acetone-Water Mixture Interface. The SFG-VS spectra ofthe CH group between 2800 cm-1 and 3000 cm-1 wereobtained for vapor/neat acetone interface in ssp, ppp, sps, andpss polarization configurations,29,35,49 and vapor/acetone-waterinterface at 0.1 mole fraction previously.56 The d and c valuesfor this ss mode in the four polarizations in our experimentalcondition are listed in Table 1, calculated from the followingparameters: nj(@vis)= 1.0, ni(@IR)= 1.0, ni(@SF)=1.0,n2(@vis)=1.359,n2(@IR)=1.349, n2(WsF)=1.359, n'(@vis)=1.160, n'(@IR)=1.156, n'(ωsF)=1.160, and hyperpolarizabilitytensor ratio R=B2/p=1.881.29.48,49 Since the refractiveindex of water at room temperature is nwater = 1.333, therefore,the refractive indexes of acetone/water mixture for differentacetone concentrations are nearly the same, so in all thecalculations we will use the same refractive index values listedabove. It is easy to show from dR(0) values that the intensityon ssp spectra should be 20 times stronger than those of theppp, sps, and pss spectra. This well exemplifies the polarizationselection rules for the CH3-ss mode in SFG-VS spectra. Systematic SFG-VS study on vapor/acetone-water mixtureinterfaces has not been reported before, except for ssp spectraat 0.1 mole fraction.56 At different bulk concentrations, the SFG-VS spectra show a single recognizable peak around 2920 cm-on the ssp polarization, fully in accordance with the dR(0)values above. Therefore, in Figure 1 we presented only the sspSFG-VS spectra at four typical bulk mixture concentrations. InTable 2, however, we listed the single peak Lorentzian fittingparameters of the ssp spectra with eq 6 for all the bulk mixture 8056 J. Phys. Chem. B, Vol. 109, No. 16, 2005 Figure 1. SFG-VS ssp spectra in the C-H stretching region at differentbulk acetone concentrations. v: 0.01,O: 0.06,△: 0.19,and◇:1.00.The solid lines are fitted lines with Lorentzian and the short lines areconnection between neighboring points. concentrations we have measured. In fitting the spectra, wehave8,35,46 in which Xnreff and Xreff are the nonresonant and resonantcontributions to the SFG-VS susceptibility Xeff, respectively.Aq,eff, W and Iq are the oscillator strength, resonant frequencyand damping constant of the qth vibrational mode. B and C aretwo fitting constants. Therefore, the oscillator strength Ag,effshould be proportional to the intensity factor dg,efr for the qthvibrational mode, orientational functional r(0), and the interfacialdensity Ns.eff in SFG-VS. It is important to note that the dgeffand c values used to calculate the Ag,eff values are dependenton the Fresnel factors at the interface, and these Fresnel factorswill not be constant at different bulk concentrations if the twoliquids under mixing have very different bulk refractive indexes.However, for acetone and water, their bulk refractive indexesare close enough to each other, so it is valid that we use thesame dgeff and c values throughout the whole bulk concentrationrange. We measured the null angle s at the CH-ss peakposition at each different bulk mixture concentration using thePNA method, and calculated the corresponding orientationalparameter D = (cos0)/(cos’0) at each concentration with therelationship in eq 8.45,44,49 These results are also listed in Table2. From the data in Table 2 and existing literature in the field,the following observations could be made. (a) In Table 2, the spectra peak position red-shifted about 4cm from 0.01 bulk mole fraction (very dilute acetone aqueoussolution) to 1.00 bulk mole fraction (pure acetone), with theHWHM almost unchanged. Similar red shifts were reported forthe CH3-ss SFG-VS spectra of vapor/methanol-water mixtureinterfaces, as well as for the Raman and FTIR spectra of bulkmethanol-water mixture,by Allen et al. previously.57 This red-shift was attributed to the changing hydrogen bonding config-uration between the methanol and water molecules at the surfaceand in the bulk. (b) In Table 2, the SFG-VS spectral peak intensity for CH3-ssis strongest between mole fraction at 0.14 and 0.19, and itdropped about 60% at 1.00 mole fraction, so the calculatedoscillator strength dropped about 40%. Similar but differentpercentages of drops for the SFG-VS intensity of the CH3-sspeak in ssp spectra with increasing bulk concentration were alsoreported for other vapor/aqueous solution mixtures such asmethanol-water (about 30% of intensity at room tempera-ture),57,58 acetonitrile-water (about 50% of intensity at roomtemperature),ethanol-water (about 50% of intensity at roomtemperature),60 and most recently acetic acid-water (about 50%of CH3-ss and about 80% of the C=0 symmetric stretchingintensity at 4 ℃)61 mixtures. Allen et al. have carefully pointedout that the IR absorption of the methanol vapor close to theliquid sample cell at room temperature is less than 5%.Therefore,the drop of the SFG-VS intensity is real and cannotbe attributed to such experimental artifact. In our experiment,we also made sure that the vapor absorption of the IR energywas not causing problems for the SFG intensity drop. We foundout that to perform the SFG-VS experiment in an open beakeris ideal. However, in the literature, the interpretations for the SFG-VS intensity decrease phenomenon with increasing bulk con-centration were very different in different works. In the methanoland acetonitrile cases,57-59 the decrease of SFG intensity athigher bulk concentration was attributed to the decrease of theinterface ordering at higher bulk concentration, because thenumber of adsorbed methanol or acetonitrile molecules in theinterface region has to increase with bulk concentration.However, without direct measurement of molecular orientationat those interfaces, these interpretations still cannot be put on avery solid ground. While for the ethanol and acetic acidcases,60,61 SFG spectra intensity ratio between two differentpolarizations suggested that the interface ordering did not changemuch with bulk concentration. So the drop of the SFG-VSintensity was attributed to possible increase of the interface mole frac peak (cm~) HWHM (cm) Ag.eff(a.u.) (deg) D 0.01 2925.4十1.6 7.7±0.2 0.0070±0.0010 -8.4十1.6 1.09±0.06 0.03 2923.8±0.7 8.4土0.6 0.0120±0.0020 -9.7土1.2 1.04±0.04 0.06 2923.0±0.7 8.3±0.6 0.0146±0.0009 -10.0±1.0 1.03±0.03 0.14 2922.1±0.2 8.6±0.6 0.0170±0.0010 -11.1±1.0 0.99±0.03 0.19 2921.5±0.3 9.2±0.5 0.0170±0.0007 -12.2±1.0 0.96±0.03 0.36 2921.1±0.7 8.7±0.7 0.0140±0.0010 -12.9±1.0 0.93±0.03 0.50 2921.1±0.9 8.3±0.7 0.0119 ±0.0007 -14.3±2.4 0.89±0.06 0.69 2921.0±0.3 7.7±0.7 0.0102±0.0010 -16.7±1.1 0.83±0.04 0.86 2921.3±0.9 7.9±0.6 0.0098±0.0008 -16.5十1.0 0.83±0.03 1.00 2921.5±1.4 8.1±0.5 0.0095±0.0007 -16.5±1.5 0.83±0.05 TABLE 3: Calculated Orientational Angles for AcetoneMolecule at the Vapor/Acetone-Water Mixture Interfaces mole 0-CH3 0-CH32 0-C=0 error bar frac D (deg) (deg) (deg) (deg) 0.01 1.09±0.06 -23.0 94.2 -144.4 0.03 1.04±0.04 -21.7 95.5 -143.1 0.06 1.03±0.03 -21.4 95.8 -142.8 0.14 0.99±0.03 -20.3 96.9 -141.7 0.19 0.96土0.03 -19.1 98.1 一140.5 0.36 0.93±0.03 -18.4 98.8 139.8 0.50 0.89 ±0.06 -16.8 100.4 138.2 0.69 0.83±0.04 -14.1 103.1 -135.5 0.86 0.83±0.03 -14.1 102.8 -135.8 1.00 0.83±0.03 -14.1 102.8 -135.8 ethanol concentration for one case and to possible antiparalleldouble layer formation at low temperature for the acetic acidcase. These results and interpretations are on better ground withintensity ratio data for orientational analysis, especially for theSFG study on the vapor/acetic-acid mixture interface, but theconclusions are still qualitative before direct quantitativemeasurement of the molecular orientation and orientationalchange at the interfaces can be made. (c) In Table 2, the measured null angle of the CH-ss peakon the SFG-VS spectra and the calculated orientational param-eter D clearly show a monotonic increase of the interface order.It shows that as the acetone bulk concentration increases from0.01 to 1.00 mole fraction, the measured D value decreases from1.09±0.06 to 0.83±0.06. The relationship between theinterface orientational order and the D value has been exten-sively discussed in recent years.44,45,49,62,63 It is known that whenD is close to 1, the smaller the D values, the better the orientationorder and the narrower the orientational distribution.44,62,63However, for each acetone molecule there are two methylgroups. With a narrow orientational distribution, these twomethyl groups should have distinctive orientation angles. Tosolve this problem, a new method was recently developed inour group for determination of the orientational angles for bothCH groups in an interfacial acetone molecule.49 Providing theMeCMe plane of the acetone molecule is perpendicular to theinterface, the two angles can be determined uniquely throughthe following relationship:9 where 02=117.2°+01, because the angle between the twoCHs groups is 117.2°, and x= 0.5, because the number of thetwo CH groups are equal. Table 3 gives the values for thecalculated orientational angles with the assumption of the Oorientational distribution. As we have shown elsewhere,49 theorientational angular distribution of acetone molecules at theinterface with such small D values could not be very broad.We will further discuss the influence of the angular distributionon determination of the Gibbs adsorption energetics below. The failure to observe the C=O stretch around 1700 cm-in SFG-VS measurement on the vapor/pure acetone interfacewas used as an indicator that the C=0 group could lie near theinterface.29 However, our calculation with the known IR andRaman spectral intensities of the C=0 group in acetone showedthat with 0c=o=-135.8°±1.9°, its SFG-VS intensity shouldbe at least more than one order smaller than that of the CH3-ssmode. To our knowledge, observation of the C=0 group SFG-VS spectra in acetone has not been reported so far. With asignificant improvement of the detection sensitivity of our SFG-VS spectrometer, we have obtained the C=0 group SFG-VS spectra on the ssp polarization around 1720 cm-l for the vapor/acetone-water mixture interface with a bulk mole fraction of0.4. The intensity is more than 30 times weaker than that ofCH3-ss, which prevents us from accurate measurement withPNA method of the D value for the C=0 group before furtherimprovement of the detection sensitivity of the instrument.Nevertheless, this result clearly indicates that the C=0 groupof acetone does not seem to lie close to parallel to the interfaceas previously suggested, and this fact indeed suggests that theorientational distribution width for the C=0 group is not morethan a few degrees.49 Therefore, the calculated orientationalangles in Table 3 using a O-distribution function should beacceptable for analysis below. It is easy to see in Table 3 that the orientational angle of theC=0 group, which is parallel to the direction of the permanentdipole, gets more tilted from the interface normal as the bulkacetone concentration increases, i.e., the interface is morecrowded with adsorbed acetone molecules. If C=O becamemore parallel to the interface normal at higher surface density,there would be a bigger dipolar repulsion between the acetonemolecules at the interface. Therefore, such configuration maycertainly help reduce such energetically unfavorable interactionor be a direct result of such repulsive interaction. It is interestingto see the fact that even though the CH3 group is hydrophobicand prefers to stick out of the bulk phase, one of the CH3 groupsof acetone actually sticks into the bulk phase, which is certainlymore hydrophilic. This suggests that the reduction of the dipolarrepulsion must be big enough to compensate the energy increasefrom this CH3 configuration. We can further surmise that it isenergetically favorable to have the other CHs group of theinterface acetone molecule stay as far away from the bulk phaseas possible. This scenario predicts that the acetone molecule atthe interface should have its molecular plane perpendicular tothe interface,as predicted from the MD simulation for the purevapor/acetone interface previously.2 We think that this scenariois highly likely for the vapor/acetone-water mixture interfaceat high interface acetone densities. In addition to this dipole repulsion scenario for the higherbulk concentration, the antiparallel dimer formation could alsobe a possibility. MD simulations have shown that in the bulkacetone liquid, acetone molecules can form dimer structuresthrough nonliner configuration of hydrogen bonds between theoxygen of one acetone molecule and the hydrogen atom on oneof the CHs groups of another acetone molecule.64 This antipar-allel structure can easily explain the fact that at higherconcentrations the C=0 stretch vibrational spectra could notbe detected with SFG at the vapor/pure acetone interface.29 Thisantiparallel structure is illustrated in Figure 4, and shall befurther discussed in next section. At low interface density, the interactions between acetoneand water molecules determine the orientation of the interfacialacetone molecule. The vibrational spectra peak shift above-mentioned is clearly an indication of such change of interactions.As shown by the classical SFG paper by Shen et al.,30 thepermanent dipole moment of the interfacial water molecules atthe vapor/water interface points into the bulk phase and orientsclose to parallel to the interface plane. When an acetonemolecule is put at the vapor/water interface, the interfacial waterdipole would try to pull the acetone dipole away from theinterfacial normal, or to pull one of the acetone CH groups toform some kind of hydrogen bond, so that the acetone moleculeassumes an energetically more favorable configuration at theinterface. As a consequence, one of the CH of acetonemolecules could be pulled into the bulk phase, and the molecular plane of the acetone molecule would be energetically favorableto allow the other CH to stay as far away from the interface aspossible, and the molecular plane is to be perpendicular to theinterface. In this scenario, it is likely that the attractiveinteraction between water and acetone dipoles, as well as somekind of the hydrogen bond between the water and acetonemolecules, determines the orientation of the acetone molecule;while at higher interface density the scenario above suggeststhat the repulsion between the acetone dipoles or a antiparalleldimer formation through hydrogen bonding determines theorientation. Both scenarios clearly favor the tilted dipoleorientation of the acetone molecule and the acetone molecularplane being perpendicular to the interface. The above interpretation of the orientation of the acetonemolecule is supported with the direct experimental measurementresults. However, alternative interpretations might also bepossible. We believe that the important thing here is that nowit is possible to make such detailed direct measurements on themolecular orientation of the interfacial acetone molecule andwatch slight orientational change with changing concentrationand other conditions of the interface system. This further allowsthe possibility for understanding the subtle interplay and detailedbalance of the interactions with hydrogen bonding, dipole, andhydrophobic effects at the detailed molecular level of the liquidinterface.19 We would like to point out that such direct measurement ofthe molecular orientation of a vapor/liquid mixture interface atdifferent bulk concentrations has not been done before. It hasnot been possible without the application of the SFG-VS PNAmethod, which allows accurate measurement of the SFG-VSnull angle and allows the comparison of the slight orientationalchanges with small changes in the orientational parameter Dfor a molecular groups at the interface. Such an accuracy wascertainly unattainable with the intensity ratio method generallyused in the literature.60,61,65,66 It was also not possible to usethe intensity ratio method for molecular groups that only havemeasurable SFG intensity in the ssp polarization. Therefore,experimental determination of molecular orientation of someof the most important liquid interfaces, such as the vapor/acetone, vapor/methanol, and vapor/acetonitrile interfaces, werenot achieved.29,57,59,65,67,68 The advantages of the PNA methodswere fully discussed in our recent report,44,45,49 and here is aclear demonstration of its usefulness for providing new toolsand new insights for understanding the structure and energeticsof molecules at interfaces. 3.2. The Antiparallel Double Layer Structure and Ener-getics of the Vapor/Acetone-Water Mixture Interface. Withthe detailed knowledge of the orientation of the acetonemolecules, we shall establish below the existence of anantiparallel double layer adsorption structure at the vapor/acetone-water interface and demonstrate that the energetics forthe Gibbs adsorption layers can be determined. With the orientational angle obtained above, it is now possibleto calculate the interfacial effective molecular density Nsef. Fromthe definition of the orientational functional r(0) and with theconsideration of the fact that there are two distinctively orientedCHs groups, r(0) for the ssp polarization can be calculatedthrough eq 10. where cssp =-0.306 as listed in Table 1. The only assumptionhere is that the two methyl groups in an acetone molecule areidentical except for their orientational angles. The calculatedr(0) values for different bulk concentration are listed in Table TABLE 4: Calculated Interfacial Orientational Functional,Effective CH; Group Density, and Surface Coverage for theFirst and the Second Gibbs Adsorption Interfacial Layers atVapor/Acetone-Water Interfaces mole frac. D r(0) Ns.eff (a.u) 0.00 0.0000 0.00 0.00 0.01 1.09 1.09 0.0061 0.20 0.010 0.03 1.04 1.08 0.0110 0.44 0.058 0.06 1.03 1.08 0.0140 0.62 0.15 0.14 0.99 1.07 0.0160 0.80 0.36 0.19 0.96 1.06 0.0160 0.86 0.48 0.36 0.93 1.06 0.0130 0.93 0.69 0.50 0.89 1.04 0.0110 0.96 0.80 0.69 0.83 1.02 0.0100 0.98 0.90 0.86 0.83 1.02 0.0096 0.99 0.96 1.00 0.83 1.02 0.0093 1.00 1.00 4.r(0) changed only a few percent from 1.09 to 1.02 whenbulk mole fraction changed from 0.01 to 1.00. This is notsurprising for the ssp polarization. For Cssp =-0.306,r(0) isnot a very fast changing function itself. Additionally, the twoCH groups orient one up and one down from the interface,and their orientational angles are just in the range that thechanges caused by changing orientation cancel each other, thusmaking the r(0) insensitive to orientational changes in a fairlybroad range of 0. Furthermore, it is easy to show mathematicallythat in such a range of 0,even with some orientational angulardistribution, the orientationally averaged r(0) would not changemuch. This makes the measurement orientation insensitive inthis particular orientational range and with the particular ssppolarization configuration. Orientation insensitive measurement with SHG was discussedby Simpson and Rowlen previously.69 It is a very good conceptfor obtaining adsorption free energy and adsorption kineticsmeasurement with improved accuracy, but this idea has notfound many applications since. We found out that by using ourformulation with the orientational functional r(0), it is conceptu-ally easier to formulate and calculate the orientational insensitivemeasurement configurations. It is straightforward to choose aproper c value for an orientationally insensitive r(0) within acertain range of 0 for an interface with particular moleculargroup, i.e., a set of particular microscopic polarizability tensors,in SHG, as well as SFG-VS experiment.44 In short, the ssppolarization is a proper orientation insensitive experimentalconfiguration for acetone at its aqueous interface. So thestructure and energetics thus obtained are reliable. For a particular experimental polarization configuration, e.g.,ssp, the d value is a constant. So the effective interfacial densityof the CH group, i.e., Ns,eff, can be simply put as a proportionalquantity Ag/r(0). The calculated Ns,eff values are listed in Table4 and plotted against the acetone-water mixture bulk concen-tration in Figure 2. Because the orientational effect on the SFG-VS intensity hasbeen corrected, the drop of approximately 40% of the Ns,eff fromits maximum in Figure 2 can no longer be attributed to theassumption that the interface layer is more disordered at higherbulk concentration. Given that SFG-VS only probes the interfaceregion where the centrosymmetry is broken, Ns,eff is truly aninterface quantity and is proportional to the number of CH,groups that contribute to the SFG-VS intensity. With the increaseof the bulk acetone concentration, it is expected that the interfaceshould be saturated with adsorbed acetone molecules. Therefore,the actual number of acetone molecules cannot decrease withbulk acetone concentration. The only possibility now is that inthis interface region at higher bulk contribution some moleculesstart canceling the contribution to the SFG signal of the well- Figure 2. Ns,eff as a function of bulk acetone mole fraction. The solidline is the fit with eq 14. ordered top molecular layer. This can be achieved only throughforming an antiparallel second adsorption layer, which shallcancel the SFG field from the first layer and thus reduce theNs,eff measured as the actual number of interfacial acetonemolecules increases with increase of adsorption from the bulkliquid. Lin and Shen et al. suggested previously in their MDsimulation that for pure acetone the interfacial acetone moleculestend to have antiparallel orientation in the nearest neighborstatistics.29 They also pointed out that recent X-ray diffractionstudies on crystalline acetone at low-temperature had shownantiparallel layered structure,70 and MD simulation in bulkacetone had also shown antiparallel arrangement in the nearestneighbor statistics.71,72 Lin and Shen then concluded that thevapor/pure acetone interface could be highly ordered and crystal-like, i.e., with antiparallel layered interface structure.29 MDsimulations have also shown antiparallel dimer formation in pureacetone liquid.64 Since we have determined that the interface is well orderedthroughout the low and high concentration ranges, it is clearthat the forming of the antiparallel layer structure with increasingsecond layer adsorption should be the only possible explanationof the Ns,eff drop with increasing bulk acetone concentration.Therefore, the SFG-VS measurement reported here on the vapor/acetone-water mixture interface not only provides the firstdirect experimental evidence supporting the highly ordered andcrystal-like physical picture for the pure acetone interface butalso indicates that this antiparallel layer interface structure formsgradually with the increase of the adsorption from the bulkacetone solution. This antiparallel layered structure may not have a fullantiparallel second layer, for Ns,efr does not go to zero at higherconcentration. Otherwise, the SFG-VS signal should have goneto zero when the second layer had fully formed. Thus, wepropose a double-layer adsorption model (DAM) for theadsorption of acetone molecule to its vapor/aqueous solutioninterface. In this model, an adsorbed second layer graduallyforms with an antiparallel structure, and it contributes negativelyto the total SFG field. Therefore, we write TABLE 5: Fitting Results of Figure 2 with Eq 14" Nma(a.u.) K AG°ads,I K2 AG°ads,2 “ The unit for AG°ads,i and AG°ads,2 is kcal/mol. in which is the first layer coverage and o the second layercoverage,p(-1≤p1) is a proportional constant representingthe efficiency for the second layer cancellation (0 ≤p1) orenhancement (-1≤ p0), and Nax is the effectiveinterfacial density for a full first layer coverage. The Langmuir isotherm has provided the simplest treatmenton adsorption of weakly interacting species to a surface.4 Wedenote the adsorption equilibrium constants as Kiand K2,respectively. Because the second layer adsorption has to followthe first layer adsorption, simple derivation using the Langmuirisotherm as given in the physical chemistry textbooks4 shows Here one should notice that the expression of in eq 12 differsfrom the ordinary Langmuir isotherm, which uses 1 in thedenominator instead of 1 -x. This is because when using theLangmuir isotherm to describe adsorption from dilute solutionwhere x is usually much smaller than 1, 1 - x can be generallyreplaced with 1. However, for high bulk concentrations, suchapproximation is no longer valid. Equation 14 gives a good fit for Ns,eff vs acetone bulk molefraction x, as shown by the solid line in Figure 2. Through theKi and K2 values the adsorption free energy for the first andsecond layer could be obtained according to AG°ads,i=-RT lnK. The results are listed in Table 5. In addition to using theLangmuir isotherm, we also tested the Frumkin isotherm whichincludes a treatment on the increasing interactions between theadsorbed molecules as the interface coverage and o increases.4It is clear that when a single layer adsorption is considered, theFrumkin isotherm cannot predict any decrease of Ns,eff at higherbulk acetone concentration. So it is clear that a DAM has to beincluded for Frumkin adsorption isotherm. With DAM, Frumkinworks just as well as the simple Langmuir and produces veryclose fitting parameters for Neff ,p, and AG ads,l and G°ads,2,and a very small interaction energy term at full coverage. Thismeans that the Langmuir treatment is good enough to describethe problem. This is also in agreement with our hypothesis abovethat interfacial acetone molecules assume orientation to mini-mize the lateral repulsive interactions between the neighboringacetone molecules. So no Frumkin correction term is necessary,and simple Langmuir isotherm is good enough here. The coverage O and o are calculated and listed in Table 4.They are also plotted against the bulk mole fraction in Figure3. The valuep=0.69±0.07 falls into the range 0 ≤ p =1 aswe expected above. The free energy of adsorption for the firstacetone layer is AG ads,1=-1.9 ±0.2 kcal/mol. This value iswell above the thermalization energy kT = 0.59 kcal/mol atthe ambient temperature 295°K. However,AG°ads,2=-0.9±0.2 kcal/mol compares to the thermalization energy kT. Thissuggests that the second layer cannot be as well ordered as the 8060J. Phys. Chem. B, Vol. 109,No. 16, 2005 Figure 3. Interfacial coverage for the first and second layers. first layer, which is consistent with the fact that p is less thanunity. However, we also want to point out that the second layeris not to be very disordered, because the continuously decreasingD value with increasing acetone bulk mole fraction indicates agood ordered structure within the double layer structure includ-ing the second layer. Because AG°ads,1>AG°ads,2, shouldalways be larger than o until both reach full coverage as thebulk becomes pure acetone. The difference between AG°ads.1and AG°ads,2 is clearly shown in the and o values as in Figure3. When the slope p*0o/0x begins exceeding 0/ox, Neffstarts dropping. The bigger the AG ads,2 value, the earlier thedrop starts. Comparison ofAG ads,i and AG°ads,2 values with the adsorp-tion free energy obtained with other methods provides interestingclues for understanding energetics in the Gibbs adsorption layers.Irving Langmuir’s 1917 classical paper on the fundamentalproperties of liquids listed adsorption free energies for about40 molecules at their aqueous solution interface from Traube’sdata obtained at the temperature of 15 °C, among which thevalue for acetone is -2.17 kcal/mol. It is known that at highertemperature the adsorption free energy should be smaller,therefore, this value is in good agreement with the AG°ads,1=- 1.9±0.2 kcal/mol at 22°C. Furthermore, Langmuir pointedout in his paper that“A theory of surface tension is nowproposed in which the structure of the surface layer of atoms isregarded as the principal factor in determining the surfacetension (or rather surface energy) of liquids. This theory issupported in the most remarkable way by all available publisheddata on the surface tension of organic liquids." Since from ourDAM the second layer is more disordered than the first layer,it is easy to see that the first layer adsorption should be themajor contributor to the surface energy. Therefore, this quantita-tive agreement between the adsorption free energies cannot betreated as accidental. However, we do not want to overstate the quantitativeagreement between AG°ads,I and the Langmuir’s adsorption freeenergy value. From the surface tension data for the acetone-water mixture in the major handbooks,74,75 we calculated theadsorption free energy at 20℃ and found mixed results rangingfrom -1.8 kcal/mol, -2.0 kcal/mol, -2.9 kcal/mol to -3.0 kcal/mol. We also performed surface tension measurement onacetone-water mixture interfaces, and it gave an adsorptionfree energy of -2.8 ±0.1 kcal/mol. If we consider the conceptthat the interface free energies are additive,4,76 then both thefirst and second layers contribute to the surface tension.Therefore, we have AG ads,1+AG°ads,2 =-2.8 ±0.2 kcal/mol, and this value matches perfectly with the surface tensionvalue from our surface tension data. However, provided withso many different adsorption free energy values from data inthe literature, even though we intend to believe, we are still notcertain whether the value we measured with surface tension datais more accurate than the rest values from others. Notwithstand- Figure 4. Schematic illustration of the possible structures for the vapor/acetone-water mixture interface.(a) Higher bulk concentration withinterface dimer formation. (b) Lower bulk concentration before dimerformation. The dotted lines represents possible hydrogen bonds. ing these uncertainties, it is reasonable to conclude that the firstadsorption layer contributed most significantly to the surfacetension.Nevertheless, this two layer structure is very intriguing,and further investigation is certainly necessary to better addressthis problem. Furthermore, since the double layer interface structure isdriven by either dipole or by hydrogen bonding interactions,and both interactions require certain preferred molecular orienta-tions, an ordered third layer is not expected to form. The possibleinterface structures are schematically illustrated in Figure 4.First, the molecules in the third layer can interact only with theCH3 groups that point down from the second layer. Since CHdoes not have a strong dipole moment, it has an orientation notpreferred to form a hydrogen bond from molecules below; italso blocks interaction with the C=O group in the second layer,so the attractive interaction between the third layer and thesecond layer should be much weaker than that between the firsttwo layers. Second, since AG°ads.2 =-0.9±0.2 kcal/mol isalready not much above kT at room temperature, if a AG°ads,3could mean anything, it has to be much smaller, and theadsorption should be fully randomized by the thermalization.A direct educt from this fact is that the interface consists onlytwo layers, with the first layer well ordered, the second partiallyordered, and with the third layer fully thermalized as part ofthe bulk liquid. Therefore, the thickness of the interface is notmore than two molecular layers. Experiments and theoreticalsimulation have persistently given very thin interface thicknessfor vapor/liquid and liquid/liquid interfaces.10,19,77,78 For ex-ample, X-ray reflectivity measurements and MD simulation givea thickness or interface roughness of 3.2 and 3.45 A, respec-tively, for the air/water interface.10,19,77 The direct structuralinformation obtained with SFG-VS studies as demonstrated hereprovides new insight to the description of the interface thicknessproblem. Consequently, it would be very interesting to perform SFG-VS measurements at lower and higher temperatures. SinceAG°ads,I is well above kT, we expect the first layer ordering Figure 5. CH-ss peak position as a function of bulk acetone molefraction, first and second layer coverage. The dashed line is a linearline fit. The solid lines are connection between neighboring points. shall not be affect significantly with changing temperature in acertainly wide range. While AGads,2 is much closer to kT,therefore, the second layer structure should be affected signifi-cantly by changing temperature. We thus expect to see that thedegree of drop of Ns,eff should become more pronounced at lowertemperature and less pronounced at higher temperature. Sincethis double layer structure is“crystal-like"as called by Lin andShen et al., we also expect that dipolar liquids with highermelting point than acetone might show larger drop of Ns,efr fortheir aqueous solution interface than that for acetone at the sametemperature. For tert-butyl alcohol, which has a much highermelting point than acetone, we did observe an about 80% dropof the SFG-VS signal with increasing concentration at roomtemperature. However, not all the dipolar liquids can form theantiparallel double layer interface structure. It has been knownthat there is no significant SFG-VS signal drop for the air/neatwater interface when temperature is increased from 10 to 80°C.30 This might be attributable to the fact that the dipolemoment of the interfacial water molecule is nearly parallel tothe interface;19,30 therefore, an antiparallel double layer structurefor the air/water interface is geometrically against the formingof any tetrahedral hydrogen network structure. 3.2.1. Vibrational Spectra Peak Red-Shift and Segregationat the Interface. Structural information in the adsorbed layerscan also be inferred from the SFG-VS spectral peak shift asshown in Figure 5, where the spectral shift is plotted againstthe bulk acetone mole fraction, first layer coverage O, and thesecond layer coverage o, respectively. There is a clear linearrelationship between the spectral red-shift with O, but no suchrelationship between the shift and the bulk mole fraction or o.Therefore, the spectral shift is directly related to the formationof the first layer. We surmise that this fact suggests at leastfollowing two possibilities: (a) the continuously changing lateralinteractions between acetone molecules in the first interface layerare responsible for this shift; (b) the interface consists of morethan one spectroscopically different species, i.e., the interfaceis with segregated islands of clusters or aggregations coexistingwith “free”acetone molecules, and their relative concentrationis linearly dependent on the surface coverage . Recently, Allen et al. reported a similar red-shift for the CH3-ss mode with an SFG-VS study on vapor/methanol-waterinterface, as well as with Raman spectral measurement for bulkmethanol aqueous solution.7 They also found a good linearcorrelation between this red-shift with the interface coverageof methanol molecules obtained from surface tension data. Theyattributed such red-shift to the changing hydrogen-bonding configurations with increasing methanol concentration. How-ever, with the knowledge of the antiparallel double layerinterface structure, the interpretation may be different. The vapor/methanol-water mixture interface also has anantiparallel double layer structure. Using the PNA technique inSFG-VS, we also studied the vapor/methanol-water mixtureinterface recently.45,79,80 With direct measurement of CH;orientation, we concluded that there is also a well-ordered firstlayer and a double-layer adsorption structure at the interface.There is also a linear relationship between the SFG-VS peakred-shift and the first layer coverage . Therefore, the red-shift is not due to the formation of the second layer of methanolor acetone molecules, which should substitute the watermolecules and change the hydrogen bonding between themolecules in the second layer and the methanol or acetonemolecules in the first layer. This suggests that there might bedifferent mechanisms for the red-shift in the interface SFGspectra from that in the bulk Raman spectrum. It is hard forone to define or understand a continuously changing lateralinteraction between the methanol molecules in the bulk solutionas in the interface layer, because methanol molecules are notaligned or ordered as are those at the interface. So the Ramanshift in the bulk solution may not be explained by the lateralinteractions that is absent in the bulk solution. It is known that simple alcohols such as methanol and ethanolwere reported to show cluster or segregation structures in theiraqueous mixtures.81 A MD simulation by Klein et al. on thevapor/liquid interface of a 0.1 M ethanol-water solutionobserved segregation of ethanol at the interface.82 These allsuggest that the interface may be with segregated clusters orislands, and they may be responsible for the SFG red-shift atthe interface region. Similarly, with the same red-shift trend,the acetone-water mixture interface may also have segregatedclusters or island structure. More experimental and theoreticalstudies are certainly needed to further address this issue. The double layered interface structure was suggested bySaykally et al. for vapor/pure methanol interface from EXAFSabsorption spectroscopy study on liquid methanol jet surface.Our SFG-VS study on the vapor/methanol-water interface alsosupports this picture.79,80 In addition to methanol, we havecarefully studied ethanol, acetonitrile, and tert-butyl alcoholaqueous mixture interfaces in our laboratory. For these systems,the SFG-VS intensities all drop at higher bulk concentration.This phenomenon was reported for ethanol and acetonitrilepreviously, but the interpretations varied.57-60 With the help ofthe PNA method to determine the orientational changes in theGibbs adsorption layer, we can also determine the existence ofthe double layer structure at these interfaces, and their adsorptionfree energies were obtained.7 We will report these results soon.Comparison of these results shall be very interesting andimportant for detailed understanding of the interactions andmechanisms determining the structure, conformation, andenergetics of these liquid mixture interfaces. It seems to us thateven though not all liquid mixture interfaces would form suchdouble layered structures, it is quite a general phenomenon forinterfaces of polar liquids at their interfaces and aqueous solutioninterfaces. The DAM model and Langmuir isotherm treatmentof the problem presented in this report should be a useful toolto unravel the mysteries about the Gibbs interface layers. It is interesting to note that a phenomenon called surfacefreezing was reported for liquid long-chain normal alkanes,as well as long chain alcohols.84,85 This phenomenon showsabout a 3 °K increase of the melting point for the surface layerthan that of the bulk. Even though the causes were in debate,86 it is sure that it is caused by chain interactions instead of dipolaror hydrogen bonding interactions. The ordered double layerstructure we observed for polar liquids and liquid mixtures couldalso be considered a new kind of surface freezing phenomenon,driven by specific dipolar or hydrogen bonding interactions atthe interface. Observation of such a surface freezing effect forthe pure acetone interface is surprising, because its bulk meltingpoint is at 179 °K,i.e., -94°C. We have discussed elsewherethat this “freezing”of the vapor/acetone interface has to bedynamic with a lifetime that may be as short as one tenth of amicrosecond.49 However, as temperature drops, this surface"freezing”might persist for much longer time, and it mayimplicate new mechanisms for phenomena such as interfaceinduced condensation and phase transition. Earlier we haveexcluded the possibility for a surface induced third layerformation at room temperature for acetone. But weaker interac-tions, such as van der Waals interactions, between the betterordered second layer and the layers beneath may cause somenew phenomena at lower temperature at least when the systemtemperature is lowered closer to its melting point. The depth ofthe surface zone of a liquid could be much more complicatedas has been speculated for many decades.87,88 Even though allthese now are just hypotheses and intellectual guesses, we expectthat future investigations may be able to provide new evidenceand answers. 4. Conclusions We have studied the SFG-VS spectra of the stretching modeof the CH group of acetone molecules at the vapor/acetone-water mixture interface. With the polarization null angle (PNA)method, we are able to accurately measure the orientation andorientational change of acetone molecules at the vapor/liquidinterface. At the vapor/aqueous solution interface, the acetonemolecule has its C=0 group point into the bulk phase, withone CHs group pointing up and another CH group pointinginto the bulk phase. This orientational configuration changesslightly with acetone bulk concentration. From the knowledgeof molecular orientation, we then identified the orientationallyindependent effective surface density Ns,err for the interface CHgroup. The drop of Ns,ef at higher acetone bulk concentrationhelped us to identify the antiparallel double layer interfacestructure of the acetone molecules adsorbed to the interface.This antiparallel double layer structure is induced by dipolarinteractions or specific hydrogen bonding interactions betweentwo acetone molecules. The adsorption free energy of the twolayers are also obtained through a double layer model andLangmuir isotherm. The adsorption free energies thus obtainedare -1.9±0.2 kcal/mol and -0.9±0.2 kcal/mol for the firstand second layers, respectively. We then conclude that the vapor/acetone-water interface is only two layers thick, with the firstlayer well ordered and the second layer less well ordered. Theseresults provided direct microscopic structural evidence forunderstanding the Gibbs adsorption layers and the fundamentalproperties of the liquid interfaces. These detailed studies on vapor/acetone-water interface withSFG-VS have provided us unexpected information on thestructure and energetics on the Gibbs adsorption layers at thisinterface. It is a good demonstration of the capability of therecently developed quantitative analysis methods in SFG-VS,especially the PNA method. In our future reports, we shallpresent detailed studies on the interface of aqueous solution ofmethanol, ethanol, acetonitrile and DMSO and many otherliquids with these newly developed techniques in SFG-VS.These efforts shall generate deep understanding and shall greatly enhance our knowledge on structure, conformation, energeticsand dynamics in the Gibbs adsorption layers at the liquidinterfaces in general. The technique demonstrated in this reportcan also be applied to study other molecular interfaces inchemistry, biology, and material sciences. Acknowledgment. H.F.W. thanks the Chinese Academyof Sciences (the Hundred Talent Program starting fund), theNatural Science Foundation of China (NSFC No.20274055,No.20425309), and the Chinese Ministry of Science andTechnology (MOST No. G1999075305) for support. H.F.W.thanks Na Ji at Ron Shen’s group for suggestion on testing ofthe Frumkin isotherm. H.F.W. thanks Professor Jianbin Huang’slaboratory at Peking University for assistance on measuringsurface tensions of acetone-water solution interfaces. References and Notes (1) Gibbs, J. W.“On the Equilibrium of Heterogeneous Substances”,Connecticut Academy Transactions,1875-1876,3,108-248;1877-1878,3.343-524. (2) Gibbs, J. W. The Scientific Papers ofJ. Willard Gibbs: Thermo-dynamics,Ox Bow Press: Woodbridge, CT, 1993. (3)Langmuir, I. J. Am. Chem. Soc. 1917, 39,1848-1906. (4) Adamson, A. W.; Gast, A. P. Physical Chemistry of Surfaces, 6thed.; Wiley-Interscience: New York, 1997. (5) Evans, D. F.; Wennerstrom, H. The Colloidal Domain: WherePhysics, Chemistry, Biology, and Technology Meet, 2nd ed.; Wiley-VCH:New York, 1999. (6) Myers, D. Surfaces, Interfaces, and Colloids: Principles andApplications; VCH: New York, 1999; Chapter 8.1. (7) Eisenthal, K. B. Acc. Chem. Res. 1993, 26, 636-643, and referencestherein. (8) Miranda, P.; Shen,Y. R. J. Phys. Chem. B 1999, 103, 3292 andreferences therein. (9) Garrett, B. C. Science 2004, 303, 1146. (10) Braslau, A.; Deutsch, M.; Pershan, P. S.; Weiss, A. H.; Als-Nielsen,J.; Bohr, J. Phys. Rev. Lett. 1985,54,114-117. (11) Kaganer, V. M.; Mohwald, H.; Dutta, P. Rev. Mod. Phys. 1999,71, 779-819. (12) Wilson, K. R.; Schaller, R. D.; Co, D. T.; Saykally, R. J. J.Chem.Phys. 2002,117,7738-7744. (13) Thomas, R. K.; Penfold, J. Curr. Opin. Colloid Interface Sci. 1996,I,1. (14) Penfold, J. Rep. Prog. Phys. 2001,64,777-814. (15) Eisenthal, K. B. Chem. Rev. 1996,96,1343-1360 and referencestherein. (16) Croxton, C. A. Statistical Mechanics of the Liquid Surfaces;Wiley: New York, 1980. (17) Safran, S. A. Statistical Thermodynamics of Surfaces, Interfaces,and Membranes; Addison-Wesley: Reading MA, 1994. (18) Smit, B. In Computer Simulation in Chemical Physics; Allen, M.P., Tildesley, D. J., Eds.; Kluwer Academic Publishers: Dordrecht, 1993;pp 173-210. (19) Townsend, R. M.; Rice, S. A. J. Chem. Phys. 1991, 94,2207-2218. (20) Klein, M. L. J. Chem. Soc., Faraday Trans. 1992, 88, 1701. (21) Benjamin, I. Chem. Rev. 1996, 96, 1449-1475. (22) Benjamin, I. Annu. Rev. Phys. Chem. 1997,48,407-451. ( (23) Kuo, I . F. W.; Mundy, C. J. Science 2004, 303 , 658 - 660. ) (24) Duque, D.; Vega, L. F. J. Chem. Phys. 2004, 121,8611-8617. (25) Richmond, G. L. Annu. Rev. Phys. Chem. 2001, 52,357-389 andreferences therein. (26) Benjamin, I. Phys. Rev. Lett. 1994, 73, 2083-2086. (27) Scatena,L. F.; Brown, M. G.; Richmond, G. L. Science 2001, 292,908-912. (28) Rossky, P. J. Nature 2002,419,889-890. (29) Yeh, Y. L.; Zhang, C.; Held, H.;Mebel, A. M.; Wei, X.; Lin, S. X.; Shen, Y. R. J. Chem. Phys. 2001, 114, 1837-1843. (30) Du, Q.;Superfine, R.; Freysz, E.; Shen, Y. R. Phys. Rev. Lett. 1993,70(15),2313-2316. (31) Adamson, A. W.; Gast, A. P. Physical Chemistry of Surfaces, 6thed.; Wiley-Interscience: New York, 1997; Chapter III-2. ( (32) Shen, Y. R. Annu. Rev. Phys. Chem. 1 989,40,3 2 7-350. ) ( (33) Shen, Y. R. Appl. Phys. B 1999, 68,295-3 0 0. ) ( (34) B ain, C. D.J. Chem. S oc. , Faraday T rans. 1995, 91, 1281-12 9 6. ) ( (35) Zhuang, X.; Miranda, P . B.; Kim, D . ; S h en, Y. R . Phys. Rev. B 1999,59,12632-12640. ) (36) Heinz, T. F.; Tom, H. W. K.; Shen, Y. R. Phys. Reu. A 1983,28, 1883. ( (37) Zhang, T . G.; Zhang, C. H.; W ong,G. K. J. Opt. Soc. Am. B 19 9 0, 7(6) , 902-907. ) ( (38) ZhangD. ; Gutow, J.; E i senthal, K . B . J. Phys. Chem. 1 994,9 8 , 13729-13734. ) ( (39) H irose, C . ; Akamatsu, N.; Domen, K .J. C hem. Phys. 1 992,96(2), 997- 1 004. ) ( (40) Hirose, C.; Yamamoto, H.; Akamatsu, N.; Domen, K . J . Phys.Chem. 1993,97, 1 0064-10069. ) ( (41 ) Watanabe,N . ; Yamamoto, H.; W a da, A.; D o men, K. ; Hirose, C. Spectrochim. A cta A 1 994,5 0 (8,9), 1 529-15 37 . ) ( (42) L ambert, A . G .; N eivandt, D . J .; Briggs, A. M.; Usadi, E. W.; Davies, P. B. J . Phys . Chem. B 2002, 106, 5461 - 5469. ) ( (43) M cGall, S. J .; Davies, P. B.; Neivandt, N. J. J . Phys. Chem. B 2004,108,16030 - 16039. ) ( (44) R ao,Y.;Tao, Y. S.; Wang, H. F. J. Chem. Phys. 2003,1 1 9,5226- 5236. ) ( (45) ( a) L u, R .; G an, W .; Wang, H. F . Ch i n. Sc i . B u ll. 2003,48 ( 20),2183-2187. (b) Lu, R.; G an, W.; Wang, H. F. Chin. Sci.Bull.2004,49(9),899. ) (46) Lu,R.; Gan, W.; Wu, B. H.; Chen, H.; Wang, H. F. J. Phys. Chem.B2004,108,7297-7306. ( (47) W ang, H. F . Chin. J . Chem. P hys. ( English) 2004, 1 7, 362-368. ) ( (48) L u, R.; G an, W.; W u , B. H.; Chen, H. ; Wa n g, H. F., submitted to J.Phys. Chem. B. ) (49) Chen, H.; Gan, W.; Wu, B. H.; Zhang, Z.; Wang, H. F., submittedto Chem. Phys. Lett. ( (50) S nyder, R . G.; Aljibury, A. L.; Strauss, H. L.; Casal, H. L.; Murphy,W. F . J. Chem. Phys. 1984, 8I(12),5352-5360. ) ( (51) Snyder, R. G. ; Sc h erer, J. R. J . Chem. Phys. 1979, 71, 3221-3228. ) (52) Snyder, R. G.; Strauss, H. L.; Elliger, C. A. J. Phys. Chem. 1982,86,5145-5150. (53) MacPhail, R. A.; Strauss, H. L.; Snyder, R. G.; Elliger, C. A. J.Phys. Chem. 1984, 88,334-341. ( (54) S nyder, R . G.; Hsu, S. L.; Krimm, S. Spectrochim. Acta A 1978,34.395-406. ) ( (55) Y e, P. X .; Shen, Y. R. Phys. Rev . B1983, 2 8,4288-4 2 94. ) ( (56) A llen, H. C.; Raymond,E. A.; Richmond, G. L. C urr. Opin. ColloidInterface Sci . 2000 , 5,74 -8 0. ) ( (57) Ma, G.; Allen, H . C. J . Phys. Che m . B. 2003,107,6343-6349.(58) Huang, J. Y. ; Wu, M. H. Phys. Rev. E 1994,50,3737-3746. ) ( (59) K im, J . ; C hou, K . C . ; Somorjai, G. A. J. P h ys. Chem. B 200 3 , 107, 1592- 1 596. ) (60) Sung,J.; Park, K.;Kim,D. J. Korean Phys. Soc. 2004, 44,1394-1398. (61) (a) Tyrode, E.; Johnson, C. M.; Baldelli, S.; Leygraf, C.; Rutland,M. W. J. Phys. Chem. B 2004,109,321-328. (b) Johnson, C. M.; Tyrode,E.; Baldelli, S.; Leygraf, C.; Rutland, M. W. J.Phys. Chem. B 2004, 109,329-341. ( ( 62) S impson,G. J . ; Rowlen, K. L . J. Am. C hem. Soc. 1 9 99,121,2635. (63) Simpson, G . J .; Rowlen, K. L. Acc. Chem. Res. 2000, 33, 781 - 789. ) ( (64) H ermida-Ramon, J. M.; R ios, M . A. J. P h ys. C h em. A 19 9 8,102 , 2594-2602. ) ( (65) S tanners, C. D .; D u, Q.; C hin, R . P.; Cremer, P.; Somorjai, G. A.; Shen, Y. R . C hem. Phys. Lett. 1 995, 2 32, 407-413. ) ( (66) W ang, J . ; Paszti, Z.; Even, M . A.; C hen, Z . J. A m. C h em. So c . 2002,124,7016-7023. ) ( (67) S uperfine, R .; H uang, J . Y . ; S h en, Y . R. Phys. Re v . Lett. 19 9 1,66(8),1066-1069. ) (68) Wolfrum, K.;Graener,H.; Laubereau, A. Chem. Phys. Lett. 1993,213,41-46. (69) (a) Simpson, G. J.; Rowlen, K. L. Anal. Chem. 2000,72,3399-3406. (b) Simpson, G. J.; Rowlen, K. L. Anal. Chem. 2000, 72, 3407-3411. ( (70) ( a) A llan, D . R.; Clark, S. J.; Ibberson,R. M.; P arsons, S.; Pulham,C. R .; Sawyer,L. C hem. Commun. 1999(8),751 . (b)All e n, F. H. ; B aalham, C . A.; L ommerse, J. P. M.; Ra i thby, P. R. Acta C rystallogr., Sect. B 1 998, 54.320. ) ( (71) J edlovszky, P.; P alinkas, G . M ol. Phys. 1 9 95, 8 4 ,217 . ) ( (72) Hermida- R amon, J . M.; R ios, M. A. J. Phys. Chem. A 1998, 1 02,2594. ) ( (73) W ang, H. F. ; Yan, E. C. Y.; Liu , Y.; Eis e nthal, K. B . J. Phy s . C h em. B 1998,102,4446-4450. ) ( (74) Landolt-Bornstein IV-16: Surface T ension of Pure L iquids and Binary L iquid M ixtures; L echner, M . D., E d.;S p ringer: B e rlin, 1 9 97. ) ( (75) T he Physio-chemical Constants of Binary Systems in C o ncentratedSolutions, Timmermans, J., Ed.; Wiley-Interscience,New York, 196 0 ; Vol. 4. ) ( (76) S haw, D . J. I ntroduction t o Colloid & S urface Chemistry, 4th e d.; Butterworth H e inemann: Oxford, 19 9 2; Cha p ter 4. ) ( (77) B raslau, A.; Pershan, P. S .; Swislow, G.; Ocko, B . M . ; Als-Nielsen, J. Phys. Rev . A 1988 , 38,2457- 2 470. ) ( (78) N icolas, J . P.; de Souza, N . R. J. Chem. Phys.2004, 1 2 0,2464-2469. ) (79) Chen, H.; Gan, W.; Lu, R.; Guo, Y.; Wang, H. F. J. Phys. Chem.B 2005,109,8064-8075. (80) Chen, H. Structure and Adsorption of Acetone and Methanol atVapor/Liquid Interfaces by Sum Frequency Generation Vibrational Spec-troscopy; Ph.D. Dissertation, Institute of Chemistry, the Chinese Academyof Sciences, 2004, No. 200118003202812, Defence date: June 24, 2004. (81) Dixit, S.; Crain, J.; Poon, W. C. K.; Finney, J. L.; Soper, A. K.Nature 2002, 416,829-832. (82) Tarek, M.; Tobias, D. J.; Klein, M. L. J. Chem. Soc., Faraday Trans.1996,92,559. (83) Wu, X. Z.; Ocko, B. M.; Sirota, E. B.; Sinha, S. K.; Deutsch, M.;Cao, B. H.; Kim, M. W. Science 1993, 261,1018-1021. (84) Deutsch, M.; Wu, Z. X.; Sirota, E. B.; Sinha, S. K.; Ocko, B. M.;Magnussen, O. M. Europhys. Lett. 1995,30,283. (85) Gang,O.; Wu, Z. X.;Ocko, B. M.; Sirota, E. B.; Deutsch, M. Phys.Rev. E 1998, 58, 6086. (86)(a) Sirota, E. B.; Wu, X. Z.; Ocko, B. M.; Deutsch, M. Phys. Rev.Lett. 1997, 79, 531. (b) Tkachenko, A.; Rabin, Y. Phys. Rev. Lett.1997,79,532. ( (87) H enniker, J. C. Rev. Mod. Phys. 1 949, 21, 3 22- 3 41. ) ( (88) Hardy, W. B . Proc. R. Soc. London 1912, 486, 610-635. )
关闭-
1/11
-
2/11
还剩9页未读,是否继续阅读?
继续免费阅读全文产品配置单
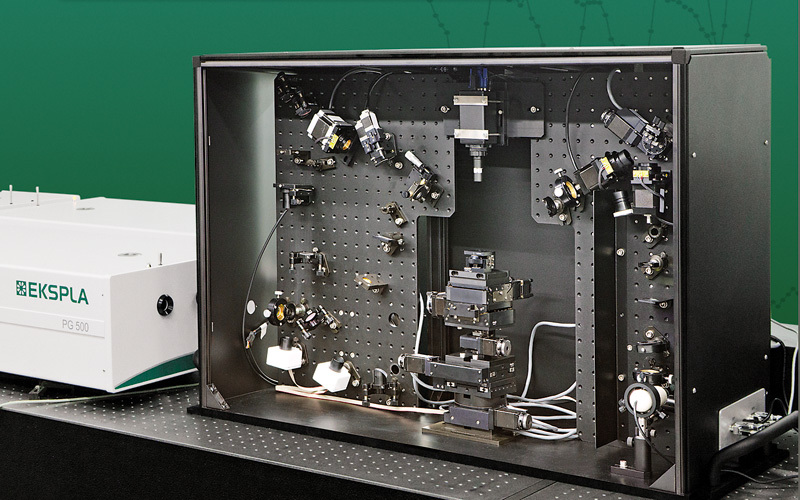
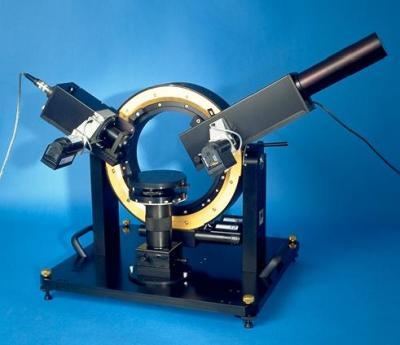
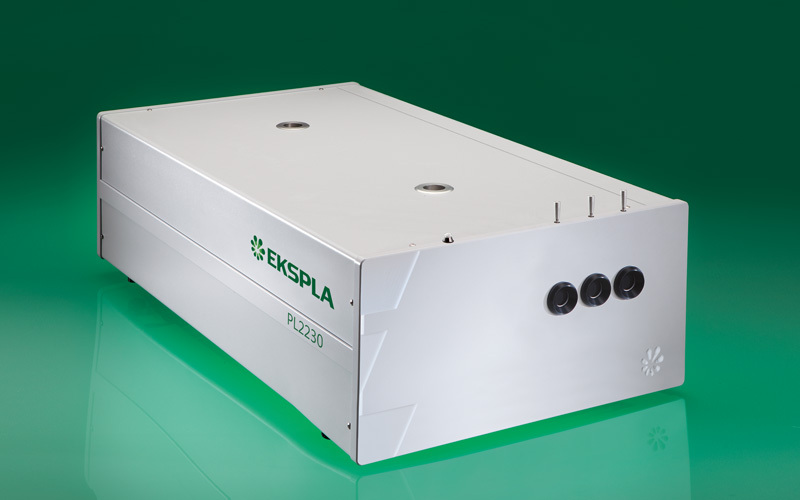
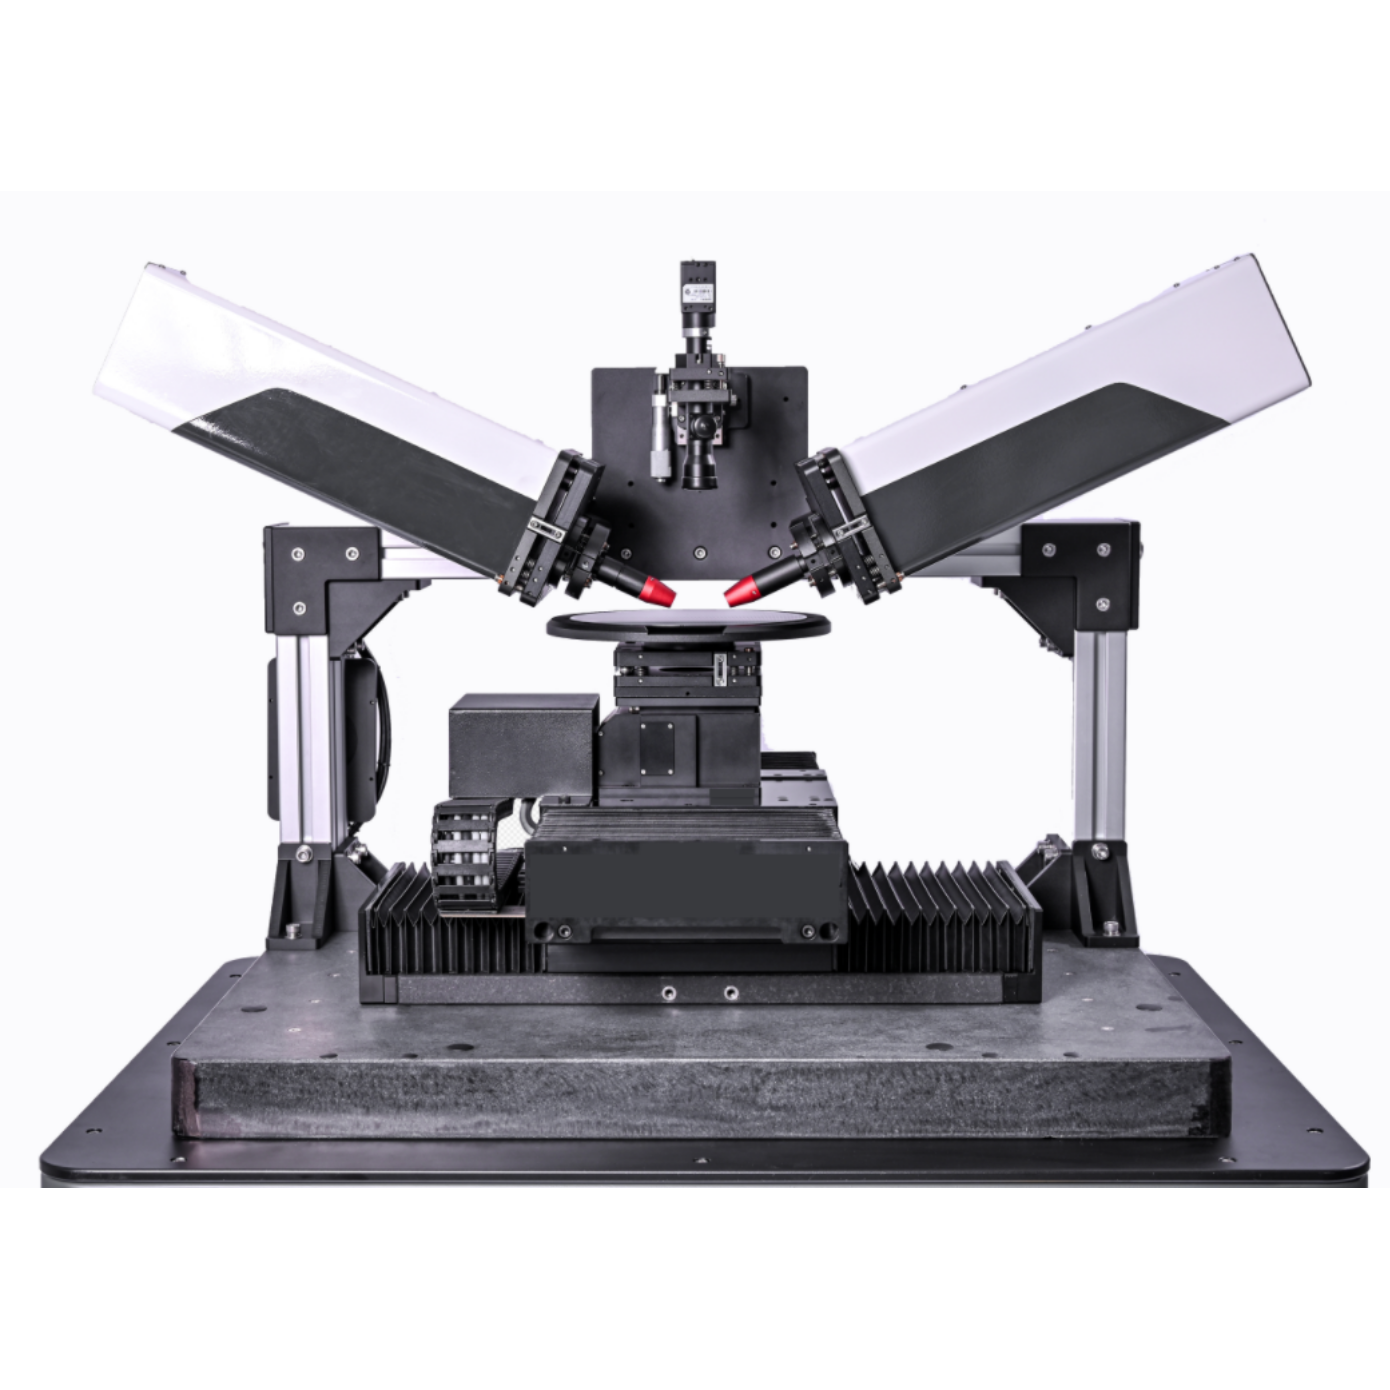
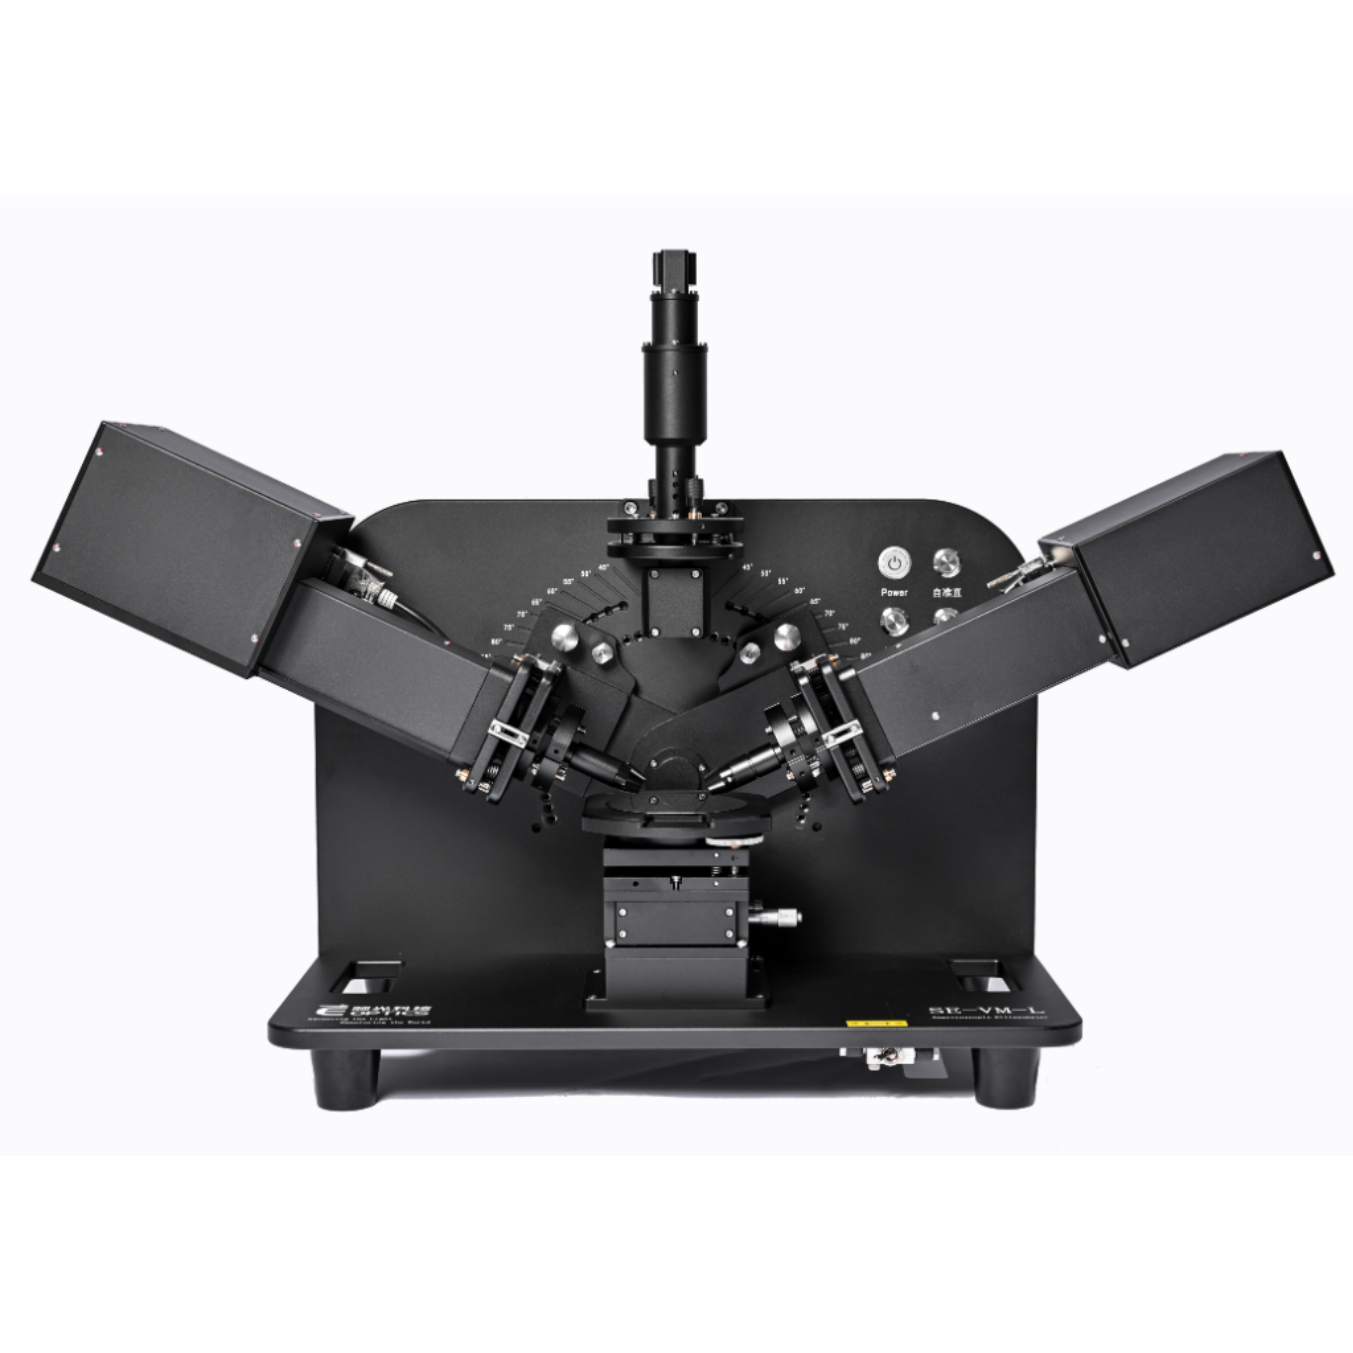
北京欧兰科技发展有限公司为您提供《丙酮,水,液体混合,吉布斯表面,吸附层,结构和能级中和频光谱,分子能级,表面特性,分子光谱检测方案(其它光谱仪)》,该方案主要用于其他中和频光谱,分子能级,表面特性,分子光谱检测,参考标准《暂无》,《丙酮,水,液体混合,吉布斯表面,吸附层,结构和能级中和频光谱,分子能级,表面特性,分子光谱检测方案(其它光谱仪)》用到的仪器有Ekspla SFG 表面和频光谱分析系统、组合式多功能椭偏仪、Ekspla PL2230型高能量皮秒激光器。
我要纠错
推荐专场


相关方案
 咨询
咨询