

方案详情文
智能文字提取功能测试中
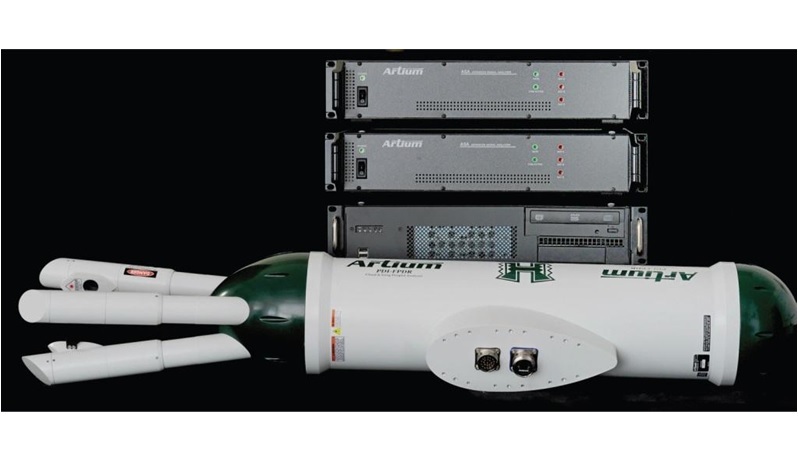
ResearchGate Available online at www.sciencedirect.comProcediaEngineeringScienceDirectCrossMarkProcedia Engineering 83 (2014) 170-180www.elsevier.com/locate/procedia View publication stats See discussions,stats, and author profiles for this publication at: https://www.researchgate.net/publication/268080280 Optimization of SO2 scrubber using CFDmodeling Article in Procedia Engineering·December 2014 DOI: 10.1016/j.proeng.2014.09.035 CITATIONSREADS2164 3 authors, including: Wojciech Kalata Spraying Systems Co. 18 PUBLICATIONS 186 CITATIONS SEE PROFILE ( All content following this page was uploaded by Wojciech K alata on 30 January 2015. ) The user has requested enhancement of the downloaded file. All in-text references underlined in blue are added to the original documentand are linked to publications on ResearchGate, letting you access and read them immediately. “SYMPHOS 2013”, 2nd International Symposium on Innovation and Technology in the Phosphate IndustryOptimization of SO2 Scrubber using CFD Modeling Kathleen Brown*, Wojciech Kalata, and Rudolf Schick Spraying Systems Company, P.O. Box 7900,Wheaton, IL 60187 USA Abstract The reduction of environmental contaminants that contribute to smog and soot is a worldwide goal that has seen an increased focus in recentyears. In the United States, for example, it is estimated that by 2014 new rules will lead to a 71% reduction of sulfur dioxide emissions and 52%of nitrogen oxide emissions as compared to 2005 level. Thus, medium-sized plants (100-500MW) that currently do not have flue gasdesulfurization (FGD) units or selective catalytic reduction systems (SCRs) will be required to adapt. Similar emission reduction efforts areexpected to be adopted globally, albeit at different levels. Wet-scrubber FGD is characterized as one of the most effective SO2 removal techniqueswith low operating costs. However, capital cost for implementation is considered high. Hence an effective optimization procedure is required toreduce these capital costs of conversion. Power plants commonly use a lime slurry spray reaction to reduce SO2 emissions. Control of the droplets throughout the tower geometry isessential to ensuring maximum reduction while minimizing scale. The liquid slurry is known to have density, surface tension and viscosity valuesthat deviate from standard water spray characteristics, which complicates process optimization. In order to improve the scrubber, nozzlecharacteristics and placement must be optimized to reduce the cost of the system implementation and mitigate risks of inadequate pollutionreduction. A series of large flow rate, hydraulic, hollow cone sprays were investigated for this study. A Computational Fluid Dynamics (CFD) model was used to examine potential scrubber designs for optimization of the system. Nozzle parameterswere modeled to allow particle tracking through the system. An ANSYS Fluent Lagrangian particle tracking method was used with heat andmass transfer. The alkaline sorbent material and SO2 reaction is modeled to determine uniformity and efficacy of the system. Volumetricchemistry mechanisms were used to simulate the reaction. These results demonstrate the expected liquid-gas interaction relative to the systemefficiency. Drop size, liquid rheology, and spray array layout were examined to achieve SO2 removal above 90%. Wall impingement and flowpattern results were evaluated due to their impact in minimizing equipment plugging and corrosion required as for long-term scrubber utilization. C 2014 Published by Elsevier Ltd. This is an open access article under the CC BY-NC-ND license (http://creativecommons.org/licenses/by-nc-nd/3.0/). Peer-review under responsibility of the Scientific Committee of SYMPHOS 2013 Keywords: Flue Gas Desulfurization (FGD), Pollution control, Sprays; 1. Introduction The reduction of environmental contaminants that contribute to smog and soot is a worldwide goal. As restrictions onemissions increase around the world, there is a global need for upgrades or additions to pollution control systems. Based oncurrent regulation projections, medium-sized plants (100-500MW) that currently do not have flue gas desulfurization (FGD) unitsor selective catalytic reduction systems (SCRs) will be required to adapt in a short timeframe. Wet-scrubber FGD is characterizedas one of the most effective SO2 removal techniques with low operating costs. However capital cost for implementationis considered high. Hence an effective optimization procedure is required to reduce these capital costs of conversion. Process improvement and optimization is a constantly ongoing effort. Power plants commonly use a lime slurry spray reaction ( * Corresponding author. Tel.: +1 630-517-1242; fax: +1 630-260-7593. ) ( E-mail address: kathleen.brown@spray.com ) ( 1877-7058 C 2 0 14 P u blished by Elsevier Ltd . T h is i s a n o pen access article under the CC B Y-NC-ND license ) ( ( htt p ://cre a tiv e common s .org/lic e n s es/by- nc - nd/3 .0/ ). ) ( Peer-review under responsibility of the Scientific Committee of SYMPHOS 2013 ) ( doi:10.1016/j.proeng.2014.09.035 ) to reduce SO2 emissions. Droplet size introduced into the tower is essential to ensuring maximum reduction while minimizingscale. The liquid slurry is known to have density, surface tension and viscosity values that deviate from standard water spraycharacteristics, which complicates process optimization. The improvements made in nozzle design and liquid atomization, inrecent years, have provided the possibility of process optimization like never before. In order to improve the scrubber, nozzlecharacteristics and placement must be optimized to reduce the cost of the system implementation and mitigate risks of inadequatepollution reduction. In situ analysis would provide the best assessment of a spray’s characteristics in the tower, however oftenthis is cost prohibitive or not physically possible. In lieu of inline optimization, computational fluid dynamics (CFD) projects forthis type of application have become very useful. With CFD, gas conditioning process engineers are able to assess the sprayquality within the actual spray process region. Spraying Systems Co. has the unique combination of testing and modeling expertise that allowed for a rigorous validation ofspray modeling techniques often used to simulate un-testable situations. This body of work relates to the analysis of variousinjectors to examine their efficacy in SOz reduction, using a lime slurry injection. The nozzles were characterized using PhaseDoppler Interferometry (PDI) to determine drop size distribution and velocity at various operating conditions. This data is used toprovide accurate input to model the FGD process. 2. Equipment and Methods 2.1. Test Setup and Data Acquisition For drop sizing, the nozzle was mounted on a fixed platform in a vertical downward orientation. The data was acquired at600mm downstream of the nozzle exit orifice. Drop size and velocity information was collected at various operating conditions.Multiple points throughout the spray plume were measured with a mass and area weighted average reported for comparisonpurposes. A two-dimensional Artium Technologies PDI-200MD [9, 10] system was used to acquire drop size and velocitymeasurements. The solid state laser systems (green 532 nm and red 660 nm) used in the PDI-200MD are Class 3B lasers andprovide 50-60mWatts of power per beam. The lasersswere operated at an adequate power setting to overcomeinterference due to spray density. The transmitter and receiver were mounted on a rail assembly with rotary plates; a 40° forward scatter collection angle wasused. For this particular test, the choice of lenses was 1000mm for the transmitter and 1000mm for the receiver unit. This resultedin an ideal size range of about 4.0um-1638um diameter drops. The optical setup was used to ensure acquisition of the full rangeof drop sizes, while maintaining good measurement resolution. The particular range used for these tests was determined by apreliminary test-run where the DV0.5 and the overall droplet distribution were examined. For each test point, a total of 10,000samples were acquired. The experimental setup can be seen in Figures 1 and 2. Fig 1. Illustration of PDI layout for drop size and velocity data acquisition. Fig 2. Illustration of PDI during experiment The Dvo.i,Dvo.s,D32, and Dvo. diameters were used to evaluate the drop size data. This drop size terminology is as follows:Dvo.1: is a value where 10% of the total volume (or mass) of liquid sprayed is made up of drops with diameters smaller orequal to this value. D32: Sauter Mean Diameter (also known as SMD) is a means of expressing the fineness of a spray in terms of the surface areaproduced by the spray. SMD is the diameter of a drop having the same volume to surface area ratio as the total volume of all thedrops to the total surface area of all the drops. Dvo.s: Volume Median Diameter (also known as VMD or MVD). A means of expressing drop size in terms of thevolume of liquid sprayed. The VMD is a value where 50% of the total volume (or mass) of liquid sprayed is made up of dropswith diameters equal to or smaller than the median value. This diameter is used to compare the change in average drop sizebetween test conditions. Dvo.: is a value where 90% of the total volume (or mass) of liquid sprayed is made up of drops with diameters smaller or equalto this value. By analyzing drop size based on these standardized drop statistics it is possible to objectively characterize the quality andeffectiveness of this atomizing nozzle for the prescribed application. 2.2. Test Fluids and Monitoring Equipment All testing was conducted using water and solution to simulate the fluid properties of lime slurry. Flow to the system wassupplied using a high volume pump. The liquid flow rate to the injector was monitored with a MicroMotion flow meter andcontrolled with a bleed-off valve. The MicroMotion flow meter is a Coriolis Mass flow meter which measures the density of thefluid to determine the volume flow. The meter is accurate to 0.4% of reading. Liquid pressures were monitored upstream of theinjector with a 0-1.03MPa, class 3A pressure gauge. 2.3. Injectors Two types of injectors were evaluated to determine the effectiveness for this application. The injectors were full cone, narrowstyle injectors, of the Spraying Systems Co. FullJet style. The injectors were selected based on a target flow rate of 37.85 1pmflow. Multiple capacity sizes and configurations were used to achieve this design requirement. 3. Numerical Simulations 3.1. CFD Background Computational Fluid Dynamics (CFD) is a numerical method used to numerically solve fluid flow problems. Today’s CFDperforms use extremely large number of calculations to simulate the behavior of fluids in complex environments and geometries.Within the computational region, CFD solves the Navier-Stokes equations (Figure 3) to obtain velocity, pressure,temperature and other quantities that may be required by a tackled problem. Recently CFD became a popular design andoptimization tool with the help of commercially available software and advancing computer technology. The commercially available CFD package ANSYS FLUENT (version 14) was used for the simulation 3.2. Simulation Description Figure 4, shows a pilot wet absorber that has a capacity of 6 million Btu/hr. This geometry was used for the model of the highvelocity absorber [1]. The absorber has a gas flow capability of 4000 acfm, with SO2 concentrations up to 6000 ppmdv. The gasflow comes in from the inlet and continues through the absorber turn to the outlet. Liquid slurry enters from the injector(s) andmoves out from the system at quenching zone. The importance of the pollutant removal process is determined throughthe observation of the gas liquid interactions at the tray, improved by optimization of the injector system. Air and reacting gases inside the horizontal scrubber were set as primary phase flow (Eulerian approach). The primary phaseused coupled models (momentum, turbulence, energy, species mixing and reaction) which required boundary conditions(BC’s). This simulation consisted of inlet BC and outlet BC, set as "mass flow rate inlet" and "constant pressure outlet"respectively. The calcium carbonate injection was set as secondary phase (Lagrangian approach) where its inlet BC are based on sprayinjection parameters as determined empirically. The Lagrangian particles were set using “wet combustion" models. TheLagrangian particles were tracked using Discrete Phase Model (DPM). During computation, heat and mass transfer was coupledbetween primary and secondary phases. CFD Multiple Surface Reaction Model set-up reaction kinetic parameters and factorsare extracted and calculated through experimental results from Wang land probabilities method from Krebs . To generate the computation domain (mesh) for the scrubber shown in Figure 4, ANSYS workbench mesher (version 14) wasutilized. The mesh consisted of (single injector configuration) 44003 polyhedral cells and 217150 faces; (two injectorconfiguration) 53897 polyhedral cells and 273068 faces; (three injector configuration) 64391 polyhedral cells and 332411 faces,minimum cell size is 1e-5m. Due to its size and modeling complexity, the simulation required significant computer power andprocessing time. The walls had a common (standard) setup, with no slip, adiabatic (insulated) and reflect for the combustingparticles. 3.3. Wet Combustion Particle Surface Reaction Computational fluid dynamic (CFD) simulation is mainly using ANSYS Fluent Wet combustion particle surface reactionchemistry models, which have been developed and parametric tested during simulations. ANSYS Fluent can model themixing and transport of chemical species by solving conservation equation describing convection, diffusion, and reaction sourcesby its multiple surface reaction models [4]. Reaction occurred in the bulk phase is dealt with volumetric reaction, and particle surface reaction. For gas-phasereactions, the reaction rate is defined on a volumetric basis and the rate of creation and destruction of chemical species. Particlesurface reaction is used to model surface combustion on a discrete-phase particle. In the discrete phase model, modelingmultiple particle surface reactions makes the surface species as a “particle surface species". The initial relationship for calculating particle-burning rates were presented and discussed by Smith . The particle reactionrate, R (kg/m2.s), can be expressed as In above equation, the concentration at the particle surface, Cs, is unknown and eliminated as follows: This equation has to be solved by an iterative procedure in Fluent, with the exception of the cases when N=1 or N=0, which canbe written as (3) In the case of N=0, if there is a finite concentration of reactant at the particle surface, the solid depletion rate is equal to thechemical reaction rate. If there is no reactant at the surface, the solid depletion rate changes abruptly to the diffusion-controlledrate. ANSYS Fluent will always use the chemical reaction rate for stability reasons.Based on the above explanation, ANSYS Fluent uses the following equation to describe the rate of reaction r of a particle surfacespecies j with the gas phase species n. The rate is given as N The effectiveness factor is related to the surface area, which can be used in each reaction in the case of multiple reactions.D o,r is given as. (6) The kinetic rate of reaction ris defined as (7) The rate of the particle surface species depletion for reaction order Nr=1 is given by For reaction order N r =0, The surface reaction consumes the oxidant species in the gas phase, also consumes or produces energy, in an amountdetermined by the heat of reaction. The particle heat balance during surface reaction is It includes the diffusion and convection control of the vaporization model. 4. Results (Experimental and Numerical) 4.1. Experimental Results The results of the PDI measurements provide a representative characterization of the atomizer effectiveness at the600mm downstream investigation location. As outlined and described in the above sections, the results from testing are providedin Table 1. The Volumetric Mean Diameter (Dvo.5) as well as other representative diameter statistics based on the volume flow ispresented. These results allow the evaluation, qualitatively, of the dependence of drop size on the liquid flow rate and pressure. Table 1. Drop Size and Velocity Results of Empirical Investigation Nozzle ID Units 1HH-SS 3070 1/2GG-SS 3030 1/2GG-SS 3030 1/2GG-SS 3030 Pressure (dP) psi 82 111 40 71 DV0.5 micron 539 443 635 530 Distribution Parameter 2.5 2.5 2.5 2.5 Injected Flow pm 37.9 18.9 11.4 15.1 No. of Spray Levels 1 2 3 3 There are notable trends that persist throughout the data. With an increase in liquid feed pressure, there is a decrease in mediandrop size and an increase in mean drop velocity. 4.2. CFD Results One to three injectors were evaluated in series to determine optimal design parameters. All simulations were performed with aconsistent total mass flow rate of 37.9 lpm. The effect of the injector is evaluated to allow for a design with minimal waste andwall contact, to improve efficacy and decrease the required maintenance of the system. The results indicated the SO2 mass fractionin each case and SO2 removal for each case. Velocity magnitude and vertical velocity profile, discrete phase concentration andparticle tracking is shown to better understand the flow behavior and pattern in the scrubber. All cases achieve full SO2 reduction as designed. Three-nozzle scrubber has the best SO2 removal capability, based on calciumcarbonate consumption. Similarly, thetwo-nozzle scrubber shows a greater removal than one-nozzle scrubber with less calciumcarbonate consumption at the same supply quantity. This result indicates a trend relating smaller drop sizes to greater efficacy ofSO2 removal. Due to the relationship of drop size volume to surface area, with equivalent volume introduced into the system, it is possible to significantly increase surface area and associated surface reaction rate in the tower. Moreover, increasing sprayzone flow distribution will lead to higher efficiency. The velocity behaviour exhibits less oscillation and recirculation than the inthe three-nozzle scrubber at the same high inlet velocity. However, it causes adverse results with respect to wall wetting. It shouldbe noted that there is an especially high concentration area formed around spray zone, which is greater than expected. Wallimpingement may cause equipment erosion when injection fluid has corrosive property. Table 2. SO2 Scrubber CFD Simulation Species Data Case Name net species mass O2 SO2 CO2 CaCO: flow Slurry Consumption 1 Nozzle Injection kg/s 0.01854 0.06198 -0.05213 26.97% 2 Nozzle Injection kg/s 0.01592 0.06203 -0.04799 19.33% 3 Nozzle Injection kg/s 0.01643 0.06187 -0.05345 18.89% 0.0 Fig.5 Nozzle Injection Scrubber CFD Simulation Result Fig. 6 Nozzle Injection Spray Visualization Fig. 7 Nozzle Injection Scrubber CFD Simulation Fig. 8 Nozzle Injection Spray Visualization Fig. 9Nozzle Injection Scrubber CFD Simulation Result Fig.10 Nozzle Injection Spray Visualisation In the three nozzle case, at 11.4 and 15.1 lpm supply quantity, more supply does not show better SO2 reduction with smallerdrop size. This may be due to the fact that the 11.4 lpm supply case has already achieved 18.89% of slurry consumption.The marginal reduction in drop size my not have significant effect on slurry consumption at this level. Also, the 15.1 lpm supplycase has a total injection quantity of 45.4 lpm, when accounting for all injectors. This flow could be too much for the scrubber atthis input condition, which might lead to less efficiency by slurry accumulation. These results may need further research todetermine cause and effect of this result. 5. Conclusion The results presented herein, represent a preliminary work for SO2 removal based on different nozzle designs. From the netspecies mass flow table, it clearly shows the slurry consumption is below 50% for all the cases to remove targeted pollutants.The slurry injection quantity, effective usage research will be one of the further major subjects to improve scrubberefficiency. Considering the slurry flow behaviour from the simulation result, high velocity inlet helped with the SO fully removal,whileit also caused concerns relating to undesirable wall interactions. Therefore, a range of different velocity inlet tests on the influenceof nozzle selections, wall wetting and pollutant removal efficiency could make further improvements on this research. Furthermore, as discovering the nozzle efficiency, several tests could be made to get relationship between nozzle supplyquantity and nozzle provided droplet size for higher removal capability achievement. Through the optimal result, more nozzledesigns can be made based on nozzle properties to develop spray behaviour and decrease erosion on the walls with the requirementof standard removal or even better.Future studies are planned to further develop computational models and increaseunderstanding of FGD scrubber systems. Acknowledgements The authors would like to acknowledge Fang Li, of Spraying Systems Co. for her assistance with research and editorialcontributions for this project. ( Reference: ) ( [1] P. J . Williams. “Wet Flue Gas Desulfurization Pilot Plant Testing of High Velocity Absorber Modules”. P r esented to EPRI-DOE-EPA Combined Utility Air Pollutant Control Symposium, 1999. ) ( [2] Industria l Spray Products Catalog. Spraying System Co., B18-B31,2010. ) ( [3] Physical Data of Calcium Carbonate-water Suspensions. T A PPI TIP Category: Data and Calculations. TIP 010 6 -01,2002. ) ( [4] The Multiple Surface Reactions Model i n Discrete Phase. ANSYS FLUENT Theory Guide for Version 14.0, 427-428,2011 . ) ( [5] I .W. S mith."The Com bustion Rates of Coal Chars: A Revi e w". In 1 9 th Symp. (Int’l.) on Combustion. The C ombustion Instit u te, 1045-1065, 1 982. ) ( [6] H ] . W ang, H . Xu, C. Z heng and J. Q i u . “Tempe rature Dependence on Reaction of CaCO3 and SO2 in O 2/C O 2 coal com b ustion”. J o u rnal of C ent ral S outh U niversity, Vol. 16, pp. 0845-0850,2009. ) ( [7] |T. Krebs and G. M . Nathanson.“R e active Collision of Su l fur Dioxid e with Mo lten Car b onates”.PNAS Early Editio n , 2009. ) ( 81Lefebvre, A.W., Atomization and Sprays, Hemisphere Publishing Corporation,1989,p.1-78. ) ( 9] 1 Bachalo, W.D., " Experimental Methods i n Multiphase Flows", International Journal on Multiphase Flow, Vol.20,Suppl. pp . 261-295, 1 994 ) ( [10] Bachalo, W.D., "A M ethod for M e asuring the Size and Velocity of Spheres", by Dual Beam Lig h t Scatter Interferometry, Applied Optics, Vol. 19, No.3, F ebruary 1 , 1980. ) The reduction of environmental contaminants that contribute to smog and soot is a worldwide goal that has seen an increased focus in recentyears. In the United States, for example, it is estimated that by 2014 new rules will lead to a 71% reduction of sulfur dioxide emissions and 52%of nitrogen oxide emissions as compared to 2005 level. Thus, medium-sized plants (100-500MW) that currently do not have flue gasdesulfurization (FGD) units or selective catalytic reduction systems (SCRs) will be required to adapt. Similar emission reduction efforts areexpected to be adopted globally, albeit at different levels. Wet-scrubber FGD is characterized as one of the most effective SO2 removal techniqueswith low operating costs. However, capital cost for implementation is considered high. Hence an effective optimization procedure is required toreduce these capital costs of conversion.Power plants commonly use a lime slurry spray reaction to reduce SO2 emissions. Control of the droplets throughout the tower geometry isessential to ensuring maximum reduction while minimizing scale. The liquid slurry is known to have density, surface tension and viscosity valuesthat deviate from standard water spray characteristics, which complicates process optimization. In order to improve the scrubber, nozzlecharacteristics and placement must be optimized to reduce the cost of the system implementation and mitigate risks of inadequate pollutionreduction. A series of large flow rate, hydraulic, hollow cone sprays were investigated for this study.A Computational Fluid Dynamics (CFD) model was used to examine potential scrubber designs for optimization of the system. Nozzle parameterswere modeled to allow particle tracking through the system. An ANSYS Fluent Lagrangian particle tracking method was used with heat andmass transfer. The alkaline sorbent material and SO2 reaction is modeled to determine uniformity and efficacy of the system. Volumetricchemistry mechanisms were used to simulate the reaction. These results demonstrate the expected liquid-gas interaction relative to the systemefficiency. Drop size, liquid rheology, and spray array layout were examined to achieve SO2 removal above 90%. Wall impingement and flowpattern results were evaluated due to their impact in minimizing equipment plugging and corrosion required as for long-term scrubber utilization.
关闭-
1/12
-
2/12
还剩10页未读,是否继续阅读?
继续免费阅读全文产品配置单

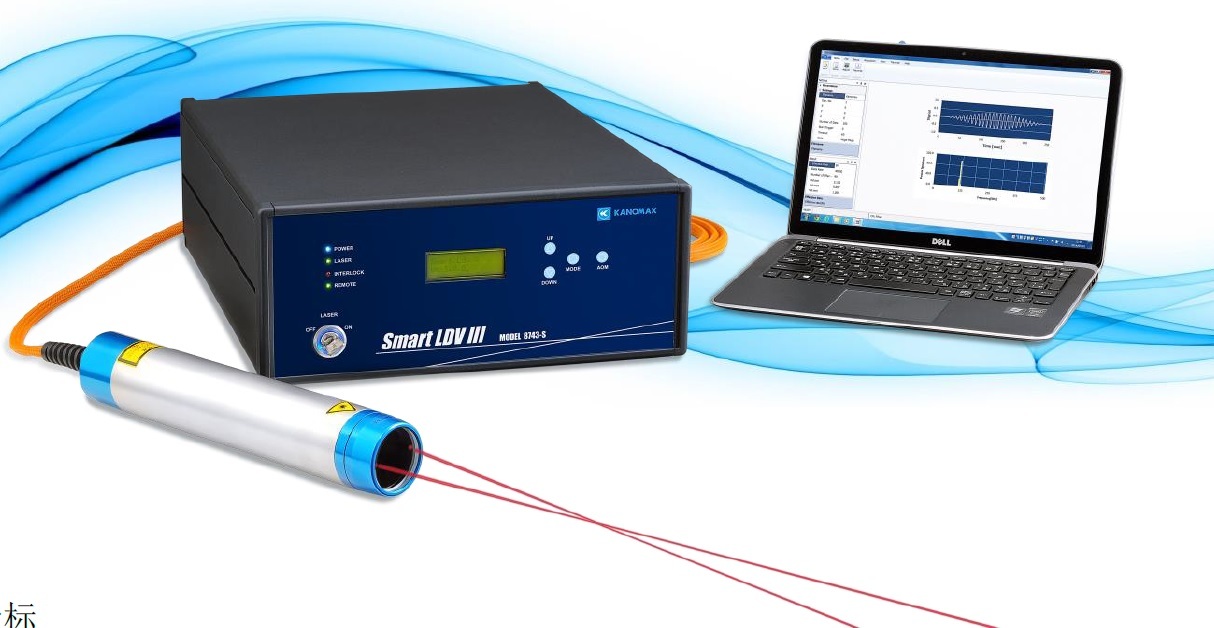

北京欧兰科技发展有限公司为您提供《二氧化硫洗涤塔中液滴流速和粒径检测方案(干涉仪)》,该方案主要用于其他中液滴流速和粒径检测,参考标准《暂无》,《二氧化硫洗涤塔中液滴流速和粒径检测方案(干涉仪)》用到的仪器有激光相位多普勒干涉仪LDV,PDI,PDPA,PDA、Artium PDI-FP 双量程可机载飞行探头、紧凑型激光多普勒测速仪(LDV)、德国LaVision PIV/PLIF粒子成像测速场仪。
我要纠错
推荐专场


相关方案
-
方案 离子液体气/液界面,烷基链中取向度的振动和频光谱(SFG)研究,振动和频光谱(SFG)研究,和频光谱(SFG)研究检测方案(其它光谱仪)
其他 | 取向度的振动和频光谱(SFG)研究,振动和频光谱(SFG)研究,和频光谱(SFG)研究

- 查看全部方案
 咨询
咨询