

方案详情文
智能文字提取功能测试中
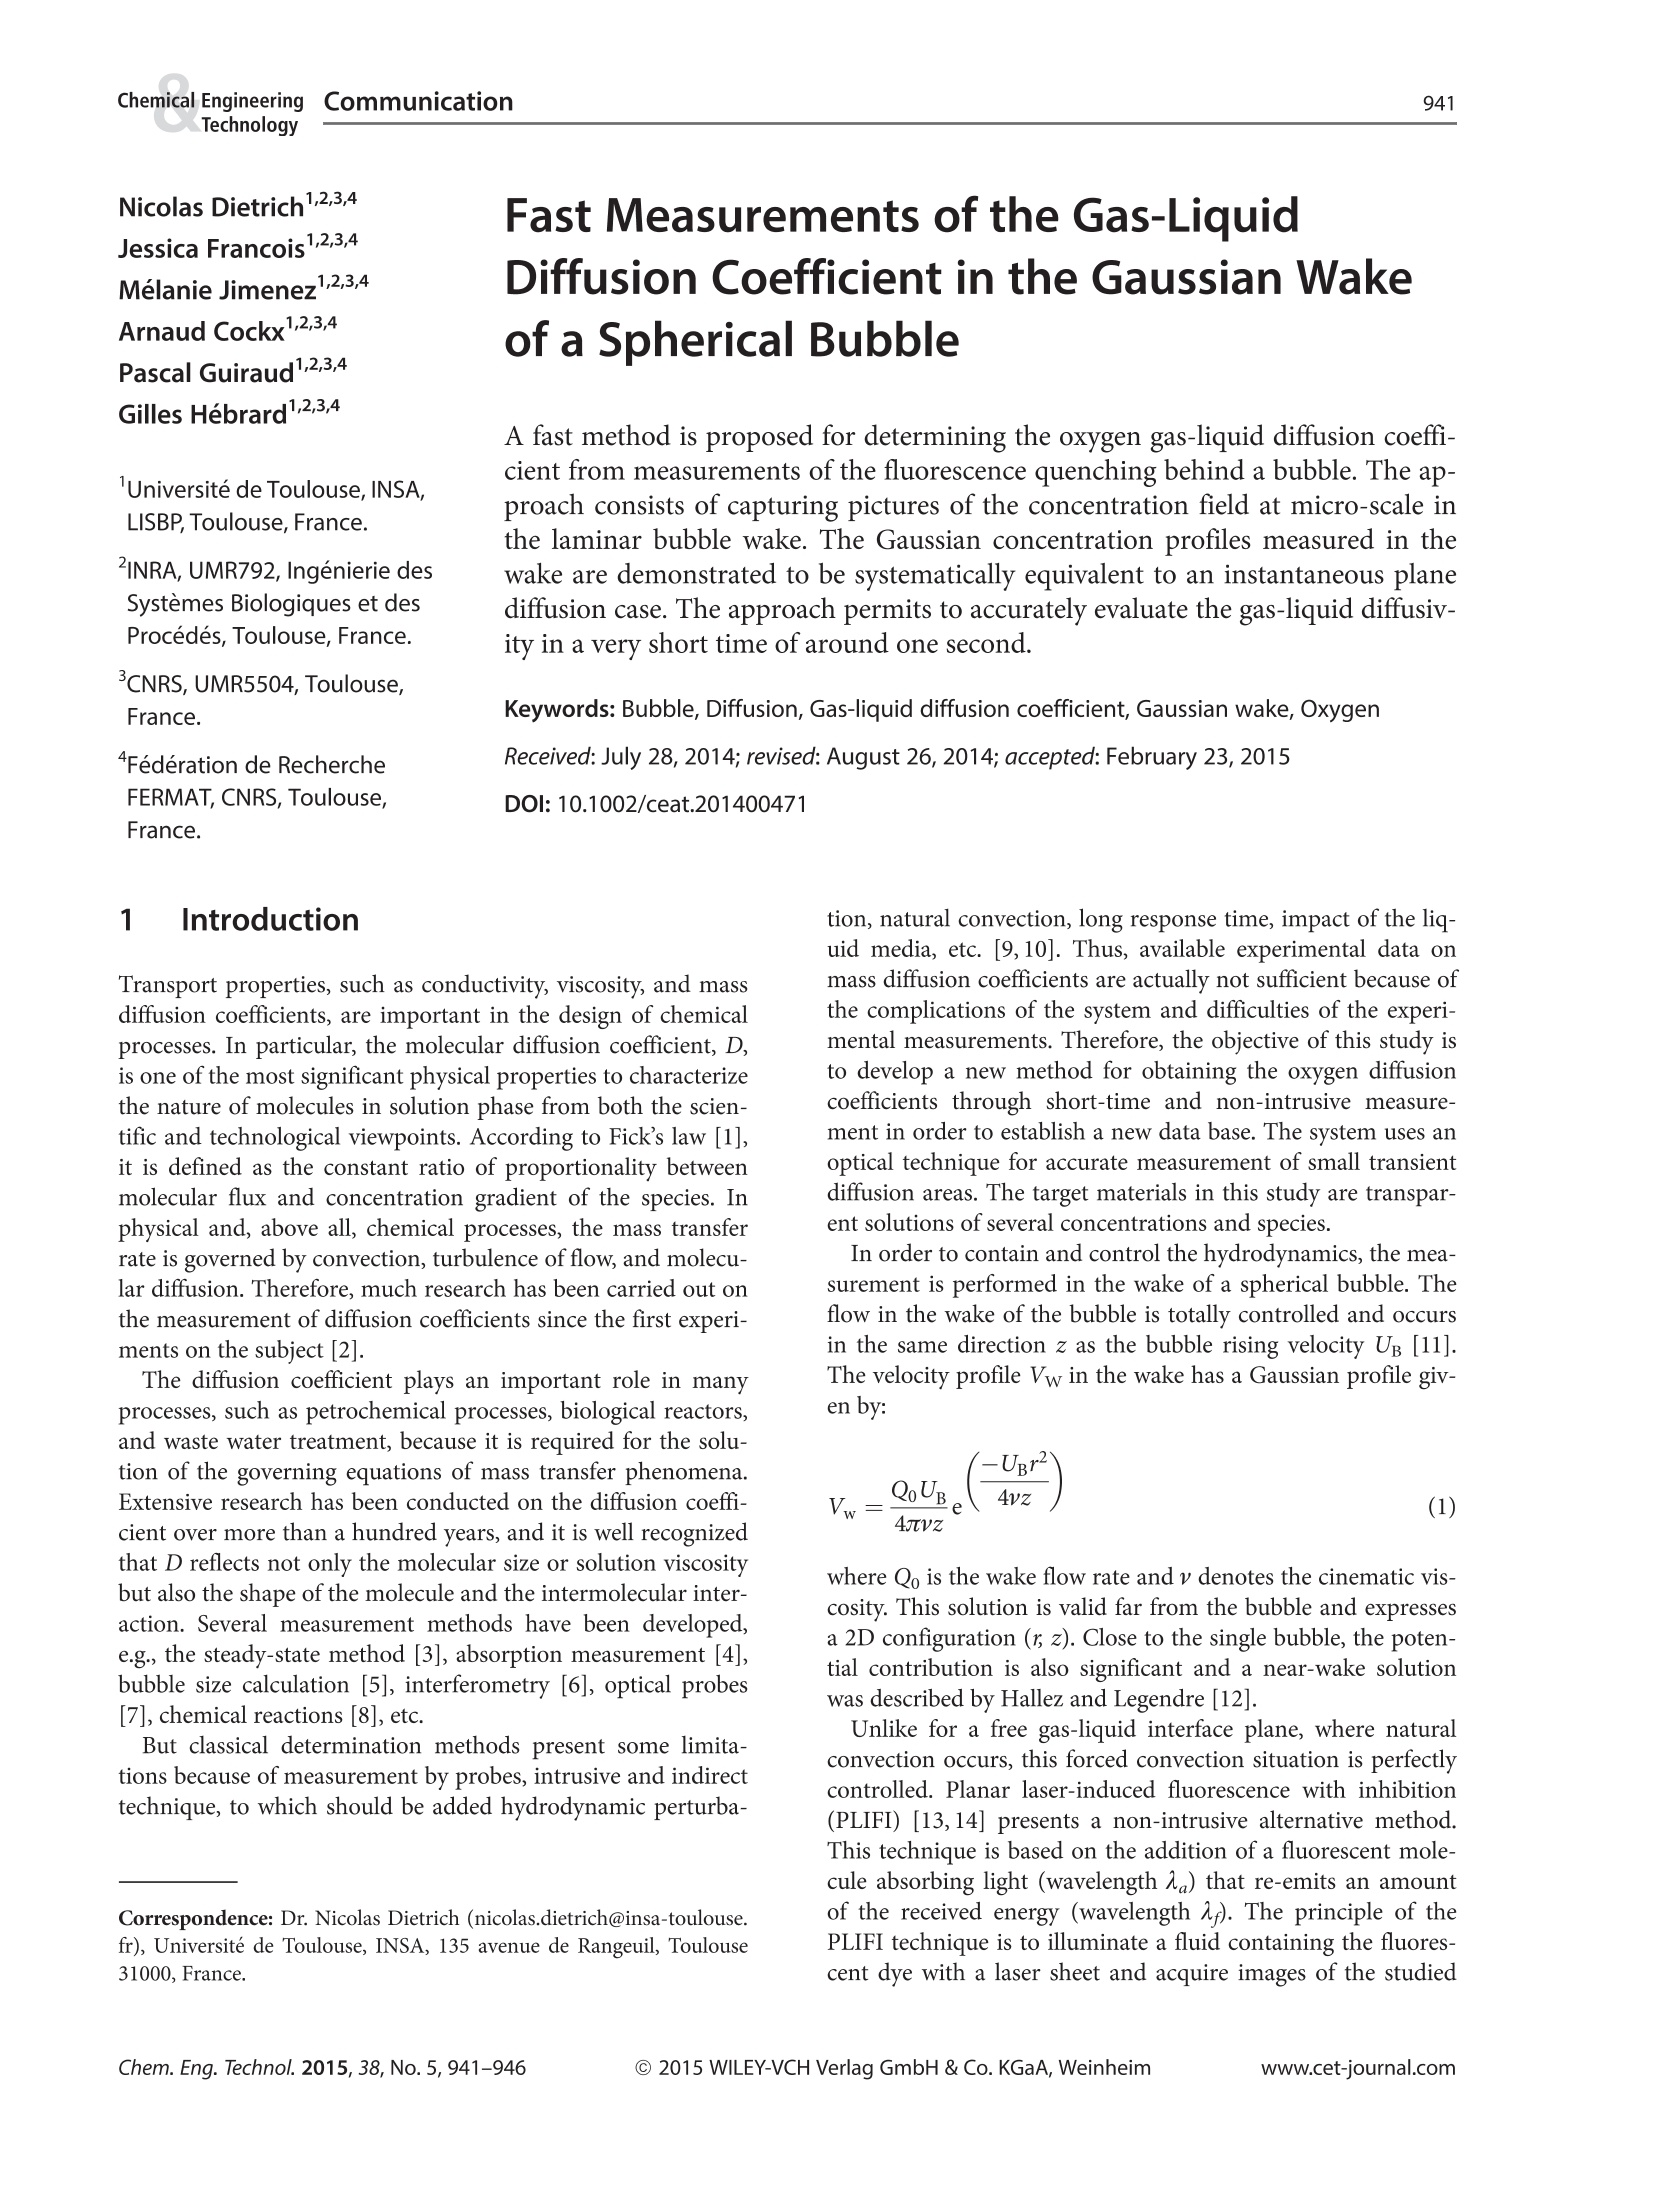
ResearchGateSee discussions, stats, and author profiles for this publication at: https://www.researchgate.net/publication/274141319 Chemical EngineeringCCommunication941Technology Fast Measurements of the Gas-Liquid DiffusionCoefficient in the Gaussian Wake of a SphericalBubble Article in Chemical Engineering & Technology· March 2015DOI: 10.1002/ceat.201400471 CITATIONS2 READS 47 6 authors, including: Nicolas Dietrich Arnaud Cockx Institut National des Sciences Appliquees de ... Institut National des Sciences Appliquees de ... 45 PUBLICATIONS 257 CITATIONS 61 PUBLICATIONS 841 CITATIONS SEE PROFILE SEE PROFILE Gilles Hebrard Institut National des Sciences Appliquees de ... 52 PUBLICATIONS 914 CITATIONS SEE PROFILE Some of the authors of this publication are also working on these related projects: An innovative colorimetric technique to locally visualize and characterize gas-liquid mass transfer inmilli/microreactors View project All content following this page was uploaded by Arnaud Cockx on 28 April 2015. The user has requested enhancement of the downloaded file. All in-text references underlined in blue are added to the original documentand are linked to publications on ResearchGate, letting you access and read them immediately. Nicolas Dietrich1,2,3,4 Jessica Francois1,2,3,4Melanie Jimenez1,2,3,4Arnaud Cockx1,2,3,4Pascal Guiraud1,2,3,4Gilles Hebrard1,2,3,4 Universite de Toulouse, INSA,LISBP,Toulouse,France. INRA,UMR792, Ingenierie desSystemes Biologiques et desProcedes, Toulouse,France. CNRS, UMR5504, Toulouse,France. “Federation de RechercheFERMAT, CNRS, Toulouse,France. Fast Measurements of the Gas-LiquidDiffusion Coefficient in the Gaussian Wakeof a Spherical Bubble A fast method is proposed for determining the oxygen gas-liquid diffusion coeffi-cient from measurements of the fluorescence quenching behind a bubble. The ap-proach consists of capturing pictures of the concentration field at micro-scale inthe laminar bubble wake. The Gaussian concentration profiles measured in thewake are demonstrated to be systematically equivalent to an instantaneous planediffusion case. The approach permits to accurately evaluate the gas-liquid diffusiv-ity in a very short time of around one second. Keywords: Bubble, Diffusion, Gas-liquid diffusion coefficient, Gaussian wake, OxygenReceived: July 28, 2014; revised: August 26, 2014; accepted:February 23, 2015 DOI: 10.1002/ceat.201400471 Introduction Transport properties, such as conductivity, viscosity, and massdiffusion coefficients, are important in the design of chemicalprocesses. In particular, the molecular diffusion coefficient, D,is one of the most significant physical properties to characterizethe nature of molecules in solution phase from both the scien-tific and technological viewpoints. According to Fick’s law [1],it is defined as the constant ratio of proportionality betweenmolecular flux and concentration gradient of the species. Inphysical and, above all, chemical processes, the mass transferrate is governed by convection, turbulence of flow, and molecu-lar diffusion. Therefore, much research has been carried out onthe measurement of diffusion coefficients since the first experi-ments on the subject [2]. The diffusion coefficient plays an important role in manyprocesses,such as petrochemical processes, biological reactors,and waste water treatment, because it is required for the solu-tion of the governing equations of mass transfer phenomena.Extensive research has been conducted on the diffusion coeffi-cient over more than a hundred years, and it is well recognizedthat D reflects not only the molecular size or solution viscositybut also the shape of the molecule and the intermolecular inter-action. Several measurement methods have been developed,e.g., the steady-state method [3], absorption measurement [4],bubble size calculation [5], interferometry [6], optical probes[7], chemical reactions [8], etc. But classical determination methods present some limita-tions because of measurement by probes, intrusive and indirecttechnique, to which should be added hydrodynamic perturba- ( Correspondence: Dr . Ni c olas Di e trich (n i colas.dietrich@insa-toulouse.fr), Universit e d e Toulouse , INSA, 135 avenue de Rangeuil, Toulouse31000, France. ) tion, natural convection, long response time, impact of the liq-uid media, etc. [9,10]. Thus, available experimental data onmass diffusion coefficients are actually not sufficient because ofthe complications of the system and difficulties of the experi-mental measurements. Therefore, the objective of this study isto develop a new method for obtaining the oxygen diffusioncoefficients through short-time and non-intrusive meast e-ment in order to establish a new data base. The system uses anoptical technique for accurate measurement of small transientdiffusion areas. The target materials in this study are transpar-ent solutions of several concentrations and species. In order to contain and control the hydrodynamics, the mea-surement is performed in the wake of a spherical bubble. Theflow in the wake of the bubble is totally controlled and occursin the same direction z as the bubble rising velocity UB [11].The velocity profile Vw in the wake has a Gaussian profile giv-en by: where Qo is the wake flow rate andv denotes the cinematic vis-cosity. This solution is valid far from the bubble and expressesa 2D configuration (r z). Close to the single bubble, the poten-tial contribution is also significant and a near-wake solutionwas described by Hallez and Legendre [12]. Unlike for a free gas-liquid interface plane, where naturalconvection occurs, this forced convection situation is perfectlycontrolled. Planar laser-induced fluorescence with inhibition(PLIFI) [13,14] presents a non-intrusive alternative method.This technique is based on the addition of a fluorescent mole-cule absorbing light (wavelength Aa) that re-emits an amountof the received energy (wavelength A). The principle of thePLIFI technique is to illuminate a fluid containing the fluores-cent dye with a laser sheet and acquire images of the studied solution in the enlightened area with cameras. These moleculesare called quenchers because they can inhibit the fluorescence[15-17]. It is observed that the fluorescence intensity decreaseswith the increase of the quencher concentration following theStern-Volmer equation [18]: Ksv is the Stern-Volmer constant (Lmg), Io is the fluores-cence intensity, and I denotes this intensity in the absence ofthe quencher. Several works described the possibility of visual-izing the oxygen concentration field [19] or in the wake of asingle bubble [13-16, 20]. Qualitative measurements have beenobtained for the oxygen transferred in the wake of a rising bub-ble [13-17, 21-27] and also for the carbon dioxide concentra-tion map around a single bubble [21,28]. The main limits of the PLIFI technique results from the lightreflection and refraction on the bubble surfaces. A light ring isobserved around the bubble, with a shadow on the side of thebubble creating a strong contrast between the both sides of thepicture. Considering these results obtained in previous works,the PLIFI technique appears quite promising despite its obvious optical limitations. Some authors [14-16] proposed an alterna-tive configuration to avoid these problems in order to follow theoxygen concentration field in the wake of bubbles. In thisconfiguration, the laser sheet was perpendicular to the bubbletrajectory and horizontal sections in the bubble wake were ob-tained. From these experiments, a mass transfer coefficient wascalculated and a new approach is proposed to calculate fluidproperties of the liquid from this alternative configuration. 2 Materials and Methods The experimental setup displayed in Fig. 1 a comprises a trans-parent glass column (0.1×0.1×0.3 m’) with a side fitted with thesystem of injection (1) to generate bubbles of specific sizes[29, 30]. It was composed of a thin glass capillary with a diame-ter of~ 100 um linked to a syringe pump (Harvard PHD 2000).The tank was filled with a fluid containing the fluorescent dye,i.e., theruthenium-complex C72H48NgO,Ru(Nanomeps,France) at a concentration of 30 mg L. A laser sheet was gener-ated (2) by a Nd:Yag laser (3) (a= 532 nm, 10 Hz, 200 mJ) inthe horizontal xy plane. As indicated in Fig. 1 b, the laser sheet isperpendicular to the bubble trajectory. A 12-bit charge-coupled Figure 1.(a) Experimental setup. (b) Schematic representation of the bubble wake crossed by the laser sheet in the xy plane.(c) Rawfluorescence image expressed in gray values of a bubble wake cross section in water at z=3dg. The image corresponds to the intersec-tion of the dashed lines in the xy plane in (b). device camera (4) (Imager Intense, LaVision, Germany, 10 Hz,1040×1376 pixel) was placed below the column along thevertical z axis, i.e., perpendicularly to the laser plane, to acquirepictures of the fluorescence emitted by the fluid. A 105-mmobjective with three teleconverters was fitted to the camera toreach a spatial resolution of 2.3 um per pixel. In order to visual-ize only the fluorescence, a 570-nm high-pass filter (5) was used. A programmable trigger unit (LaVision, Germany)synchronized the camera and the laser device. A second camera(PCO 1200, Germany, 10 bits, 770 Hz, 1024×1280 pixel) wasplaced on the lateral side (6) of the column (y axis) to record ata high frequency the bubble movement and then make possiblethe measurement of bubble size and bubble velocity. A 60-mmobjective was fitted to this camera (55 pm per pixel). 3 Results For each experiment, the solution was previously deoxygenatedwith nitrogen. Then a single oxygen bubble of two sizes withdg~ 1.5 and ~0.7 mm was formed in the immobile fluid.Theexperimental conditions are presented in Tab. 1. Image processing of the high-speed camera images by Matlabsoftware permits the calculation of the bubble diameter, dB, andvelocity, Ug. Then the distance z between a fluorescent recordingand the position of the bubble could also be determined. The different oxygen concentration field cross sections in thebubble wake were then recorded with the CCD camera at afrequency of 10 Hz. As an example, a raw image is displayed onFig.1 c. For recording, the information was originally acquiredin gray values and then converted into mass concentration withthe suitable calibration curve (Eq. (2)). Fig.2 displays six super- Table 1. Hydrodynamic conditions for the six sets of experi-ments at 20℃. Experiment Glycerol u dB UB Re Flux No. [wt%] ×10- [mm] [ms ] [-] ×10 Pas [gm²s-}] 1 43 58 1.88 0.047 1.8 0.208 2 18 7.0 1.29 0.117 26 1.43 3 18 7.0 0.72 0.032 3.4 1.05 4 8 2.6 1.30 0.203 107 4.96 5 8 2.6 0.78 0.071 22 1.78 6 0 1.0 0.72 0.110 74 7.43 imposed elevated cross sections recorded with approximately100 dg distance between them. The oxygen concentration fieldsappear symmetric with a 3D Gaussian profile forming a con-centric, rounded gradient of oxygen with the maximum con-centrations at the center of the spot. In this figure, a diffusionphenomenon is discernible, with substantial flattening andwidening with the time and distance far from the bubble;t=0is chosen for the first picture. 4 Discussion The validity of the assumption of a 2D diffusion process isdemonstrated by the straightness of the symmetry of the oxy-gen spots. From these concentration fields, one can estimate Figure 2. Elevated dissolved oxygen concentration fields in the bubble wake cross sections at z = 3dg, 96dg, 151.8dg,393.8dg, 449.4dg,and 747dg (System 6). the flux value calculated at successive distances z from the bub-ble: After the near wake of the bubble which is approximatelyequivalent to z=10√Re, the oxygen flux (Eq. (3)) becomesconstant and corresponds to the total amount of mass trans-ferred by the single bubble [15,16]. The convection in the wakebecomes essentially axial (Eq. (1)) whereas the oxygen trans-port is mainly radial and dominated by diffusion (Fig. 3 a). Interms of time, it corresponds to about 1-1.3 s after the bubblepassage. The oxygen concentration profile [O2] is measuredfrom the bubble wake cross-sectional images. A sample of aver-aged ortho-radial oxygen concentration profiles acquired atdifferent times is plotted in Fig. 3 a. As these experimental pro-files are very similar, they can be superimposed in Fig. 3 b. Thedimensionless concentrations are presented versus the dimen-sionless radial position r/o where o is the standard deviation ofthe Gaussian equation. The graph obtained demonstrates theperfect self-similarity of the measurements which implies thatthe results are auto-validated and really accurate. At t~0, the oxygen spot always has a radius of around100 um. Due to the small size of the concentration field behindthe bubble, i.e., around 10 % of the bubble size, it can be esti-mated with Oseen’s equation (1) [11] that the velocity in thisfield can be assumed to be constant, axial, and equal to theGaussian maximum velocity. Then, after several bubble dia-meters, the oxygen radial transport due to convection can beneglected as regards radial diffusion. The oxygen field in thewake is then observed to evolve as a Gaussian curve. This ob-servation is in total agreement with the analytical solution ofthe Fickian diffusion equation [31]. In particular, the transientsolution for an instantaneous plane source Mo in an infinitemedium is: where Mo is the linear amount of substance diffusing from aDirac point. This solution can be used far from the bubblewith, Mo=Flux/Ug and 4DT=20 to express the 2D concen-tration Gaussian profile: The standard deviation of the Gaussian profile can then bedefined as: This term could be measured experimentally for each oxygenspot (Fig.3). The standard deviation o depends on the squareroot of the time √t and the slope of this function (Eq. (6)) al-lows for quickly calculating the diffusion coefficient corre-sponding to the medium under study (slope=√2D). In thismethod, the determination of the concentration can be dimen-sioned by the maximum of the concentration field in r= 0,[O2]/[O2]max (Fig. 3b) and thus the liquid solubility as any cali-bration curve is not necessary: In the experiments, the initial (t=0) standard deviation aofor the first spot image varied from 67 to 85 um. In Fig. 4, theordinate axis has been translated by Ao=0-0o=Ao=√2Dtto allow the comparison between experiments. A very clear lin-ear trend can be observed for all the systems, with a regressionlinearity coefficient of less than 1 %, confirming the applicabil- ity of the diffusion model of Eq. (4). The slope of the curve [02](mg.L") Figure 3. (a) Radial [O2] profiles at z=3dg,96dg, 189dg,282dg (System 6). (b) Self-similarity curve for [Oz]/[O2]max for the System 6 experiments. Figure 4. Variation of the standard deviation Gaussian spot swith √t. Table 2. Hydrodynamic conditions for the six sets of experi-ments at 20℃... Experiment Glycerol Dmeasured [m’s ] Dliterature [ms ] No. wt% [36] 43 3.97×10⁻¹ 4.03×10⁻¹¹ 2 18 3.22×10⁻¹⁰ 3.21×10⁻¹⁰ 3 18 3.26×10⁻¹⁰ 3.21×10⁻¹⁰ 4 8 9.03×10⁻¹⁰ 9.19×10⁻¹⁰ 5 8 9.15×10⁻¹⁰ 9.19×10⁻¹⁰ 6 0 2.09×10 2.14×10 times under identical operating conditions. The deviation ofthe measured diffusion coefficient was of the order of 3 %. Fortwo concentrations of glycerol, i.e.,8 and 18 wt%, the experi-ments were performed for two different sizes of bubbles,namely, 0.7 and 1.3 mm. The diffusion coefficient varied by lessthan 1% between the two bubble sizes. Even though the initialsizes of the oxygen spots r,o were quite different, their timeevolution depended only on diffusive transport. In particular,Eq. (4) is the solution for a point source ri,o =0. This equationis then applicable whatever the bubble size (0.7-1.88 mm) aslong as the experimental configuration can be assumed to beaxisymmetric and without any radial convection. All these re-sults clearly validate the magnitude of the experimental quanti-tative measurements. The essential feature of the present method is that the mea-surement is accomplished in a very short time within a few sec-onds. The time necessary for the diffusion spot to reach thebubble size is estimated from Eq. (6) as t= dg /16D. The accu-racy is high with less than 2 % and the measurement needs tobe achieved at microscale (diffusion area <
-
1/7
-
2/7
还剩5页未读,是否继续阅读?
继续免费阅读全文产品配置单


北京欧兰科技发展有限公司为您提供《球形气泡高斯尾流区域中气体-液体扩散系数检测方案(CCD相机)》,该方案主要用于其他中气体-液体扩散系数检测,参考标准《暂无》,《球形气泡高斯尾流区域中气体-液体扩散系数检测方案(CCD相机)》用到的仪器有德国LaVision PIV/PLIF粒子成像测速场仪、PLIF平面激光诱导荧光火焰燃烧检测系统。
我要纠错
推荐专场


相关方案
-
方案 离子液体气/液界面,烷基链中取向度的振动和频光谱(SFG)研究,振动和频光谱(SFG)研究,和频光谱(SFG)研究检测方案(其它光谱仪)
其他 | 取向度的振动和频光谱(SFG)研究,振动和频光谱(SFG)研究,和频光谱(SFG)研究

- 查看全部方案
 咨询
咨询