
方案详情文
智能文字提取功能测试中
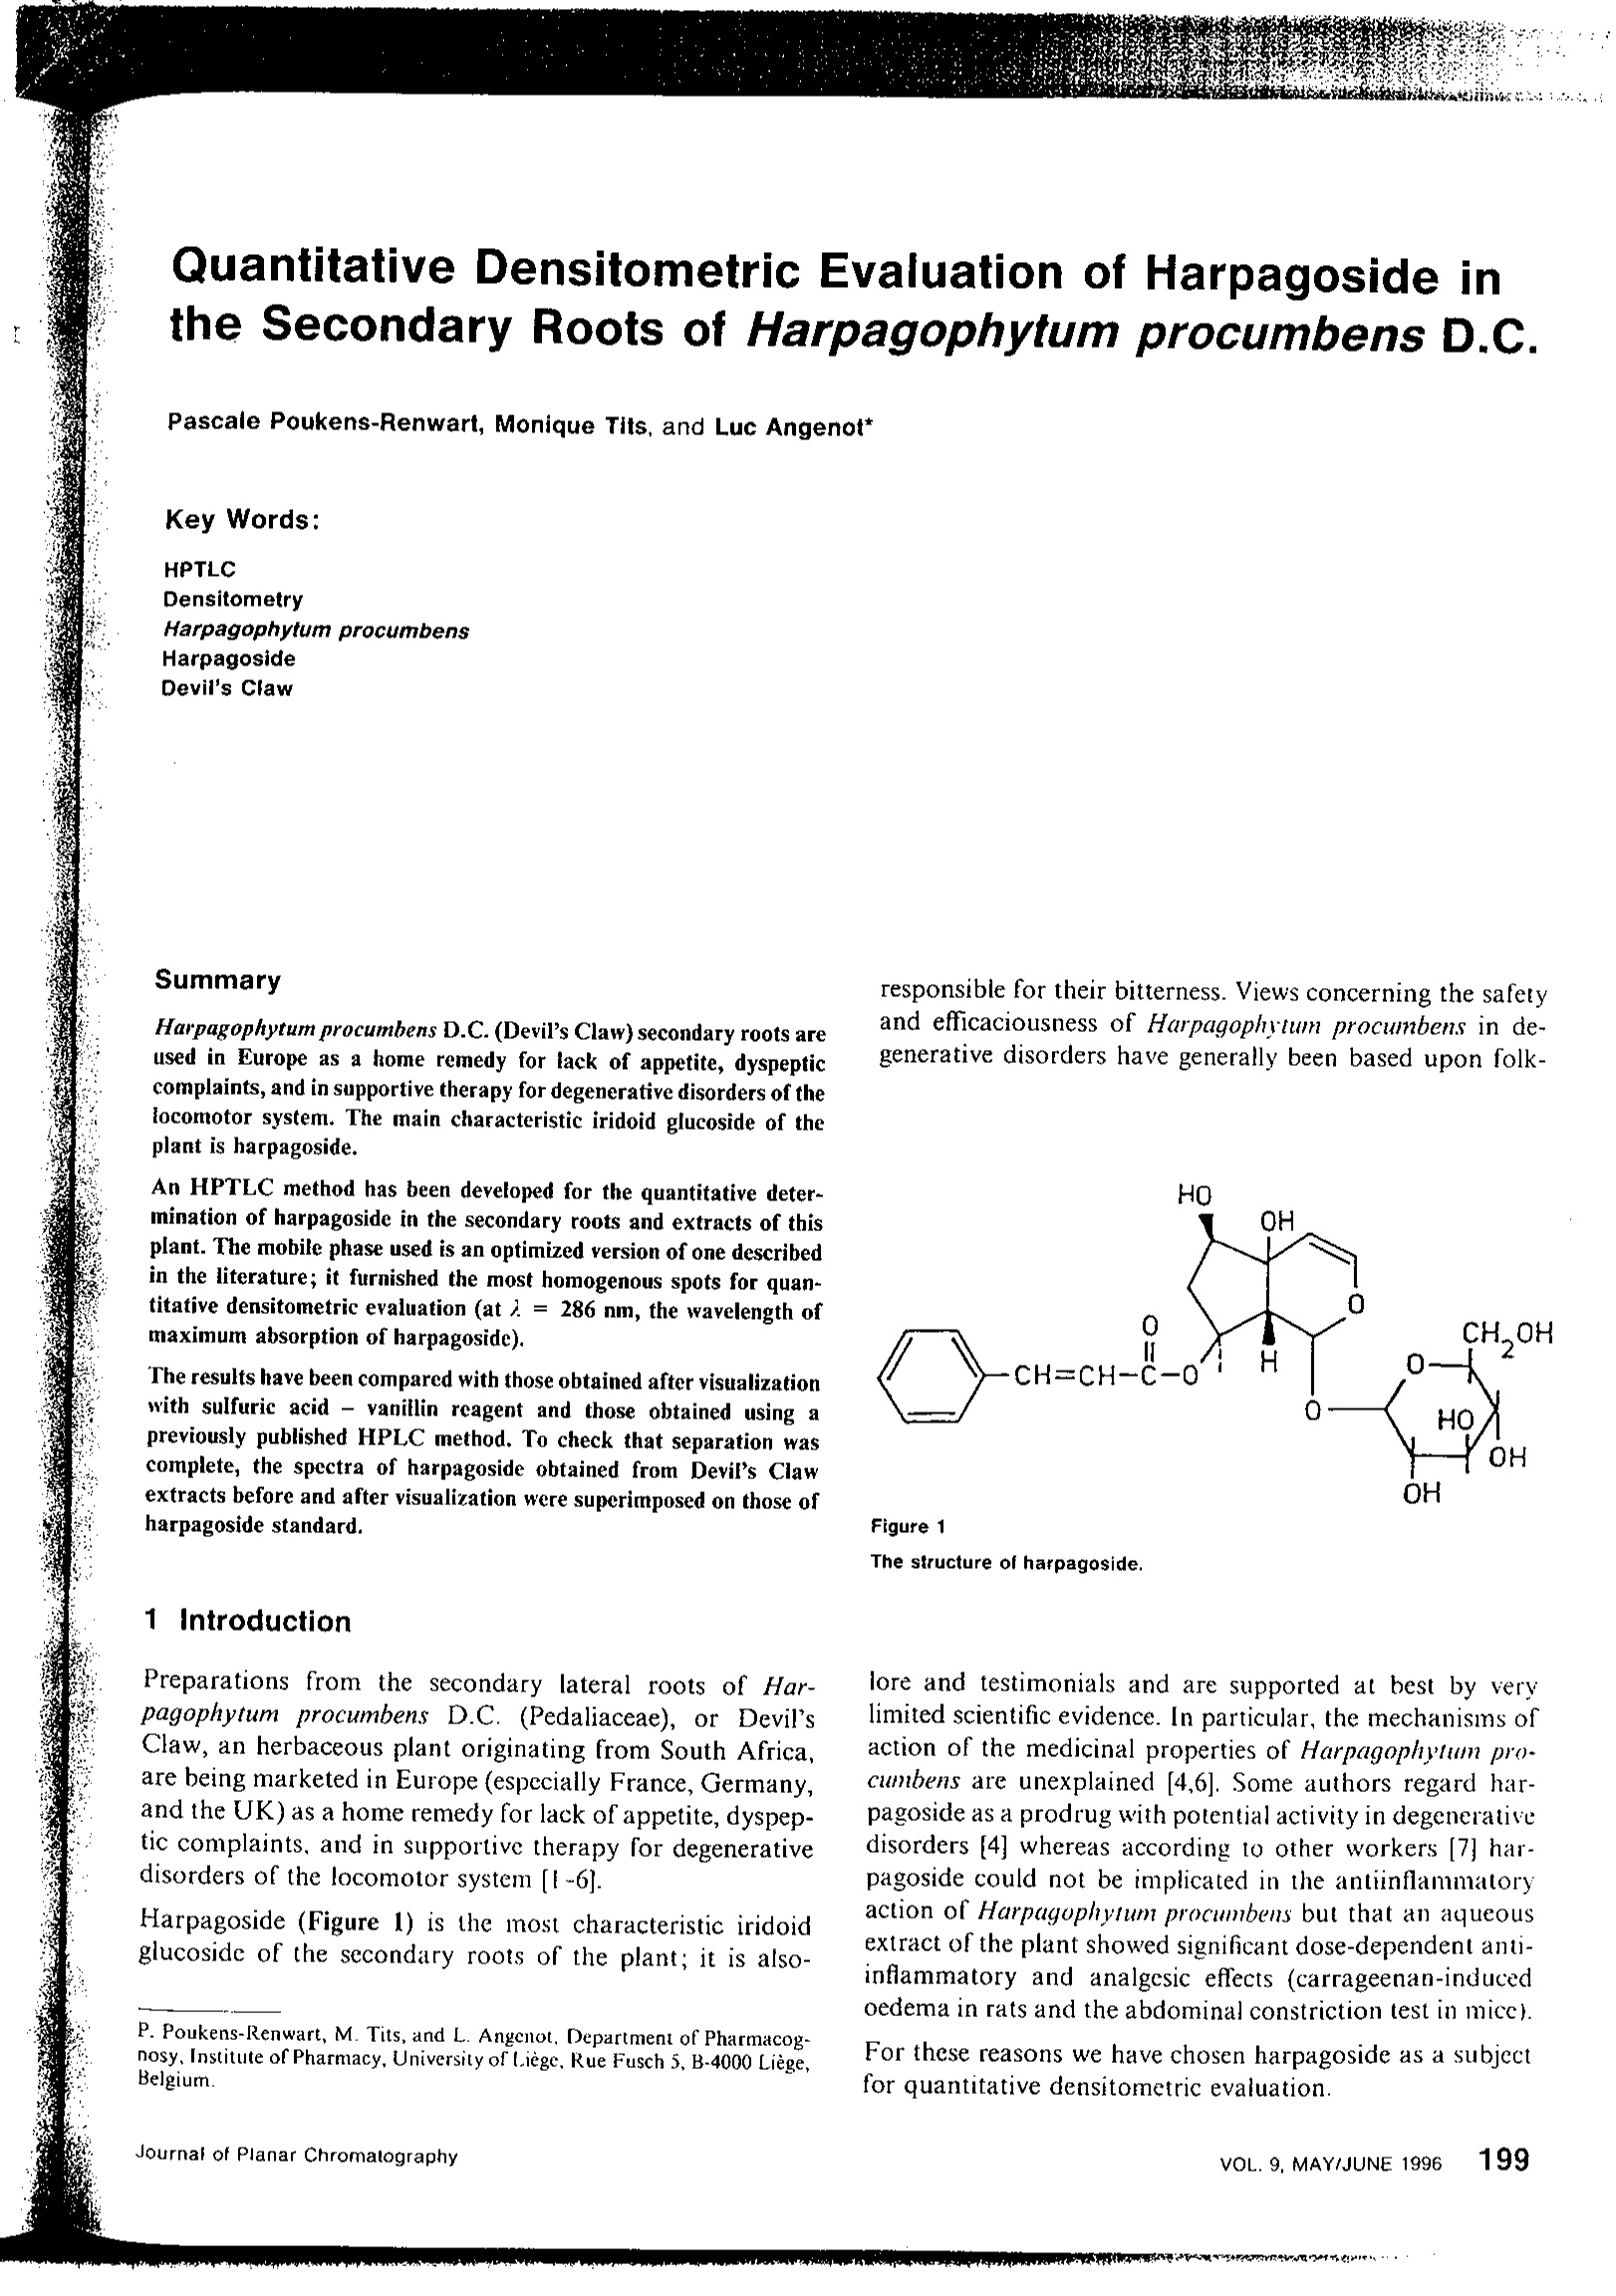
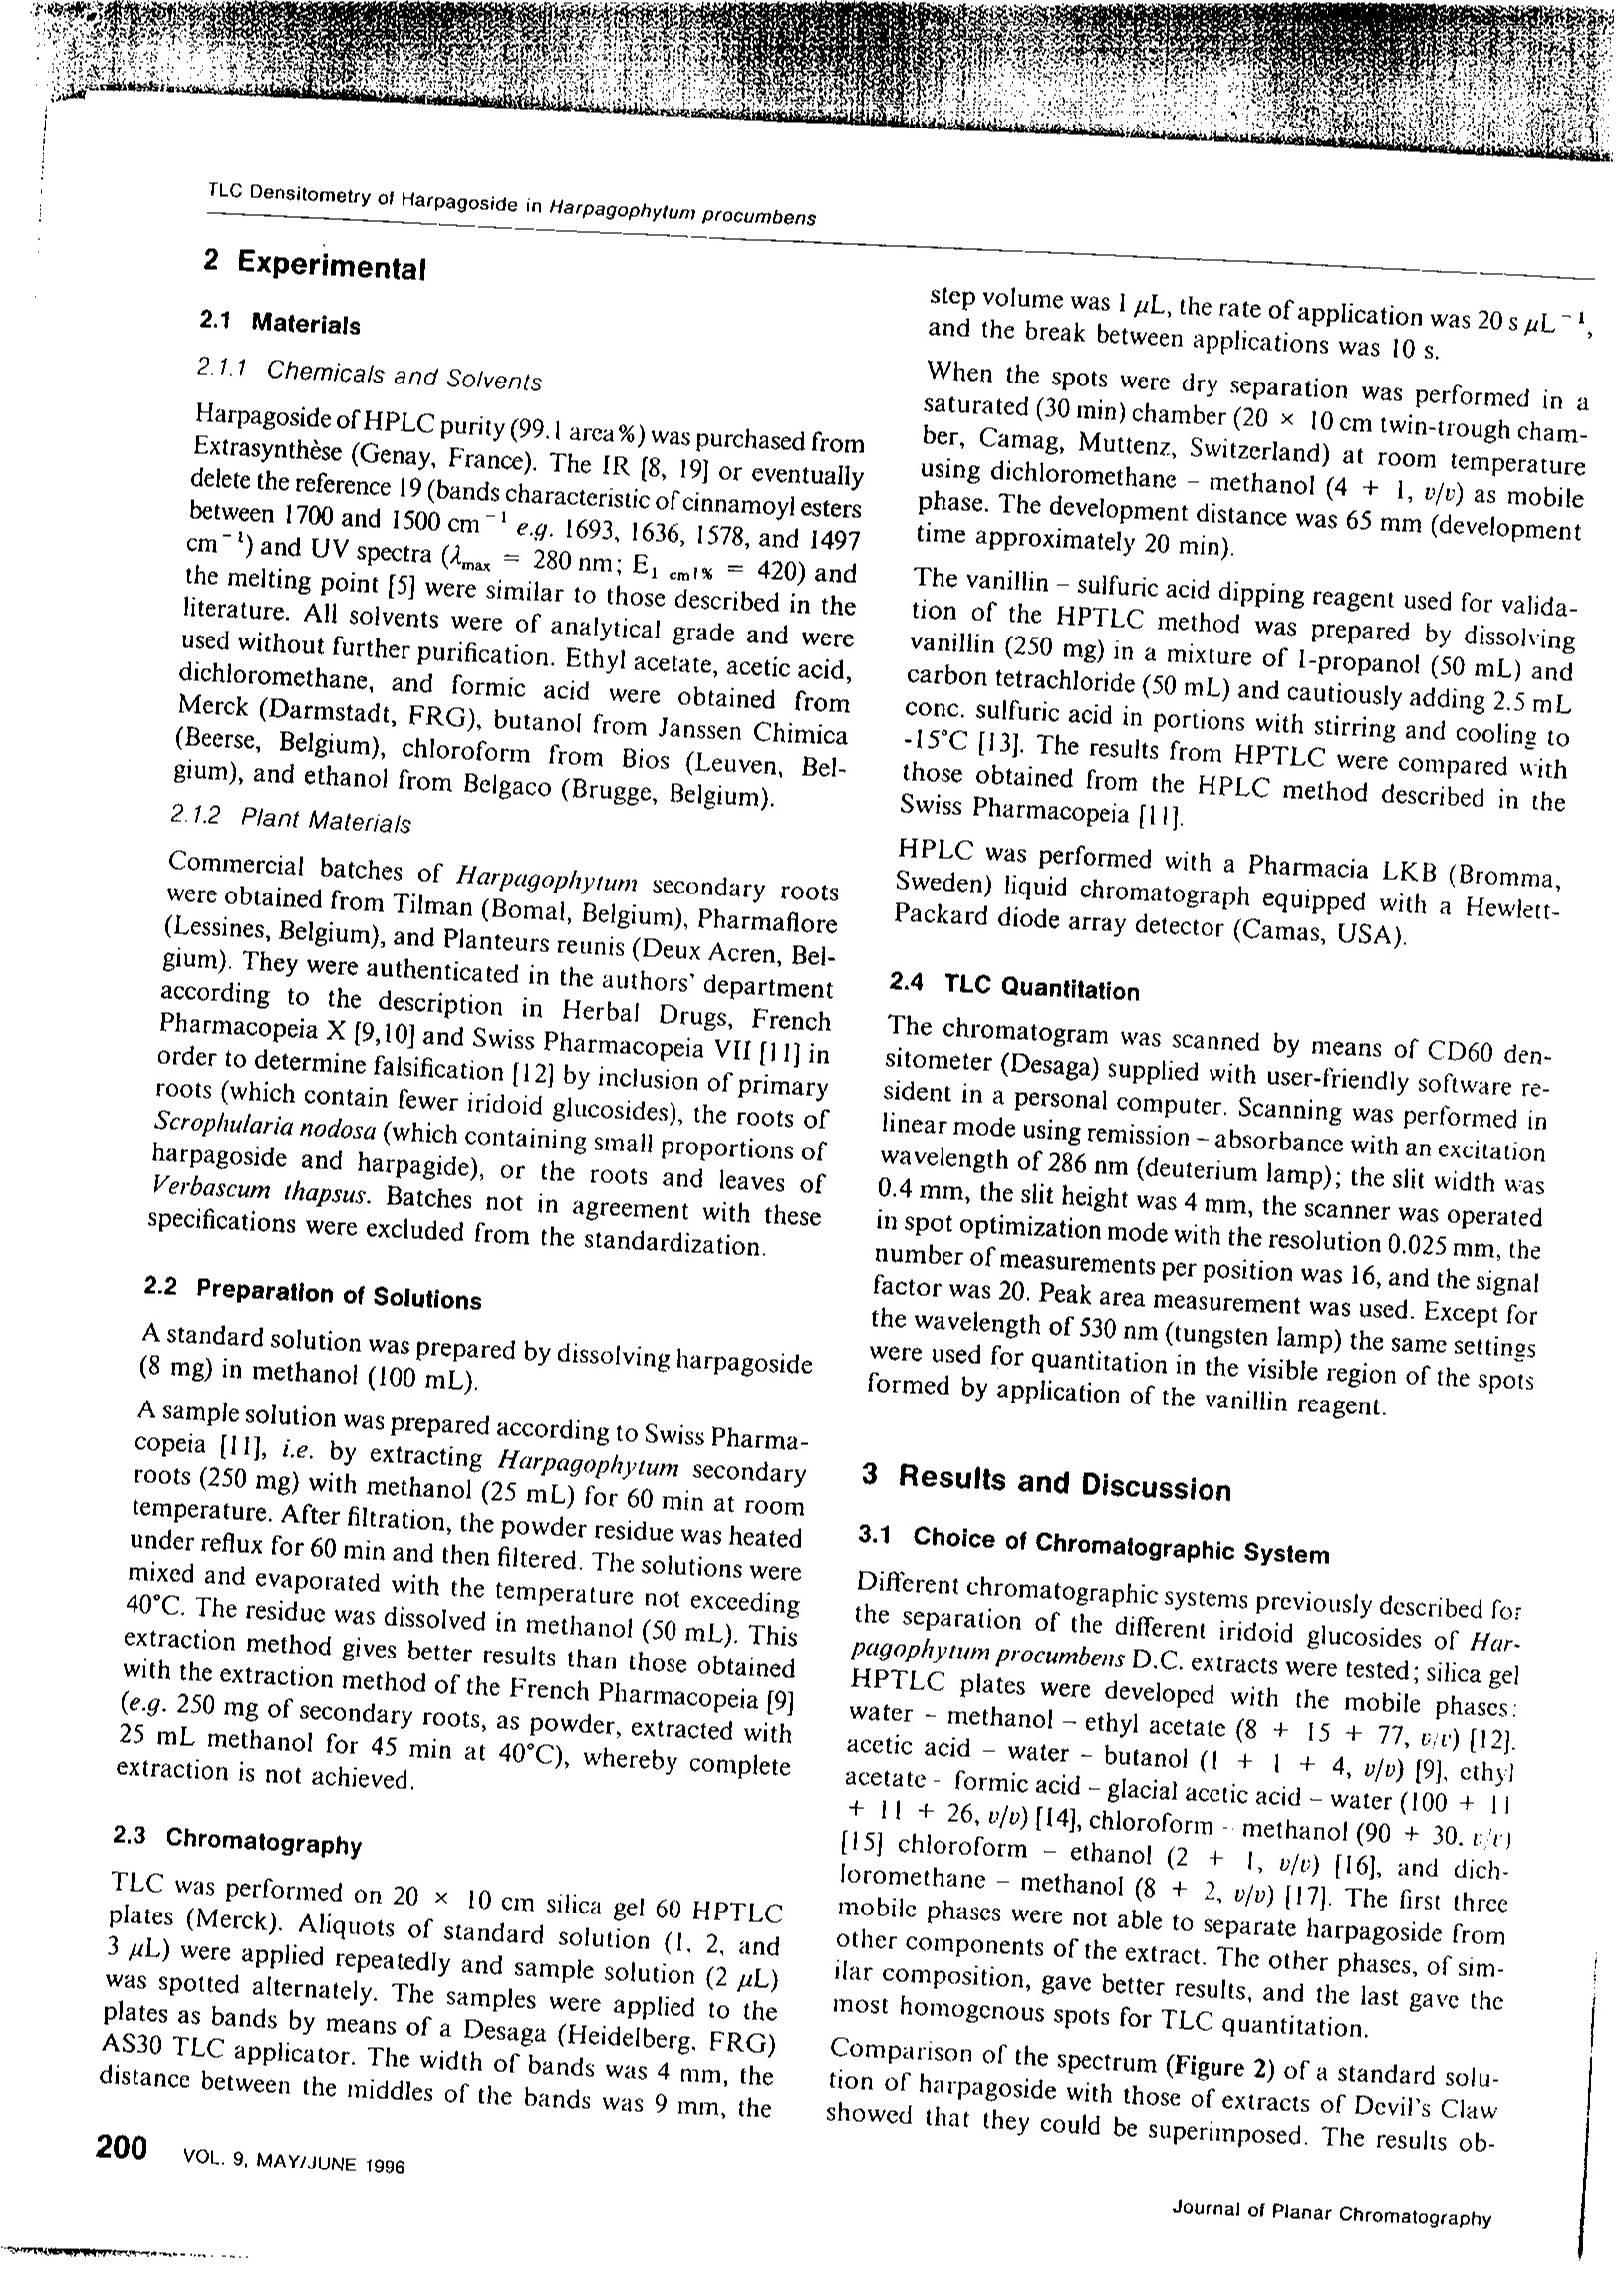
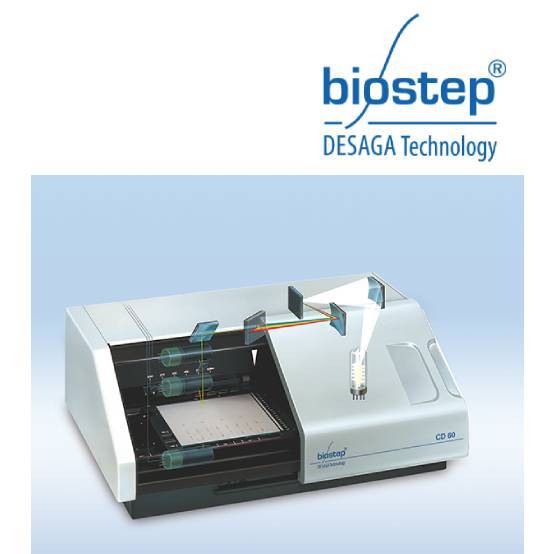
TLC Densitometry of Harpagoside in Harpagophytum procumbens Quantitative Densitometric Evaluation of Harpagoside inthe Secondary Roots of Harpagophytum procumbens D.C. Pascale Poukens-Renwart, Monique Tits, and Luc Angenot Key Words: HPTLC DensitometryHarpagophytum procumbensHarpagoside Devil's Claw Summary Harpagophytum procumbens D.C. (Devil’s Claw) secondary roots areused in Europe as a home remedy for lack of appetite, dyspepticcomplaints, and in supportive therapy for degenerative disorders of thelocomotor system. The main characteristic iridoid glucoside of theplant is harpagoside. An HPTLC method has been developed for the quantitative deter-mination of harpagoside in the secondary roots and extracts of thisplant. The mobile phase used is an optimized version of one describedin the literature; it furnished the most homogenous spots for quan-titative densitometric evaluation (at )= 286 nm, the wavelength ofmaximum absorption of harpagoside). The results have been compared with those obtained after visualizationwith sulfuric acid - vanillin reagent and those obtained using apreviously published HPLC method. To check that separation wascomplete, the spectra of harpagoside obtained from Devil’s Clawextracts before and after visualization were superimposed on those ofharpagoside standard. 1 Introduction Preparations from the secondary lateral roots of Har-pagophytum procumbens D.C. (Pedaliaceae), or Devil’sClaw, an herbaceous plant originating from South Africa,are being marketed in Europe (especially France, Germany,and the UK) as a home remedy for lack of appetite, dyspep-tic complaints, and in supportive therapy for degenerativedisorders of the locomotor system [1-6]. Harpagoside (Figure 1) is the most characteristic iridoidglucoside of the secondary roots of the plant; it is also- ( P. Poukens-Renwart, M. T its, and L . Angenot. D epartment o f Pharmacog- n osy, Institute of Pharmacy, University of Liege, Rue Fus c h 5, B-4 0 00 Liege,Belgium. ) responsible for their bitterness. Views concerning the safetyand efficaciousness of Harpagophytum procumbens in de-generative disorders have generally been based upon folk- Figure 1The structure of harpagoside. lore and testimonials and are supported at best by verylimited scientific evidence. In particular, the mechanisms ofaction of the medicinal properties of Harpagophytum pro-cuntbens are unexplained [4,6]. Some authors regard har-pagoside as a prodrug with potential activity in degenerativedisorders [4] whereas according to other workers [7] har-pagoside could not be implicated in the antiinflammatoryaction of Harpagophyrum procumbens but that an aqueousextract of the plant showed significant dose-dependent anti-inflammatory and analgesic effects (carrageenan-inducedoedema in rats and the abdominal constriction test in mice). For these reasons we have chosen harpagoside as a subjectfor quantitative densitometric evaluation. isis 2 Experimental 2.11Materials 2.1.1 Chemicals and Solvents Harpagoside of HPLC purity (99.1 area%) was purchased fromExtrasynthese (Genay, France).The IR [8, 19] or eventuallydelete the reference 19 (bands characteristic of cinnamoyl estersbetween 1700 and 1500 cme.g. 1693, 1636,1578, and 1497cm) and UV spectra (Amax = 280 nm; E1 cmt% =420) andthe melting point [5] were similar to those described in theliterature. All solvents were of analytical grade and wereused without further purification. Ethyl acetate, acetic acid,dichloromethane, and formic acid were obtained fromMerck (Darmstadt, FRG), butanol from Janssen Chimica(Beerse, Belgium), chloroform from Bios (Leuven, Bel-gium), and ethanol from Belgaco (Brugge, Belgium). 2.1.2 Plant Materials Commercial batches of Harpagophytum secondary rootswere obtained from Tilman (Bomal, Belgium), Pharmaflore(Lessines, Belgium), and Planteurs reunis (Deux Acren, Bel-gium). They were authenticated in the authors' departmentaccording to the description in Herbal Drugs, FrenchPharmacopeia X [9,10] and Swiss Pharmacopeia VII [11] inorder to determine falsification [12] by inclusion of primaryroots (which contain fewer iridoid glucosides), the roots ofScrophularia nodosa (which containing small proportions ofharpagoside and harpagide), or the roots and leaves ofVerbascum thapsus. Batches not in agreement with thesespecifications were excluded from the standardization. 2.2 Preparation of Solutions A standard solution was prepared by dissolving harpagoside(8 mg) in methanol (100 mL) A sample solution was prepared according to Swiss Pharma-copeia [I1], i.e. by extracting Harpagophytum secondaryroots (250 mg) with methanol (25 mL) for 60 min at roomtemperature. After filtration, the powder residue was heatedunder reflux for 60 min and then filtered. The solutions weremixed and evaporated with the temperature not exceeding40℃. The residue was dissolved in methanol (50 mL). Thisextraction method gives better results than those obtainedwith the extraction method of the French Pharmacopeia [9](e.g. 250 mg of secondary roots, as powder,extracted with25 mL methanol for 45 min at 40°℃), whereby completeextraction is not achieved. 2.3 Chromatography TLC was performed on 20 x 10 cm silica gel 60 HPTLCplates (Merck). Aliquots of standard solution (1.2. and3 pL) were applied repeatedly and sample solution (2 pL)was spotted alternately. The samples were applied to theplates as bands by means of a Desaga (Heidelberg. FRG)AS30 TLC applicator. The width of bands was 4 mm, thedistance between the middles of the bands was 9 mm, the step volume was I pL, the rate of application was 20 spL,and the break between applications was 10 s. When the spots were dry separation was performed in asaturated (30 min) chamber (20 × 10 cm twin-trough cham-ber, Camag, Muttenz, Switzerland) at room temperatureusing dichloromethane - methanol (4+1, o/u) as mobilephase. The development distance was 65 mm (developmenttime approximately 20 min). The vanillin- sulfuric acid dipping reagent used for valida-tion of the HPTLC method was prepared by dissolvingvanillin (250 mg) in a mixture of I-propano! (50 mL) andcarbon tetrachloride (50 mL) and cautiously adding 2.5 mLconc. sulfuric acid in portions with stirring and cooling to-15C [13]. The results from HPTLC were compared withthose obtained from the HPLC method described in theSwiss Pharmacopeia [11]. HPLC was performed with a Pharmacia LKB (Bromma,Sweden) liquid chromatograph equipped with a Hewlett-Packard diode array detector (Camas, USA). 2.4 TLC Quantitation The chromatogram was scanned by means of CD60 den-sitometer (Desaga) supplied with user-friendly software re-sident in a personal computer. Scanning was performed inlinear mode using remission-absorbance with an excitationwavelength of 286 nm (deuterium lamp); the slit width was0.4 mm, the slit height was 4 mm, the scanner was operatedin spot optimization mode with the resolution 0.025 mm, thenumber of measurements per position was 16, and the signalfactor was 20. Peak area measurement was used. Except forthe wavelength of 530 nm (tungsten lamp) the same settingswere used for quantitation in the visible region of the spotsformed by application of the vanillin reagent. 3 Results and Discussion 3.11Choice of Chromatographic System Different chromatographic systems previously described fo:the separation of the different iridoid glucosides of Har-pagophytum procumbens D.C. extracts were tested; silica gelHPTLC plates were developed with the mobile phases:water -methano! -ethyl acetate (8+ 15 + 77,u;t) [12].acetic acid- water - butanol (! + 1+ 4,u/D) [9]. ethylacetate- formic acid- glacial acctic acid - water (100 +1I+1! + 26,u/D)[14],chloroform-methanol (90 +30. tt)[15] chloroform - ethano! (2 +1, u/u) [16], and dichloromethane - methanol (8 +2, v/u)171. The first threemobile phases were not able to separate harpagoside fromother components of the extract. The other phases, ofsim-ilar composition, gave better results, and the last gave themost homogenous spots for TLC quantitation. Comparison of the spectrum (Figure 2) of a standard solu-tion of harpagoside with those of extracts of Devil’s Clawshowed that they could be superimposed. The results ob- tained by this method were similar to those obtained fromthe HPLC methods described by the VIIth Swiss Pharmaco-peia and the project of the monograph described in Phar- employed for routine use because mobile phase consump-tion is low. This technique can thus complete usefully - oreven replace- the HPLC method of the pharmacopeia 236 an 286 n 11 530 n8530 An 11 Figure 2 Figure 3 Comparison of the UV spectra obtained after separation with the mobilephase described in reference 17: (1) standard harpagoside; (I) har-pagoside in the extract. comparison of the visible spectra of (l) standard harpagoside and (ll)harpagoside in the extract obtained after separation with the mobile phasedescribed in reference 17 and visualization with sulfuric acid vanillinreagent. Tabfe 1Summary of results obtained from validation investigations. meuropa [18]. Visualization of harpagoside with the vanillinsulfuric acid reagent of the Xth French Pharmacopeia, gives,moreover,violet spots having the same absorption maxim-um () = 538 nm) as that obtained from standard har-pagoside and that from the compound present in the extractseparated in this work (Figure 3). The shoulders between 410and 460 nm probably arise from impurities in the samplesolution; they have no influence, however, at 1= 538 nm,the wavelength chosen for the quantitation. 3.2 Validation Data Parameter UV detection Visible detection Quantitative wavelength 286 nm 530 nm Minimum detectable 0.03 0.07 concentration [pg] Regression equation y=2101.7x+35.92 :=4480.9x+145.44 Linear range [ng] 0.075-0.23 0.075-0.23 Correlation coefficient (r) 0.9952 0.9573 Within day reproducibility 1.340; a= 0.01613 4.68;c=0.0569 [%](n=8) Between day reproducibitity2.14;a=0.02582 6.02;a=0.0734 [%}(n=12) When dichloromethane -methanol was used as the mobilephase for HPTLC, the calibration plot of peak area ()=286 nm) against amount of harpagoside showed good linear-ity for quantities between 0.075 and 0.23 ug (n = 15). Thecalibration data summarized in Table 1 show that UV quan-tification gives better results because there was no inter-ference from the colored background. The results obtainedfor commercial batches were compared with those obtainedusing the HPLC method described in the Swiss Pharmaco-peia [11]; this confirmed the accuracy of the method (Table2). The HPTLC method is rapid; it can also be readilymonitored because the whole chromatogram can be viewedat a glance and it is not necessary to elute the individualcomponents. The method can, moreover, be economically Table 2 Amount of harpagoside [%] in commercial batches of Har-pagophytum procumbens as determined by HPTLC and HPLC. HPTLC HPLC Batch l 1.09 1.12 Batch 2 1.20 1.18 Batch 3 1.25 1.25 Batch 4 1.52 1.50 Batch 5 1.53 1.50 Batch 6 1.56 1.58 -i:twr. 39 学少i 网 The minimum detectable quantity at )=286 nm was 0.03ug. After visualization with vanillin, 0.07 pg of harpagosidecould be detected. 3.3AAmount of Harpagoside in the Harpagophytum Sam-ples Studied The harpagoside content of batches of Devil’s Claw rangedfrom 1.09 to 1.56% (Table 2). These results confirm thestipulations of both the Swiss Pharmacopeia and Phar-meuropa that 1.2% harpagoside is a suitable minimum levelfor standardization of Harpagophytum procumbens D.C.secondary roots. 4 Conclusion An HPTLC procedure has been developed which should, inthe future, find successful application for quantification ofharpagoside in Harpagophytum procumbens D.C. secondaryroots and extracts. The amounts of harpagoside found in five commercialbatches of Devil's Claw corroborated the minimum valuestipulated by the Swiss Pharmacopeia monograph on Har-pagophytum procumbens D.C. The standardization of commercial batches should be basedon these specifications. Acknowledgments This work was supported by the FNRS (National Fund for Scientif-ic Research of Belgium). References ( [1] M. W ichtl, Teedrogen, Wi s senschaftliche VerlagsgesellschaftmbH, S t uttgart (1989) 495-497. ) ( [2] I. Esdorn, Dtsch. Apoth. Z tg. 104 ( 1 963) 7 8 5-789. ) ( [3] S. Ragusa, C. Circosta, E.M.Galati,and G. Tumino, J. Ethno-pharmacol. 11 (1984) 245 - 257. ) ( [4] M. V anhaelen, R . Vanhaelen-Fastre, J. Famaey-Fontaine,Elchamid, P. Niebes , and D. Matagne,Phytotherapy 5 (1987 -1 3. ) ( {5] P. Tunmann and R. L u x, Dtsch. Apoth. Ztg. 102 (1 9 6 1274-1275. ) ( [6} N.G. Bissel , Herba l Drugs and Phytopharmaceuticals, Me p harm Scientific P u blishers, S t uttgart ( 1 994) 248-25 0. ) ( [7] M.C. L anhers, J. Fleurentin, F . M ortier. A . Vincke, andYounos, Planta Med. 58 (1992) 117-123. ) ( [8] H. Lichti and A . con W artburg, Tetrahedron Le t t. 15 (1 9 6835-843. ) ( [9] Pharmacopee F rancaise X e e d ition, Ministere de l a S an:Paris (1989-1992). ) ( [10] M. H aag-Berrurier, B. Kuballa, and R . A n ton, Plantes MePhytother. 1 2 ( 1978) 197-206. ) ( [1 1 ] Pharmacopee Helvetique VHe edition, D epartement federalPinterieur, Berne ( 1993). ) ( [12] M. Vanhaelen, J . P h arm. Be l g. 41 (1 9 86) 172-182. ) ( [13] H. Jork, W. Funk, W . Fisher, and H . Wimmer, Th i n La y Chromatography R e agents a n d D e tection Method, V o l. iVCH, Weinheim (1994) 447. ) ( [14] H.Wagner,S. Bladt, and E.M. Z gainski, Plant Drug AnalySpringer, B erlin ( 1984). ) ( [15] F. Czygan, A. Kruger, W. Schier. and O. Volk, Dtsch. ApsZtg. 117 (1977) 1431-1434. ) ( [16] V . Kwasniewski and E. Konigslutter, Dt s ch. Ap o th. Ztg . (1978)49-50. ) ( [17] P. Pachaly , Dunnschichtchromatographie in de r ApothWissenschaftliche Verlagsgesellschaf t mbH, S tuttgart (19164 ) ( [18] PharmeuropaC o nseil de PEurope, Strasbourg,6 ( 1994)244. ) ( [19] H. Lichti and A. uon Warburg, Helv. Chim. Acta 4 9 ( J 1552-1580. ) ( Ms received: September 2 8, . . Accepted by SN: March 20. ) OL. . MAY/JUNE OL. , MAYIJUNE Journal of Planar Chromatography 简介南非钩麻的次生根在欧洲被用作治疗厌食症、消化不良的家庭急救药,同时被纳入自发退行性疾病的辅助治疗体系。这种植物的特征性环烯醚萜苷是钩果草甙。我们发展了一种高效薄层色谱技术(HPTLC)对这种植物的提取物和次生根中的钩果草甙进行定量检测。使用的流动相为文献中描述过的一种优化形式,能提供光密度最均匀的定量点(在286nm波长下钩果草甙有最大吸收)。我们比较了用文献发表过的HPLC技术和用硫酸-香兰醛显谱后获得的结果。为了检测分离是否完全,我们将南非钩麻提取物中获得的钩果草甙在显谱前后的谱图与钩果草甙标准品的对应谱图进行了叠加。
关闭-
1/4
-
2/4
还剩2页未读,是否继续阅读?
继续免费阅读全文产品配置单
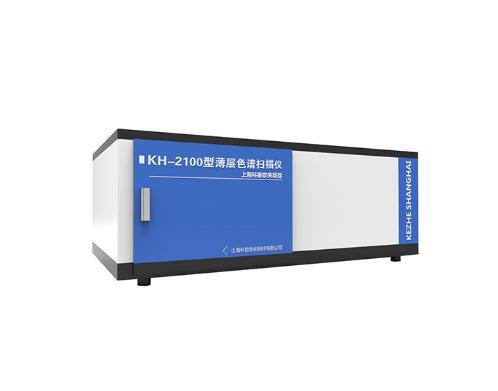
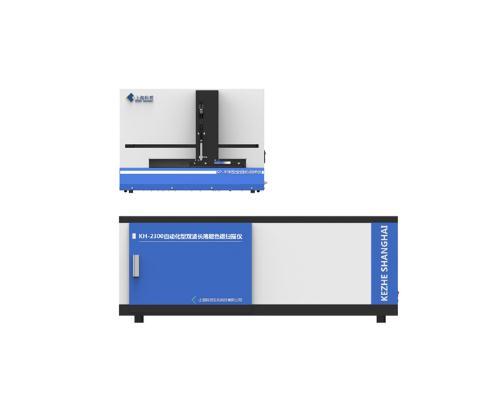
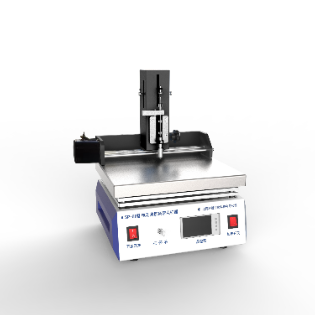
大昌华嘉科学仪器为您提供《南非钩麻次生根中钩果草甙浓度检测方案(薄层色谱仪)》,该方案主要用于中药材和饮片中含量测定检测,参考标准《暂无》,《南非钩麻次生根中钩果草甙浓度检测方案(薄层色谱仪)》用到的仪器有薄层色谱仪(自动点样仪)、薄层色谱扫描仪(薄层色谱成像)。
我要纠错
推荐专场
相关方案
 咨询
咨询