

方案详情文
智能文字提取功能测试中
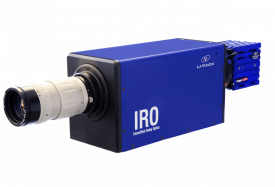
Research ArticleVol. 26, No. 8|16 Apr 2018|OPTICS EXPRESS 10266Optics EXPRESS Research Article #318346Journal C2018https://doi.org/10.1364/OE.26.010266Received 26 Dec 2017; revised 22 Mar 2018; accepted 22 Mar 2018; published 9 Apr 2018 Application of toluene LIF to transonic nozzleflows to identify zones of incompletemolecular mixing MATTHIAS BEUTING,1,* JUDITH RICHTER,? BERNHARD WEIGAND,2 THOMASDREIER,1 AND CHRISTOF SCHULz Institute for Combustion and Gas Dynamics - Reactive Fluids (IVG) and CENIDE; Center forNanointegration Duisburg-Essen, University ofDuisburg-Essen, GermanyInstitute of Aerospace Thermodynamics (ITLR), University of Stuttgart, Germany *matthias.beuting@uni-due.de Abstract: Toluene laser-induced fluorescence (LIF) has been applied to image the mixingdeficit on the molecular level in the transonic wake of two different blunt-body injectors in acompressible accelerated nozzle flow. A single-color excitation and two-color detectionscheme is employed to measure the signal red-shift caused by the quenching effect ofmolecular oxygen on the fluorescence of toluene, which reduces and red-shifts the LIF signalif both substances interact on a molecular level. To this end, toluene is injected alternatinglywith O2-contaning and O2-free carrier gas into the air main flow. Differences of both signalsmark regions where mixing on molecular level is incomplete. A zone of molecular mixingdeficit extending several millimeters in stream-wise direction is identified. The effect of localvariations in temperature on the sensitivity of this technique is discussed using photo-physicaldata measured in a stationary low-temperature cell. ◎ 2018 Optical Society of America under the terms of the OSA Open Access Publishing Agreement OCIS codes: (300.2530) Fluorescence, laser-induced; (280.7060) Turbulence; (280.1740) Combustion diagnostics. References and links 1. A. Grzona, A. WeiB, H. Olivier, T. Gawehn, A. Gilhan, N. Al-Hasan, G. H. Schnerr, A. Abdali, M.Luong,H.Wiggers, C. Schulz,J. Chun, B. Weigand, T. Winnemoller, W. Schroder, T. Rakel, K. Schaber,V. Goertz, H.Nirschl, A. Maisels, W. Leibold, and M. Dannehl,“Gas-phase synthesis of non-agglomerated nanoparticles byfast gasdynamic heating and cooling," (Springer Berlin Heidelberg, 2009), pp. 857-862. 2. A. Wohler, K. Mohri, C. Schulz, and B. Weigand,“Flow structures in subsonic-to-supersonic mixing processesusing different injector geometries,"in 4th European Conference for Aerospace Sciences (EUCASS, 2011).P. E. Dimotakis,“Turbulent Mixing,"Annu.Rev. Fluid Mech. 37(1),329-356(2005). 34C. Schulz and V. Sick,“Tracer-LIF diagnostics: Quantitative measurement of fuel concentration, temperatureand air/fuel ratio in practical combustion systems,” Pror. Energy Combust. Sci.31(1),75-121(2005). 5. N. T. Clemens and P. H. Paul, “Scalar measurements in compressible axisymmetric mixing layers,”Phys. Fluids7(5),1071-1081(1995). 6. G. F. King, J. C.Dutton, and R. P. Lucht, “Instantaneous, quantitative measurements of molecular mixing in theaxisymmetricjet near field,"Phys. Fluids 11(2), 403-416 (1999). 7. W. Koban, J. Schorr, and C. Schulz,“Oxygen-distribution imaging with a novel two-tracer laser-inducedfluorescence technique,"Appl. Phys. B-Lasers O 74(1), 111-114(2002). 8. W. Koban and C. Schulz, “Toluene laser-induced fluorescence (LIF) under engine-telated pressures,temperatures and oxygen mole fractions," SAE Technical Paper (2005). 9. K. Mohri, M. Luong, G. Vanhove, T. Dreier, and C. Schulz, “Imaging of the oxygen distribution in anisothermal turbulent free jet using two-color toluene LIF imaging,”Appl. Phys. B-Lasers O 103(3), 707-715(2011). 10. W. Koban, J. D. Koch, R. K. Hanson, and C. Schulz,“Oxygen quenching of toluene fluorescence at elevatedtemperatures,”Appl. Phys. B-Lasers O 80(6), 777-784 (2005). ( 1 1 . W.K o ban,J. D. Koch, R. K. Hanson, an d C. Sc h ulz, “Toluene LI F at elevated temperatures: implications f or f uel-air rati o measurements,"Appl. Phys. B-Lasers O 80(2),147-150 (2005). ) ( 12. M. Gamba, V. A. Miller, M. G. Mungal, and R . K. Hanson,“Temperature and number density measurement in n on-uniform supersonic flowfields undergoing mi x ing using toluene PLIF thermometry,”Appl. Phys. B-Las e rs O 120(2),285-304(2015). ) ( 13. A. Wohler, B. Weigand, K . Mohri, and C. Schulz, “ Mixing processes in a compressible accelerated nozzle flowwith blunt-body wakes,”AIAA J. 52(3),559-568 (2014). ) 14. S. Faust, T. Dreier, and C. Schulz,“Photo-physical properties of anisole: temperature, pressure, and bath gascomposition dependence of fluorescence spectra and lifetimes,"Appl. Phys. B 112(2),203-213(2013). 15. S. Faust, G. Tea, T. Dreier, and C. Schulz,“Temperature, pressure, and bath gas composition dependence offluorescence spectra and fluorescence lifetimes of toluene and naphthalene,”Appl. Phys. B-Lasers O 110(1),81-93 (2013). 16. M. Luong, W. Koban, and C. Schulz, “Novel strategies for imaging temperature distribution using Toluene LIF,”J. Phys. Conf. Ser. 45, 133-139 (2006). 17. T. Benzler, S. Faust, T. Dreier, and C. Schulz,“Low-pressure effective fluorescence lifetimes and photophysicalrate constants of one- and two-ring aromatics,”Appl. Phys. B 121(4), 549-558 (2015). 18. J. Richter, J. Mayer, and B. Weigand,“Accuracy of non-resonant laser-induced thermal acoustics (LITA) in aconvergent-divergent nozzle flow," Appl. Phys. B-Lasers O, in press (2018). 19. I. Wygnanski, F. Champagne, and B. Marasli, “On the Large-Scale Structures in Two-Dimensional, Small-Deficit, Turbulent Wakes,"J. Fluid Mech. 168(-1), 31-71 (1986). 20. M.Matsumoto,“Vortex shedding of bluff bodies: A review,"J. Fluids Structures 13(7-8), 791-811(1999). 21. F. Motallebi and J. F. Norbury, “The effect of base bleed on vortex shedding and base pressure in compressibleflow,"J. Fluid Mech. 110(-1), 273-292(2006). 22. J.B. Birks, C. L. Braga, and M. D. Lumb,“Excimer’Fluorescence. VI. Benzene, Toluene, p-Xylene andMesitylene,Proc. Royal Soc. London Series A 283(1392), 83-99 (1965). 1. Introduction Efficient and fast mixing on the molecular level is essential to enable supersonic combustionand reactions in shock-wave flow reactors [1]. Practical realizations often feature centralinjectors that add a low-momentum feed of one reactant into a high-momentum sub-orsupersonic flow containing the other [1, 2]. The fundamental understanding of mixingprocesses in such wake flows has been subject to fundamental research for several decades[3]. Planar laser-induced fluorescence (LIF) of organic tracers [4] has proven particularlyuseful for visualizing instantaneous species distributions in high-speed gas flows due to itshigh time resolution. The spatial resolution of the optical detectors and the light-sheetthickness, however, restrict direct measurements to macroscopic structures. These aretypically orders of magnitude larger than the length scales relevant for the molecularinteraction of reactants. Several approaches to measure the level of molecular mixing havebeen proposed. They are based on the photo-physical sensitivity of the laser-excited specieson collisions with constituents of the admixed gas, e.g., by fluorescence quenching: Clemenset al. [5] introduced an approach that exploits the quenching of nitric oxide (NO) fluorescenceby O2. They identified the level of molecular mixing in the shear layer of a coaxial jet of N2 inair by alternatingly adding NO to each flow. King et al. [6] proposed a two-tracer approach.They marked the air flow with acetone, a ketone tracer insensitive to quenching by O2, andthe second O2-free flow with NO. This method requires tracers with spectrally-separablefluorescence and, in this case, excitation at two separate wavelengths. Koban et al. [7]simplified this approach by substituting the Oz-sensitive NO with toluene, and acetone with 3-pentanone. The LIF signal intensity of aromatics like toluene strongly depends on the O2partial pressure [8] and is spectrally well-separated from that of 3-pentanone, while both canbe excited with the same UV laser. Further simplification was introduced by Mohri et al.[9]who used toluene as single tracer and exploited the O2-induced red-shift [10] of the LIF signalto detect micro-mixing indirectly by measuring the local O2 distribution. The red shift wasquantified by using two cameras equipped with filters for two separate portions of thefluorescence spectrum. Knowledge about the status of molecular mixing is also relevant from a diagnostics pointof view. The determination of flow composition and temperature using O2-sensitive tracersdepends on the local (molecularly mixed) O2 partial pressure [11, 12]. A quantitative analysisof LIF signals in areas of incomplete mixing requires accurate measurement of the level ofmolecular mixing (and ultimately, additional photo-physical data for the dependence of theLIF signal as a combined effect of mixing state and temperature). Research Article Vol.26, No.8|16Apr 2018|OPTICS EXPRESS 10268 Optics EXPRESS This work demonstrates the application of single-color excitation, two-color detectiontoluene LIF, similar to Ref [9], to a transonic accelerated nozzle flow [13] to qualitativelyidentify zones of deficient molecular mixing in the wake of two different central injectors. 2. Theory The LIF signal emitted by organic tracers after electronic excitation by a laser pulse dependson the incident laser intensity llaser, the detection efficiency n, the tracer number density ntracer,the absorption cross-section o(A,T), and the integrated fluorescence quantum yield (a,T,po2)(Eq. (1). The absorption cross-section depends on the excitation wavelength A and thetemperature T, and the quantum yield additionally depends on the O2 partial pressure po. O2-induced quenching has been studied for various aromatics like toluene [10], anisole [14],and naphthalene [15]. Besides reducing o by decreasing the fluorescence lifetime, O2 alsocauses a red-shift of the LIF emission for certain excitation wavelengths [10] similarly to theeffect caused by increasing temperature [16]. This red-shift can be sensed by measuring theratio R of the short-and long-wavelength section of the fluorescence spectrum using twodetectors equipped with either a“red”or a“blue”filter (Eq. (2)). The ratio is independent ofthe incident laser intensity, the local tracer concentration, and the absorption cross-section. Because quenching requires molecular collisions between O2 and the tracer, R depends on themixing state of tracer and quencher on the molecular level. Figure 1 shows normalizedtoluene-LIF spectra for various po at room temperature [10] and the derived signal ratio R forthe filter pair used in this work. Fig. 1. (a) Toluene-LIF spectra at room temperature in N2 for a series of O2 partial pressuresafter excitation with 248 nm [10] and transmission curves of filters used in the presentexperiments. (b) Intensity ratios R (black symbols and line) and sensitivity (red line) of thetwo-color method. In areas where molecular mixing has not happened, R is independent of po2 becausecollisions with O2 do not occur. These areas can be identified by comparing twomeasurements where toluene is used either with air or with N2 as carrier gas injected into atoluene-free air flow. R, however, also depends on temperature. Therefore, Rair (measuredwith air as carrier gas,i.e. mixing with the air main flow does not change the local po2) isdivided by RN2 (obtained from measurements with N2 as carrier gas). The resulting quotient=Rair/Rn2 then only represents the O2-induced red-shift and, thus, marks the areas wheremolecular mixing is incomplete. When calculating the ratio, the detection system efficiencysuch as the angle-dependent filter transmission cancels. Also, the effect of T cancels, as longas it can be considered identical for both measurements, Rair and RN2. Research Article Vol. 26, No.8|16 Apr 2018|OPTICS EXPRESS 10269 Optics EXPRESS To help understand the meaning oft, toluene-LIF spectra were measured between 264and 295 K (cf. Fig. 4) for po2 between 0 and 210 mbar in a stationary cell after excitation with248-nm laser light generated from an EXPLA PL 2413 picosecond laser in combination withan EXPLA PL 401 parametric generator. A Horiba iHR320 Spectrometer was used to capturethe toluene fluorescence [17]. The measured spectral data was used to calculate the quotientfor the filter pair used. The results are shown in Fig. 2, where unity indicates full molecularmixing and a value of 3 absence of mixing. The figure also shows the error in caused byvarying the temperature by 30 K within the relevant (low-temperature) range of ourexperiment, which is below ~7%. A more complete analysis of the low-temperaturephotophysics of toluene is underway. In the context of this paper, where the aim is toqualitatively locate areas with deficient molecular mixing, this detailed analysis is notrequired. Fig. 2. Oxygen-dependence of for the used filter pair calculated from LIF spectra obtained ina temperature-controlled static cell at atmospheric total pressure for different temperatures Twithin the range relevant for this paper. 3. Experiment The experiments were performed at the supersonic test facility in Stuttgart. 517 g/spressurized air was provided at a total temperature of 380 K to a modular transonic flowchannel with a rectangular cross-section and a constant width of 40 mm (see Ref [18]. fordetails). The channel comprises a convergent-divergent nozzle (26.3 mm throat height)designed for an exit Mach number of 1.7. Optical access is provided laterally through fusedsilica windows and orthogonally through so-called laser slot windows whose inside polishedsurfaces follow the shape of the nozzle. Figure 3(a) shows the dimensions of the nozzle andthe positions of the central injectors. The wake flows of two injectors that extend over thewhole channel width as shown in Fig. 3(b) were analyzed: A ‘subsonic’(Inj A) and asupersonic’(Inj B) injector providing injection either prior or after the nozzle throat,respectively. Both injectors deliver the tracer through four 2.5-mm diameter holes spaced by4.8 mm. In case of injector B, the nozzle throat is narrowed by the height of the injectortrailing edge and, thus, the exit Mach number increases to 2.0. A constant main mass flow isensured by setting the total pressure at the flow channel entry to 2.5 bar for injector A and 3.0bar for injector B. The wake forming downstream of the injectors is dominated by periodicflow structures. These have been investigated in the wake of bluff bodies [19, 20] in the past.The size, the extent, and the frequency of these structures mainly depend on the free-streamMach number (sub- or supersonic flow, compressibility effects) [21]. The detailed wake flowphysics is not the topic of this paper; however, its periodic character is important to betterunderstand the results. Research Article Vol.26,No.8|16 Apr 2018|OPTICS EXPRESS 10270 Optics EXPRESS Fig. 3. (a) Cross-section of the nozzle module and (b) dimensions of the two injector types InjA and Inj B. Both injectors extend in z-direction to the full channel width of 40 mm. Figure 4 shows free-stream Mach numbers and resulting temperatures downstream of theinjectors calculated from the nozzle shape assuming isentropic flow conditions. In the case ofinjector A, the main flow Mach number increases from 0.26 to 1.71 throughout the nozzle andthe mean temperature drops from 375 to 240 K, which is confirmed by measurements withlaser-induced thermal acoustics in the nozzle without injector under the same main flowconditions [18]. For injector B, no experimental data are available yet. The isentropic flowequations, however, indicate that the main flow Mach number and temperature at the point ofinjection are approximately 1.42 and 270 K. While the flow is accelerated to Ma ~2.0 to thenozzle exit, the temperature drops to ~213 K. Fig. 4. Adiabatic temperature distribution calculated from 1D adiabatic relations with respectto changes of the cross-section in stream-wise direction. An evaporator system (Brooks DLI) provides the injector flow of 0.30 g/s toluene eitherin 0.45 g/s air or N2 corresponding to 0.14 wt.% of the main flow. The injector flow is heatedto 380 K matching the main flow total temperature. Even though these conditions may lead tosupersaturation assuming a worst-case scenario where the injector flow remains unmixedwhile being in thermal equilibrium with the main flow, unwanted condensation could beexcluded. This was evidenced by monitoring the signal ratio of the red and blue channel atdifferent positions throughout the flow channel while varying only the toluene concentrationto the evaporator’s maximum. Subpixel-sized droplets should induce a signal red-shift, sinceexcimers forming in liquid toluene are known to fluoresce at 320 nm [22]. The absence ofsuch a signal indicates that the local concentration is low enough or that the residence time isinsufficient for nucleation. The optical setup is sketched in Fig. 5(a). A rectangular beam provided by a 248-nm KrFexcimer laser (8 Hz, 20 ns pulses) is formed by a f=500 mm cylindrical lens to a 0.3 mm thinand 24 mm wide light sheet that is directed through the laser windows in the measurementsection by a mirror below the channel as shown in Figs. 5(b) and 5(c). The light sheet ispositioned in the center of the channel illuminating the flow between the second and thirdinjector hole (cf. Fig. 3). In the case of injector A, the laser light passes an additionalcylindrical lens (f=-40 mm) to expand the light sheet over the complete observable area Research Article Vol.26, No. 8| 16 Apr 2018|OPTICS EXPRESS 10271 behind the central injector (Fig. 5(b)). The laser fluence is attenuated to ~70 mJ/cm²beforeentering the channel to ensure linear signal response. An energy monitor records pulse-to-pulse energy fluctuations. A dichroic beam splitter (Semrock Brightline FF 310) divides theLIF signal into a blue and a red channel. The blue channel is further equipped with a bandpassfilter (Semrock Brightline BP 280) while an additional long-pass filter is used on the redchannel to suppress scattered laser light (cf. Fig. 1(a)). Two ICCD cameras (LaVision imagerintense, IRO) capture the signal. All optical equipment is mounted on a three-axis translatableoptical table. Fig. 5. (a) Optical setup and light sheet positions within the nozzle with (b) injector A and (c)injector B. 4. Results Two-color ratioing methods require image mapping after geometric adjustment of thecameras. Since the channel shifted during the experiments due to thermal expansion,additional spatial calibration was needed: A transparent backlit target was placed on thecamera-facing observation window and the optical table was moved away from the flowchannel by the distance of the target to the light sheet position. The LaVision DaVis softwarewas used to generate a mapping function with a residual error of ~0.8 pixels. To account forthe deflections caused by the window, the correlation between 200 pairs of LIF images wascalculated and maximized iteratively after applying the mapping function. To assess the degree of molecular mixing the ratio R of the red and the blue channel,representing the signal red-shift, is calculated according to Eq.(3) for each laser pulse. Thesignals of both channels S are corrected for pulse-to-pulse intensity variations and forbackground signal by subtracting averaged (200 pulse) background images (BG). For comparison of the case of homogeneous O2 concentration to the O2-free case, averagedratios (Rair) and (Rn2) are calculated from 1000 single ratios each. The results are plotted inFigs. 6(a)-6(d). In all cases, only regions where both channels provided sufficient signal (i.e.> 20 counts/pixel) are considered. Figures 6(e) and 6(f) show the standard deviation of Rrelated to its average value to indicate the temporal fluctuation, where the upper half of eachfigure refers to Rair and the lower half to RN2. A measure for concentration fluctuations isprovided by the relative standard deviation of the signal intensity. This is shown in Figs. 6(g)and 6(h) for the red channel (less sensitive to signal red-shift as the blue channel) for injection Research Article Vol.26,No. 8|16 Apr 2018|OPTICS EXPRESS 10272 with homogeneous O2 concentration. The area of strong fluctuations in the wake of injector Aresults from the periodic character typical for subsonic wakes that involve large coherent flowstructures. In the case of injector B, the length and time scales of those structures are smallerand, thus, the fluctuations are less. Fig. 6. Signal red-shift in the wake of injectors A and B after using alternatingly (a)-(b) air(homogeneous O2 concentration) and (c)-(d) N2 as carrier gas of the tracer flow, respectively.The surrounding flow is air in both cases, the grey boxes indicate the injector trailing edgeposition.(e)-(f) show the standard deviation of R and (g)-(h) show the standard deviation of S,each divided by the respective average value. Regions without sufficient signal (less than 20counts/pixel in either LIF signal channel) were masked in all images S prior to the ratioingoperations. The quotient ( of both averaged ratios as defined in Eq. (4) is shown in Fig. 7. Thisrepresents a measure of the degree of incomplete molecular mixing indicated by values above1. Fig. 7. Averaged quotient ias a measure for the Oz-induced red-shift and, thus, incompletemolecular mixing for (a)injector A and (b) injector B. To determine the extent of this zone in stream-wise direction, as relevant for technicalprocesses requiring molecular mixed reactants at a certain point after injection [1], centerline(y=0 mm) profiles of R and i are extracted as shown in Fig. 8. For both injectors, the red-shift near the trailing edge is considerably stronger if O2 is present in the injected flow (bluelines) compared to the case with N2 (red lines) as carrier gas. This zone extends to about 7 Research Article Vol.26, No. 8| 16 Apr 2018|OPTICS EXPRESS 10273 Optics ExPRESS mm past the trailing edge of injector A and 16 mm past injector B. Further downstream ofthat zone, the signal ratio is nearly independent of the injector flow composition while stilldecreasing. This reduction can be attributed to the blue-shift of the LIF signal due to gas-dynamic cooling (cf. Fig. 4). In the wake of both injector types, increases before it drops again further downstream.This can be traced back to the light sheet position that is aligned in between the two centerinjection holes (cf. Figs. 3(b), 5(b), and 5(c) for details). In the very vicinity of the trailingedge the leftmost portion of the image only represents the recirculated mixture, while 3D-flow effects further downstream entrain unmixed injector flow into the image plane. Inaddition, in the case of injector B, two droplets (approx. 2 mm in diameter) form on eachside-window inner surface about 2 mm behind the injector trailing edge. Both are visible inFigs. 6(b), 6(d), and 7(b) and cause a sudden drop followed by an increase of the signalaround x=12 mm in Fig. 8(b). The droplets can be observed at various conditions by nakedeye even without tracer flow. Thus, we suspect residual water in the main flow to condensatedue to rapidly changing conditions in the recirculation zone at the trailing edge of injector B. Fig. 8. Profiles (extracted from Figs. 6(a)-6(d) and Fig. 7) of the O2-induced fluorescence red-shift represented by the quotient i(bottom) calculated from the averaged signal ratios R ofboth channels (top) for (a) injector A and (b) injector B along the centerline (y=0 mm). Thegrey bands represent the standard deviation of ten 100-shot averages. 5.Conclusions and Outlook A single-color excitation and dual-band detection tracer LIF technique has successfully beenapplied to monitor the mixing deficit on molecular level in a transonic nozzle flow. Thewakes of two central injectors feeding a low-momentum jet into an accelerating air flow wereanalyzed showing that the extend of the zone with apparent incomplete mixing depends onthe point of injection: In the case of the injection into a supersonic (Ma= 1.42) main flow, itextends with approximately 16 mm more than twice the distance in stream-wise directioncompared to the injection in a subsonic flow (Ma =0.26) with 7 mm. The results presentedhere are of qualitative nature. For quantification, detailed photo-physical data for thecomplete range of conditions in the flow channel are required, which are subject to ongoingwork in our lab. Further, complementary measurement techniques are required to measureand to correct for temperature and pressure effects accordingly. Funding The authors gratefully acknowledge funding by the German Research Foundation DFG(SCHU 1369/21-1 and WE 2549/31-1). Acknowledgments The authors thankkThomas; IBaranowski for hisS 1assistance inn measuring additionalfluorescence spectra during the review process. Toluene laser-induced fluorescence (LIF) has been applied to image the mixing deficit on the molecular level in the transonic wake of two different blunt-body injectors in a compressible accelerated nozzle flow. A single-color excitation and two-color detection scheme is employed to measure the signal red-shift caused by the quenching effect of molecular oxygen on the fluorescence of toluene, which reduces and red-shifts the LIF signal if both substances interact on a molecular level. To this end, toluene is injected alternatingly with O2-contaning and O2-free carrier gas into the air main flow. Differences of both signals mark regions where mixing on molecular level is incomplete. A zone of molecular mixing deficit extending several millimeters in stream-wise direction is identified. The effect of local variations in temperature on the sensitivity of this technique is discussed using photo-physical data measured in a stationary low-temperature cell.
关闭-
1/8

-
2/8
还剩6页未读,是否继续阅读?
继续免费阅读全文产品配置单


北京欧兰科技发展有限公司为您提供《跨音速喷嘴中甲苯示踪激光诱导荧光(PLIF)检测方案(CCD相机)》,该方案主要用于其他中甲苯示踪激光诱导荧光(PLIF)检测,参考标准《暂无》,《跨音速喷嘴中甲苯示踪激光诱导荧光(PLIF)检测方案(CCD相机)》用到的仪器有LaVision IRO 图像增强器、PLIF平面激光诱导荧光火焰燃烧检测系统、德国LaVision PIV/PLIF粒子成像测速场仪、PL2140 系列皮秒锁模Nd:YAG 激光器、LaVision DaVis 智能成像软件平台。
我要纠错
推荐专场
CCD相机/影像CCD
更多


相关方案
 咨询
咨询