

方案详情文
智能文字提取功能测试中
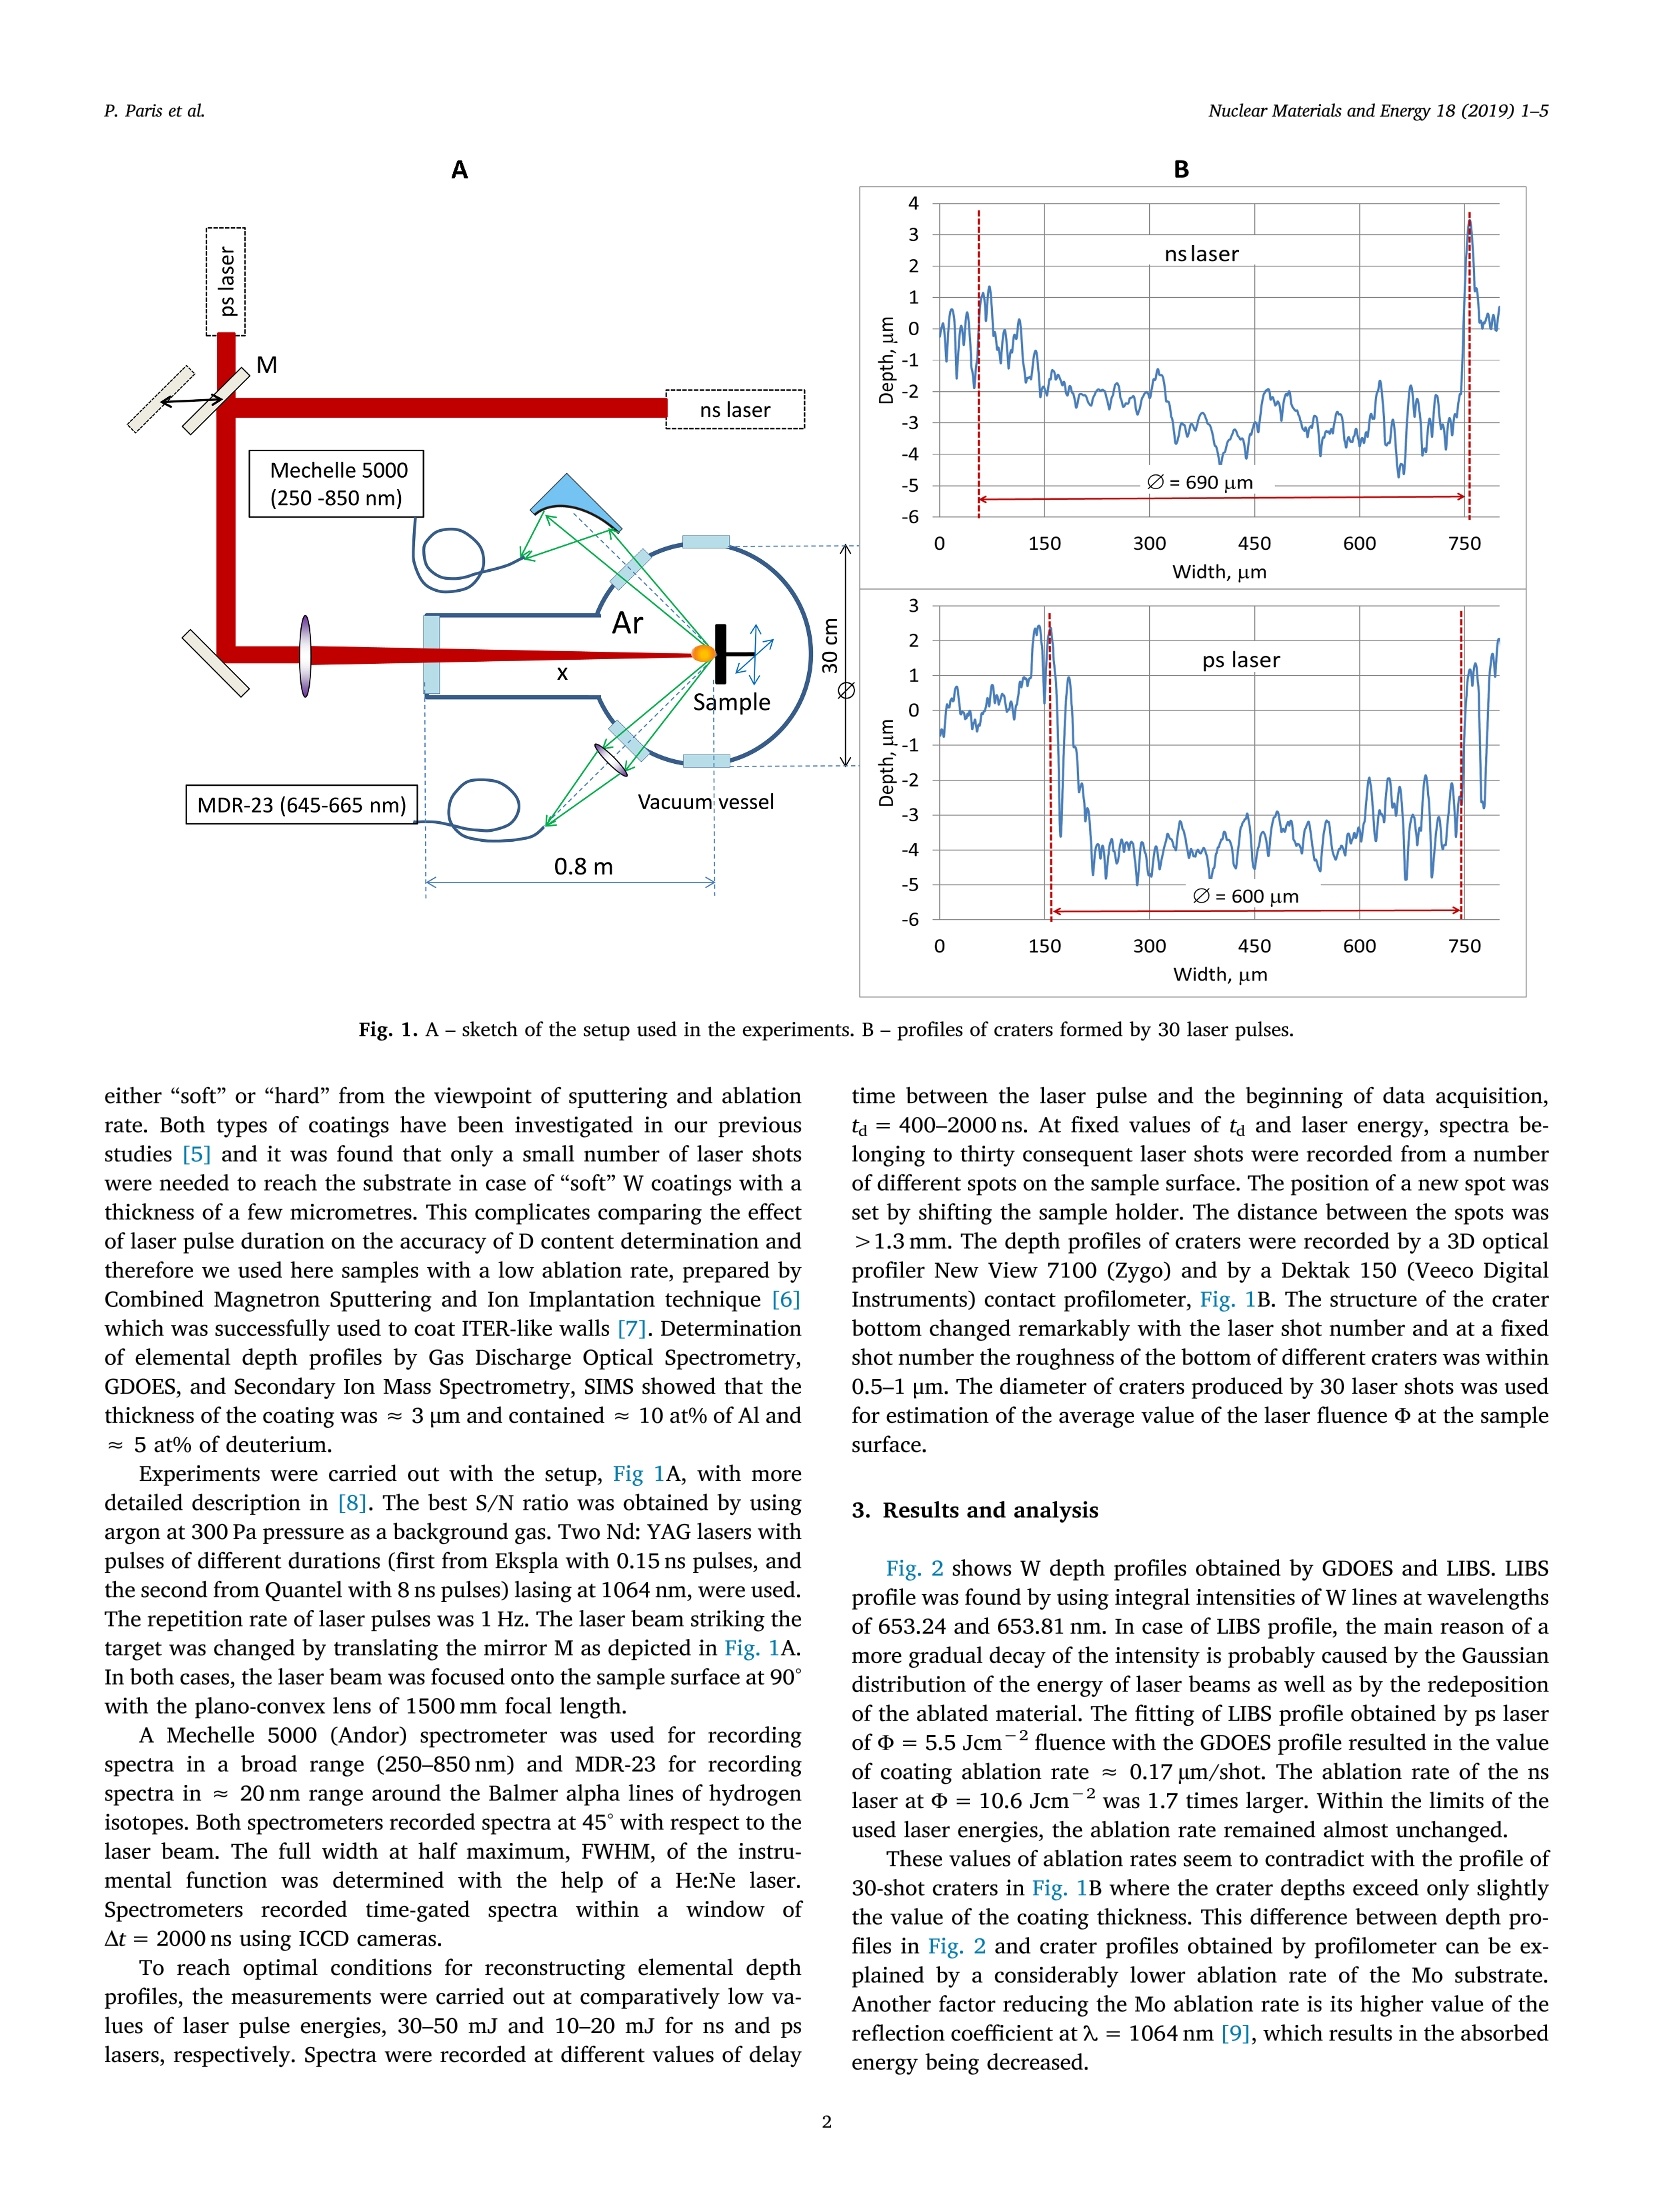
Nuclear Materials and Energy 18 (2019)1-5Contents lists available at ScienceDirect Nuclear Materials and Energy 18 (2019) 1-5P. Paris et al. Nuclear Materials and Energy journal homepage: www.elsevier.com/locate/nme Comparison of LIBS results on ITER-relevant samples obtained bynanosecond and picosecond lasers P. Paris, J. Butikova, M. Laan, A. Hakola , I. Jogi , J. Likonen, E. Grigore, C. Ruset" “Institute of Physics, University of Tartu, Tartu 50411, Estonia Institute of Solid State Physics, University of Latvia, Riga LV-1063, Latvia VTT Technical Research Centre of Finland Ltd., 02044 VTT, Finland “National Institute for Lasers, Plasma and Radiation Physics, Bucharest 077125, Romania ARTICLEINF O ABSTRACT Keywords:ITER-relevant coatingsLIBS diagnosticsDetection of hydrogen isotopesElemental depth profilesTemperature of laser-produced plasma ITER foresees applying laser induced breakdown spectroscopy (LIBS) as a tool for quantitative assessment of fuelretention in the first walls. One open problem related to LIBS application is the choice of the laser type. Here wecompare two Nd/YAG lasers with different pulse durations, 0.15 and 8 ns, working at 入=1064 nm for LIBS studiesof samples with D-doped W/Al coatings of ≈3 um thickness (Al is used as a proxy of Be) on Mo. Low pressure argonwas used as a background gas. Experiments were done in conditions where other factors (broadening of spectrallines, signal-to-noise ratio, limited thickness of coatings etc.) did not shadow the effect of laser pulse duration. Forthese reasons, low pressure argon was used as the background gas and fluences were kept at comparatively lowvalues. Spectra of laser-produced plasma were recorded as a function of the number of laser pulses. Partially overlapping lines of hydrogen isotopes were fitted with Voigt contours, intensities were fitted anddepth profiles of deuterium were reconstructed. The relative standard error of curve-fitting of spectra recordedwith the laser of shorter pulse duration was two times smaller than that recorded by the longer pulse laser. Theelectron density was found from the Stark broadening of H line of the laser-produced plasma and the electrontemperature of plasma was found on the basis W and Mo lines. It was found that in the case of ps laser an acceptable accuracy of the detection of deuterium was possible atconsiderably lower values of fluence. Steps needed for comparison of ps and ns lasers in ITER-relevant conditionswere discussed. 1. Introduction The ITER strategy foresees applying laser induced breakdownspectroscopy (LIBS) for quantitative in situ diagnostics of fuel retentionin the first walls during maintenance breaks. Quantitative informationcould be obtained by calibration-free LIBS, CF LIBS, where the ele-mental composition of a sample is determined on the basis of the ac-curate knowledge of the electron temperature Te and the electrondensity ne [1]. To this end, reliable detection of spectral lines of hy-drogen isotopes as well as those of the host material is required. Determining fuel retention by LIBS is hampered by two main issues.First, at high densities of charge carriers in a laser-created plasma, Hand Da lines are partly overlapping due to the Stark broadening. Longdelay times between the laser pulse and the beginning of data acqui-sition, ta, reduces the overlap because the density of charge carriers inplasma decreases with ta. However, the signal-to-noise ratio, S/N, de-creases simultaneously with ta. Secondly, stronger lines of the targetmaterial are influenced by self-absorption and at larger values of ta theintensity of lines with lower self-absorption has a low S/N ratio. Theseare the main reasons triggering the search for alternative solutions for reliable recording of LIBS spectra. Most fusion-related LIBS measurements are carried out by usingsingle-pulse lasers with nanosecond pulse duration. However, studiesrelated to hydrogen isotopes detection [2] show that the nanoseconddouble-pulse LIBS improves the S/N ratio. Besides, some studies [3,4]indicate that using lasers with a shorter pulse duration would be ad-vantageous for determining the surface characteristics and retained fueldepth profiles of the analyzed samples. The aim of the present study is to compare the effect of differentpulse durations on LIBS results of ITER-relevant samples. Other ex-perimental conditions, e.g. pressure and fluence, were selected in theway which showed most clearly the effect of pulse duration. The studyis a necessary groundwork for following studies at atmospheric pressurerelevant for diagnostics during the maintenance breaks. 2. Materials and methods The investigated samples simulating the co-deposits encountered onITER walls were D-doped W/Al coatings (Al is used as a proxy of Be) onMo. Depending on the position in the ITER wall, the co-deposits can be A B Fig. 1. A -sketch of the setup used in the experiments. B - profiles of craters formed by 30 laser pulses. either “soft”or“hard”from the viewpoint of sputtering and ablationrate. Both types of coatings have been investigated in our previousstudies [5] and it was found that only a small number of laser shotswere needed to reach the substrate in case of“soft” W coatings with athickness of a few micrometres. This complicates comparing the effectof laser pulse duration on the accuracy of D content determination andtherefore we used here samples with a low ablation rate, prepared byCombined Magnetron Sputtering and Ion Implantation technique [6]which was successfully used to coat ITER-like walls [7]. Determinationof elemental depth profiles by Gas Discharge Optical Spectrometry,GDOES, and Secondary Ion Mass Spectrometry, SIMS showed that thethickness of the coating was ≈ 3 um and contained≈10 at% of Al and≈ 5 at% of deuterium. Experiments were carried out with the setup, Fig 1A, with moredetailed description in [8]. The best S/N ratio was obtained by usingargon at 300 Pa pressure as a background gas. Two Nd: YAG lasers withpulses of different durations (first from Ekspla with 0.15 ns pulses,andthe second from Quantel with 8 ns pulses) lasing at 1064 nm, were used.The repetition rate of laser pulses was 1 Hz. The laser beam striking thetarget was changed by translating the mirror M as depicted in Fig. 1A.In both cases, the laser beam was focused onto the sample surface at 90°with the plano-convex lens of 1500 mm focal length. A Mechelle 5000 (Andor) spectrometer was used for recordingspectra in a broad range (250-850nm) and MDR-23 for recordingspectra in 20 nm range around the Balmer alpha lines of hydrogenisotopes. Both spectrometers recorded spectra at 45° with respect to thelaser beam. The full width at half maximum, FWHM, of the instru-mental function was determined with the help of a He:Ne laser.Spectrometers recorded time-gated spectra within a window ofAt=2000 ns using ICCD cameras. To reach optimal conditions for reconstructing elemental depthprofiles, the measurements were carried out at comparatively low va-lues of laser pulse energies, 30-50 mJ and 10-20 mJ for ns and pslasers, respectively. Spectra were recorded at different values of delay time between the laser pulse and the beginning of data acquisition,ta=400-2000 ns. At fixed values of ta and laser energy, spectra be-longing to thirty consequent laser shots were recorded from a numberof different spots on the sample surface. The position of a new spot wasset by shifting the sample holder. The distance between the spots was>1.3 mm. The depth profiles of craters were recorded by a 3D opticalprofiler New View 7100 (Zygo) and by a Dektak 150 (Veeco DigitalInstruments) contact profilometer, Fig. 1B. The structure of the craterbottom changed remarkably with the laser shot number and at a fixedshot number the roughness of the bottom of different craters was within0.5-1 um. The diameter of craters produced by 30 laser shots was usedfor estimation of the average value of the laser fluence at the samplesurface. 3. Results and analysis Fig. 2 shows W depth profiles obtained by GDOES and LIBS. LIBSprofile was found by using integral intensities of W lines at wavelengthsof 653.24 and 653.81 nm. In case of LIBS profile, the main reason of amore gradual decay of the intensity is probably caused by the Gaussiandistribution of the energy of laser beams as well as by the redepositionof the ablated material. The fitting of LIBS profile obtained by ps laserof =5.5 Jcm2 fluence with the GDOES profile resulted in the valueof coating ablation rate ≈ 0.17 um/shot. The ablation rate of the nslaser at D=10.6 Jcm-2 was 1.7 times larger.Within the limits of theused laser energies, the ablation rate remained almost unchanged. These values of ablation rates seem to contradict with the profile of30-shot craters in Fig. 1B where the crater depths exceed only slightlythe value of the coating thickness. This difference between depth pro-files in Fig. 2 and crater profiles obtained by profilometer can be ex-plained by a considerably lower ablation rate of the Mo substrate.Another factor reducing the Mo ablation rate is its higher value of thereflection coefficient at 7=1064 nm [9], which results in the absorbedenergy being decreased. Fig. 2. Comparison of GDOES and LIBS profiles; ps laser, D=5.5J cm.Ablation rate was obtained by fitting with GDOES profiles. Fig. 3A presents an excerpt of the spectrum containing partlyoverlapping D。 (A=656.09nm) and H (A=656.26nm) lines. Themain cycle of measurements was carried out at ns and ps laser energieswhere at a small number of laser shots, <5, Ha peaks had comparablevalues. At ta≥400 ns and at smaller number of laser shots, the spec-trum showed a two-humped structure, while for a larger number ofshots,> 20, only the Ha peak exceeded the noise level. As a commontrend, the dip between D and H peaks was more pronounced at longerta values and at a fixed ta the dip was more noticeable for ps laser. At low background gas pressures, besides the instrumental broad-ening, Tr=0.055 nm, the FWHM of lines is also substantially influ-enced by Doppler and Stark effects. The line shapes corresponding tothese mechanisms are given by Gaussian and Lorentzian profiles.Contours of these lines were fitted by pseudo Voigt functions using theleast square method [10]. The Gaussian component of profiles wascalculated from Ic =√I}+T. The FWHM of the Doppler broad-ening is Ip=7.16×10-710- where M is mass in atomic mass units,temperature T in Kelvin results from Boltzmann plot, Fig. 5, and ao isthe wavelength in nanometres. At ta and values corresponding tothose of Fig.5, Ip values of ns laser for D ja H lines were 0.056 and0.079 nm, respectively. The FWHM of the Lorentzian component,It,was used as a fitting parameter. Its initial value was found by fittingVoigt contours with spectra showing only the H line, Fig. 3A. Delaytimes ta ≥800 ns resulted in reasonable separation of Da and H peaksby curve-fitting and IL =0.07-0.08 nm was obtained for both lasers.The S/N ratio of Da and Ha peaks was reasonably high even at higherdelay times when MDR spectrometer was used. The fitting was used to calculate the intensities of Da and H lines as well as the backgroundlevel BG. The main factor influencing the accuracy of Ddeterminationwas the overlapping by the more intensive H line. For spectrum pre-sented in Fig. 2B the relative standard errors, RSE, of fits for Da and Halines were≈6% and≈1.5%, respectively. Under the same generalconditions, RSE of the fit for ns laser spectrum was larger by a factor oftwo when compared with the ps laser spectra. The S/N ratio for tungsten lines recorded by the Mechelle 5000spectrometer was too low at ta>800 ns and further data processingwas carried out for results obtained at ta=800 ns. In spite of a goodfitting of single-shot Da/Ha spectra by Voigt functions, shot-to-shotintensities of spectral lines fluctuated remarkably. The main reason offluctuations was probably the roughness of the crater structure, Fig. 1B,which changed randomly from shot to shot thus influencing the amountof ablated matter and intensity of spectral lines. Averaging spectra overa number of spots [11] diminished the extent of fluctuations. Fig. 4 demonstrates a satisfactory coincidence of Da and W profilesand the matching of these profiles with the Mo profile. The use of Lorentzian FWHM of a-lines of hydrogen isotopes and aset of W lines allowed to evaluate the electron density ne and theelectron temperature Te of the plasma plume formed during the first5-10 laser shots. Assuming local thermal equilibrium, LTE, the electron temperatureTe could be found from the slope of the linear dependence (Boltzmannplot) In[I/Akig]=f(Ex) [12]. Here I is the intensity of a spectral line,Aki is the radiative transition probability of the corresponding transi-tion, gk and Ek are statistical weight and energy of the upper state, re-spectively. The validity of the LTE was estimated on the basis of McWhirter criterion. In the worst case, the estimated electron densityexceeded the criterion 1.8 times. W lines were selected according to considerations described in [13],excluding lines with higher values of self-absorption. In the wavelengthrange 330-520 nm, 19 lines from spectra obtained by ps laser and 16lines from those of ns laser were chosen and characterized by integralintensities. The deviation of points from the straight line is compara-tively small according to Fig. 5 and the analysis showed that in the caseof ps laser the effect of self-absorption is slightly smaller. Slopes oftrendlines in Fig. 5A gave Te= 0.85 eV (9800 K) for the ns laser andTe=0.75 eV (8700 K) for the ps laser. Because of the lower intensity ofW lines in the ps laser spectra, the intercept of the correspondingBoltzmann plot has ~ 1.4 times smaller value than that of the ns laser.When the coating was removed due to ablation, Mo lines were used forTe estimation. The list of the selected 13 Mo lines did not contain in-tensive lines with transition to the ground state. The difference betweentemperatures found from measurements with ns and ps lasers waswithin the uncertainty of measurements and the average temperature Fig. 4. LIBS profiles of Da, W and Mo; ta=800 ns. A - ns laser, d= 10.6J cm-2. B -ps laser;D=5.5J cm-2. Profiles result the averaging over 3 spots. Fig. 5. Boltzmann plots; ta=800 ns; ps laser D=5.5J cm-2; ns laser =10.6 Jcm-2. A-shot 2; intensities of W lines with corresponding trendlines; open symbolsbelong to lines with a strong self-absorption, 400.9 and 407.4 nm. B - shot 20; intensities of Mo lines; dashed lines are trendlines; solid lines correspond to thetemperature 0.89 eV; open symbols belong to lines with a strong self-absorption, 379.8, 386.4 and 390.3 nm. was 0.89 eV (10,360 K), Fig. 5B. The value for electron density, ne 2×1015 cm-3was obtainedfrom the Lorentzian FWHM of H line with the help of the relationshipIz=4.63×10⁻¹²n?3presented in [14]. It is interesting to compare our findings with other similar studies.In [15] an overview of experimental studies of ablation with lasers ofdifferent pulse durations as well as the results of a detailed modellingare presented. Similarly to our results, both experiments and modellingshow that at longer delay times, ta > 100 ns, the plasma characteristicsdepend on the total energy deposited and not on the pulse duration.Reference [16] showed that at a fixed laser wavelength and energy theablation efficiency, cm’J-1, of a ns laser is by a factor 5 larger than thatof a ps laser. Smaller amount ofevaporated material could be a reasonwhy in our ps laser measurements the self-absorption effects are lesspronounced. 4. Conclusions LIBS spectra produced by lasers of 0.15 and 8ns pulse durationswere recorded. Experiments with ITER-relevant samples were carriedout at low values of laser fluence ①which allowed a reliable design ofdepth profiles of deuterium and tungsten. The main factor limiting theaccuracy of curve-fitting of deuterium line was the high-intensity hy-drogen signal. Comparison with ns laser permits to carry out the following ad-vantages of ps laser · Almost the same intensity of a-lines of hydrogen isotopes wasachieved at two times lower values of laser fluence, while the in-tensity of W lines was much lower · RSE of the curve-fitting of Da profile was two times lower · Intensities of W lines were less influenced by self-absorption whichimportant from the viewpoint of application of CF LIBS The drawback of the used values of fluence was a comparatively lowvalue of the S/N ratio and thus the observed features of ps laser are justtrends. Testing of thicker ITER-relevant coatings together with highervalues of fluence gives a possibility to carry out the specificity of pslaser more definitely. Furthermore, using higher values of fluence de-crease the shot noise governing the S/N ratio at longer delay timeswhich is used in LIBS measurements at near-atmospheric pressures ofthe background gas. In these conditions however the strong hydrogensignal could shadow the reliable determination of deuterium. Acknowledgements This work has been carried out within the framework of theEUROfusion Consortium and has received funding from the EuropeanUnion's Horizon 2020 research and innovation programme under grantagreement number 633053. The views and opinions expressed hereindo not necessarily reflect those of the European Commission. Workperformed under EUROfusion WP PFC. [1] A. Ciucci, M. Corsi, V. Palleschi, S. Rastelli, A. Salvetti E. Tognoni, New procedurefor quantitative elemental analysis by laser-induced plasma spectroscopy, Appl.Spectrosc. 53 (1999) 960-964. [2|] S. Almaviva, L. Caneve, F. Colao, G. Maddaluno,N. Krawczyk,A. Czarnecka,P. Gasior, M. Kubkowska, M. Lepek, Measurements of deuterium retention andsurface elemental composition with double pulse laser induced breakdown spec-troscopy, Phys. Scr.T167 (2016)014043. ( [3] P . S tavropoulo s , C . Palagas, G.N . Angelopoul o s, D .N. P apamantellos, S. C ouri s , C a l ibration m easurements in laser-i n duced breakdown spectroscopy using nano - seco n d a n d picosecond la s ers, Spectrochim. A cta B 59 (2004) 1885-1 8 9 2. ) [4]V. Morel, B. Peres, A. Bultel, A. Hideur, C. Grisolia, Picosecond LIBS diagnostics forTokamak in situ plasma facing materials chemical analysis, Phys. Scr. T167 (2016)014016 ( [ 5] M . L a an, A . H a k o l a , P. Pa r is, K. Pi i p, M . Aints, I . Jogi, J . K ozlova, H . M a n dar, C . L u ngu , C . P orosnicu, E . G ri go re, C. R use t , J. Koleh ma ine n , S . T e rvakangas , D e pendence o f LIB S spectr a on th e surf a ce composition and morpholog y o f W/Al c oati n gs, F usion Eng. Des. 121 (2017) 2 96-3 0 0. ) [6]]C. Ruset, E. Grigore, H. Maier, R. Neu, X. Li, H. Dong, R. Mitteau, X. Courtois, JETEFDA contributors, tungsten coatings deposited on CFC tiles by the combinedmagnetron sputtering and ion implantation technique, Phys. Scripta T128 (2007)171-174. [7]C. Ruset, E. grigore, H. Maier, R. Neu, H. Greuner, M. Mayer, G. Matthews,Development of W coatings for fusion applications, Fusion Eng. Des. 86 (2011)1677-1680. [8]P. Paris, J. Butikova, M. Laan, M. Aints, A. Hakola,K. Piip,I. Tufail, P. Veis,Detection of deuterium retention by LIBS at different background pressures, Phys. ( Scr. T170(2017)014003. ) ( [9] M1 . J o a nny , J . M . T r a v e re, S . S a l asca, L . Mar o t, E. M e yer, C. Thellier , C . C ammarat a , G . G allay, J . J. Fe r me, Achievements on engine e ring and m a nu f acturing of IT E R first-m i rror mock-ups, IEEE Trans. Plas m a Sci . 40 (2012) 692-696. ) ( [10]T . I da, M. And o , H . T oraya, E xtended pseudo-Voigt f u ncti o n for a pproximating t h e V oigt p rof i le, J. A pp l . Cry s t. 33(2000)1 3 1 1-1316 . ) ( [11] P . P aris, M . A in t s, A. Hakola, M . K iisk, J.Kolehmainen, M. La a n, J. L i k onen, C . R uset, K. Sugiyama, S . Teravkangas, D etermi na tion of elem e ntal depth p r ofil e s b y m ult i -spot a veraging technique o f L I B S s p ectra, F u sion Eng. De s.86 (2 0 11) 1125- 1 1 28. ) [12]1D..W. Hahn, N. Omenetto, Laser-induced breakdown spectroscopy (LIBS), part II:review of instrumental and methodological approaches to material analysis andapplications to different fields, Appl. Spectrosc. 66 (2012) 347-419. [13]A. Lissovski, K. Piip, L. Hamarik, M. Aints, M. Laan, P. Paris, A. Hakola,J. Karhunen, LIBS for tungsten diagnostics in vacuum: selection of analytes, J.Nuclear Mater. 463 (2015) 923-926. [14]IR. Fantoni, S. Almaviva, L. Caneve, F. Colao, A.M. Popov, G. Maddaluno,Development of calibration-free laser-Induced-Breakdown_Spectroscopy basedtechniques for deposited layers diagnostics on ITER-like tiles, Spectrochim. Acta B87 (2013) 153-160. [15] A. Bogaerts, Z. Chen, Effect of laser parameters on laser ablation and laser-inducedplasma formation: a numerical modeling investigation, Spectrochim. Acta B 60(2005)1280-1307. .[16]A. Semerok, C. Chaleard,V. Detalle, J.-L. Lacour, P. Mauchien, P. Meynadier,C. Nouvellon, B. Salle, P. Palianov, M. Perdrix, G. Petite, Experimental investiga-tions of laser ablation efficiency of pure metals with femto, pico and nanosecondpulses, Appl. Surf. Sci. 138-139 (1999) 311-314. ITER foresees applying laser induced breakdown spectroscopy (LIBS) as a tool for quantitative assessment of fuel retention in the first walls. One open problem related to LIBS application is the choice of the laser type. Here we compare two Nd/YAG lasers with different pulse durations, 0.15 and 8 ns, working at λ=1064 nm for LIBS studies of samples with D-doped W/Al coatings of≈3 μm thickness (Al is used as a proxy of Be) on Mo. Low pressure argon was used as a background gas. Experiments were done in conditions where other factors (broadening of spectral lines, signal-to-noise ratio, limited thickness of coatings etc.) did not shadow the effect of laser pulse duration. For these reasons, low pressure argon was used as the background gas and fluences were kept at comparatively low values. Spectra of laser-produced plasma were recorded as a function of the number of laser pulses.Partially overlapping lines of hydrogen isotopes were fitted with Voigt contours, intensities were fitted and depth profiles of deuterium were reconstructed. The relative standard error of curve-fitting of spectra recorded with the laser of shorter pulse duration was two times smaller than that recorded by the longer pulse laser. The electron density was found from the Stark broadening of Hα line of the laser-produced plasma and the electron temperature of plasma was found on the basis W and Mo lines. It was found that in the case of ps laser an acceptable accuracy of the detection of deuterium was possible at considerably lower values of fluence. Steps needed for comparison of ps and ns lasers in ITER-relevant conditions were discussed.
关闭-
1/5
-
2/5
还剩3页未读,是否继续阅读?
继续免费阅读全文产品配置单
北京欧兰科技发展有限公司为您提供《ITER相关样品-铝靶中激光诱导击穿光谱(LIBS)检测方案(激光产品)》,该方案主要用于其他中激光诱导击穿光谱(LIBS)检测,参考标准《暂无》,《ITER相关样品-铝靶中激光诱导击穿光谱(LIBS)检测方案(激光产品)》用到的仪器有Ekspla SL330型SBS压缩皮秒激光器。
我要纠错


相关方案
 咨询
咨询