

方案详情文
智能文字提取功能测试中
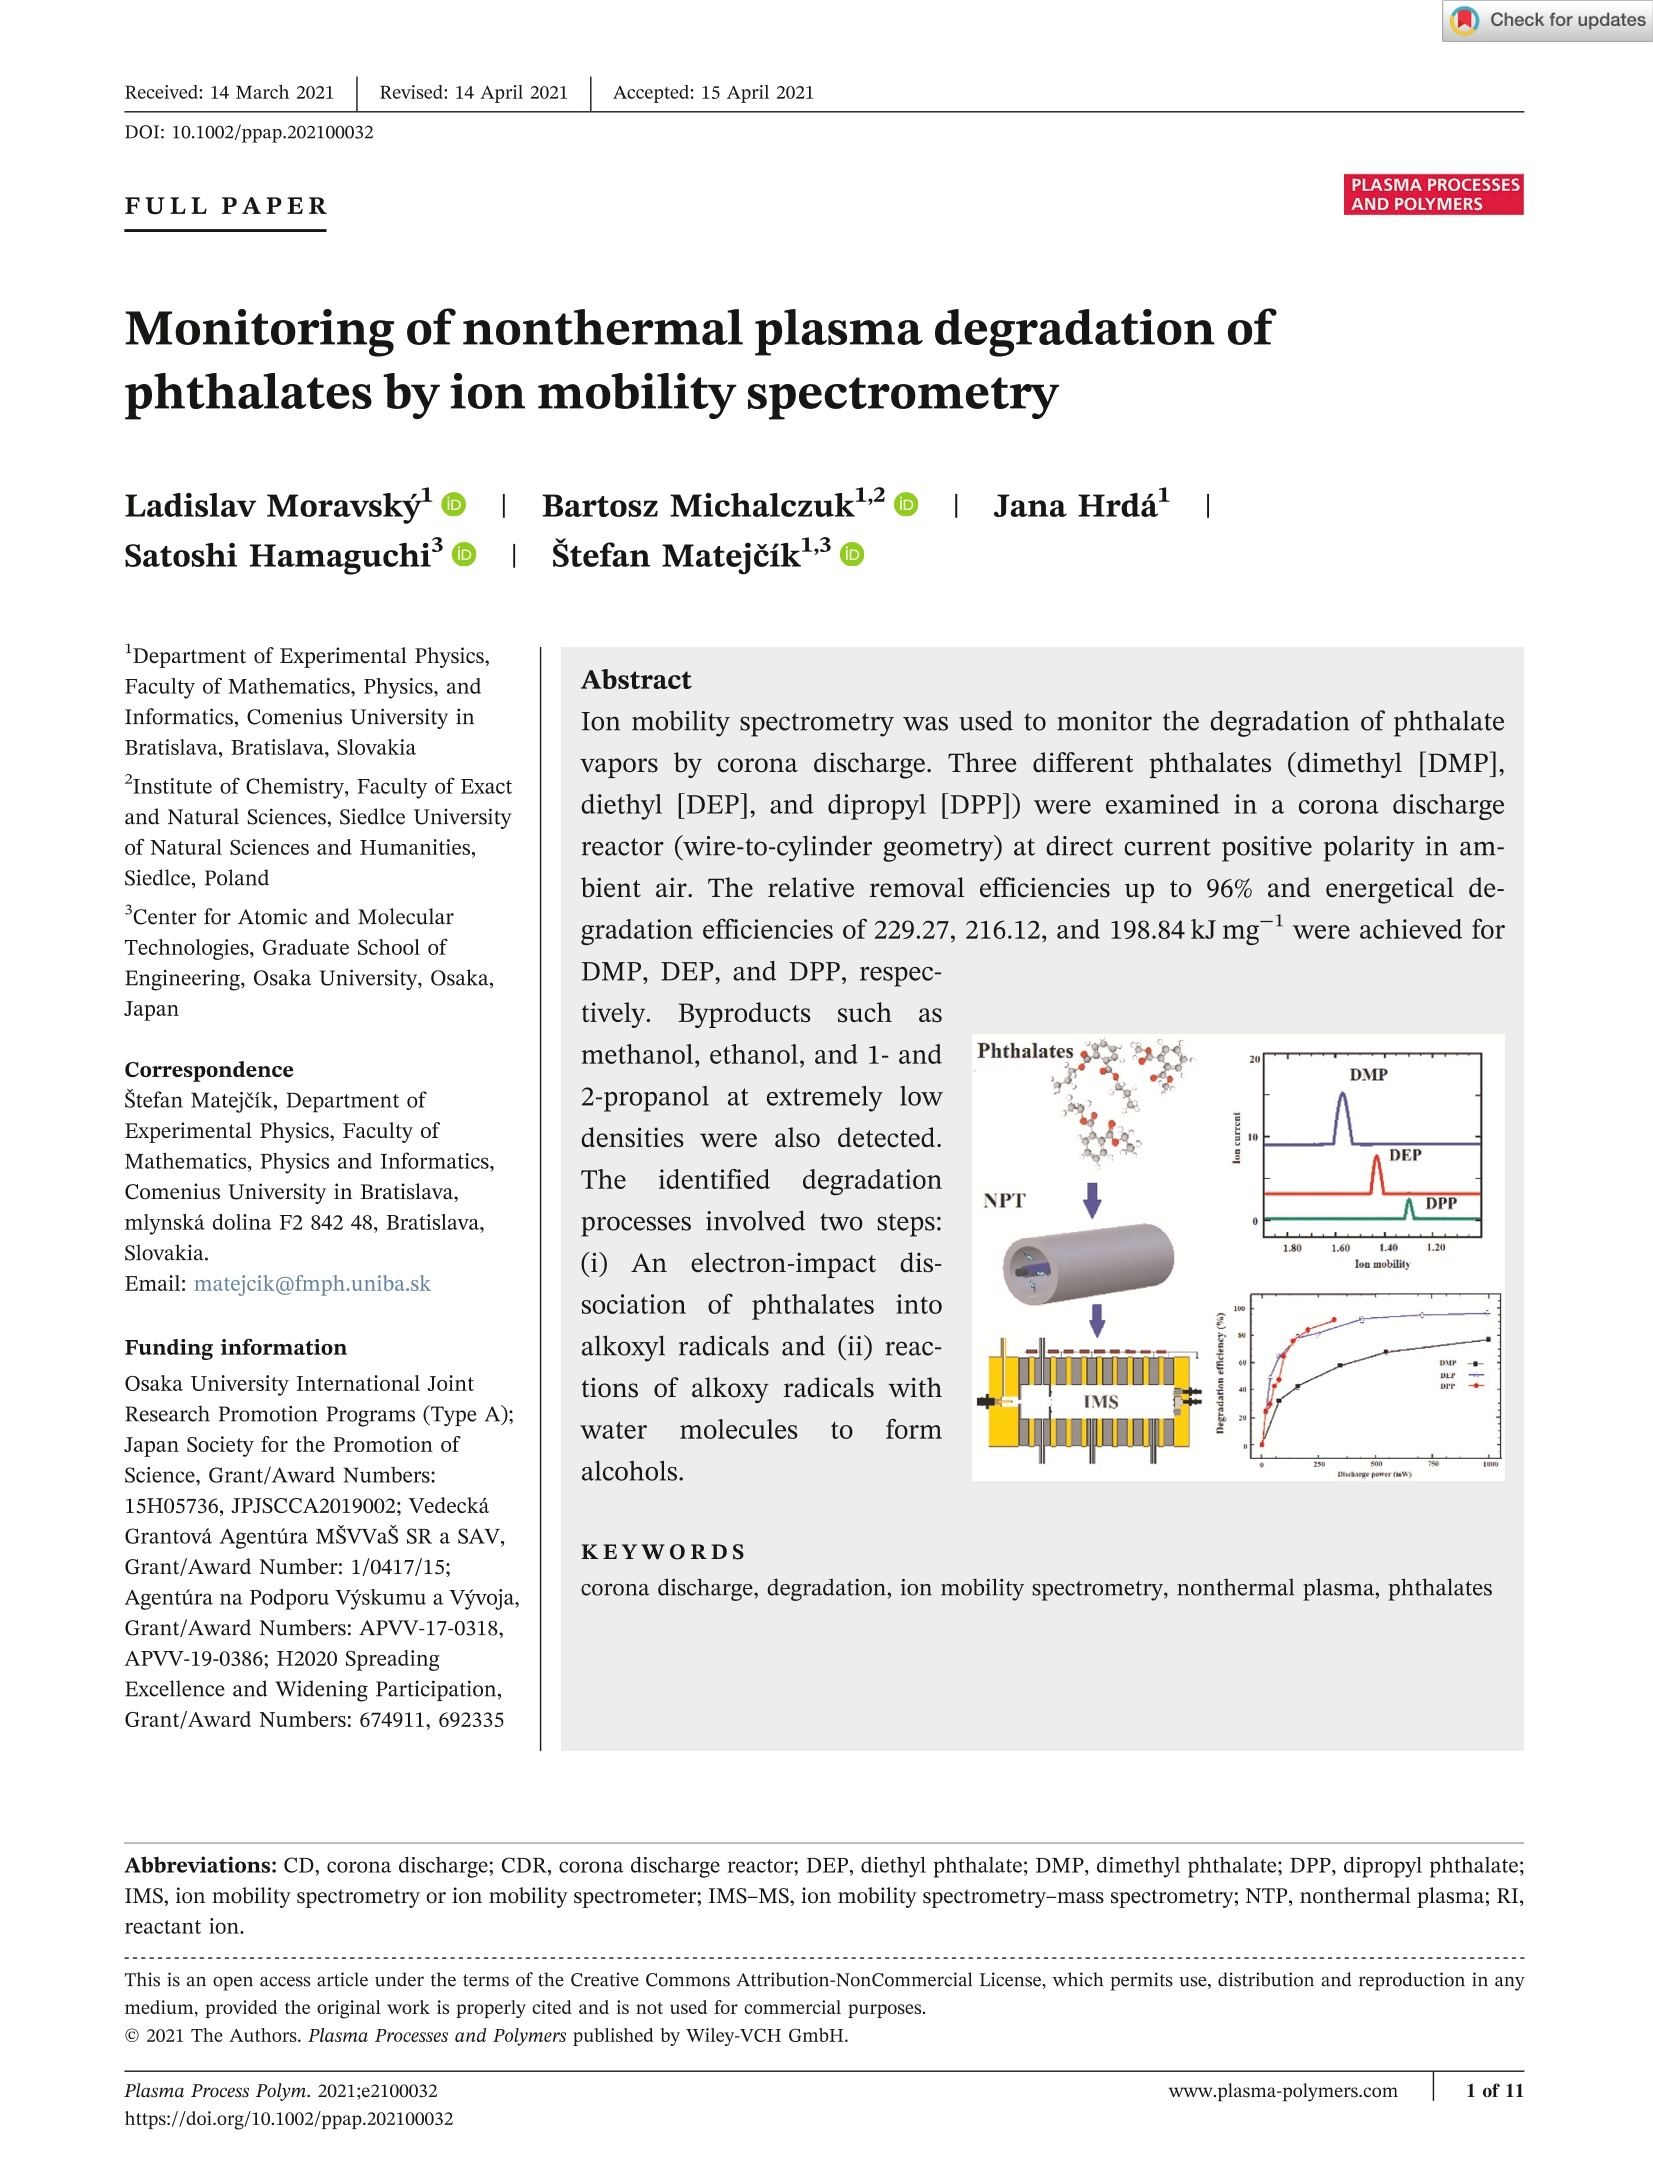
Accepted: 15 April 2021Revised: 14 April 2021Received: 14 March 2021DOI: 10.1002/ppap.202100032PLASMA PROCESSESAND POLYMERSFULLPAPER 2of 11MORAVSKY ET AL.PLASMA PROCESSESAND POLYMERS 1 of 11Plasma Process Polym. 2021;e2100032www.plasma-polymers.comhttps://doi.org/10.1002/ppap.202100032 Monitoring of nonthermal plasma degradation ofphthalates by ion mobility spectrometry Department of Experimental Physics,Faculty of Mathematics, Physics, andInformatics, Comenius University inBratislava, Bratislava, SlovakiaInstitute of Chemistry, Faculty of Exactand Natural Sciences, Siedlce Universityof Natural Sciences and Humanities,Siedlce, Poland Center for Atomic and MolecularTechnologies, Graduate School ofEngineering, Osaka University, Osaka,Japan Correspondence Stefan Matejcik, Department ofExperimental Physics, Faculty ofMathematics, Physics and Informatics,Comenius University in Bratislava,mlynska dolina F2 842 48, Bratislava, Slovakia. Email: matejcik@fmph.uniba.sk Funding information Osaka University International JointResearch Promotion Programs (Type A);Japan Society for the Promotion ofScience, Grant/Award Numbers:15H05736, JPJSCCA2019002; VedeckaGrantova Agentúra MSVVaS SR a SAV,Grant/Award Number: 1/0417/15;Agentúra na Podporu Vyskumu a Vyvoja,Grant/Award Numbers: APVV-17-0318,APVV-19-0386; H2020 SpreadingExcellence and Widening Participation,Grant/Award Numbers: 674911,692335 Ion mobility spectrometry was used to monitor the degradation of phthalatevapors by corona discharge. Three different phthalates (dimethyl [DMP],diethyl [DEP], and dipropyl [DPP]) were examined in a corona dischargereactor (wire-to-cylinder geometry) at direct current positive polarity in am-bient air. The relative removal efficiencies up to 96% and energetical de-gradation efficiencies of 229.27, 216.12, and 198.84kJ mg-were achieved for DMP, DEP, and DPP, respec- tively. Byproducts suchasmethanol,ethanol, and 1-and2-propanol at extremely lowdensities were also detected.Theidentified degradationprocesses involved two steps:(i) An electron-impact dis-sociation of phthalatesintoalkoxyl radicals and (ii) reac-tions of alkoxy radicals withwater rmolecules to formalcohols. KEYWORDS corona discharge, degradation, ion mobility spectrometry, nonthermal plasma, phthalates Abbreviations: CD, corona discharge; CDR, corona discharge reactor; DEP, diethyl phthalate; DMP, dimethyl phthalate; DPP, dipropyl phthalate;IMS, ion mobility spectrometry or ion mobility spectrometer; IMS-MS, ion mobility spectrometry-mass spectrometry; NTP, nonthermal plasma; RI,reactant ion. This is an open access article under the terms of the Creative Commons Attribution-NonCommercial License, which permits use, distribution and reproduction in any medium, provided the original work is properly cited and is not used for commercial purposes. @ 2021 The Authors. Plasma Processes and Polymers published by Wiley-VCH GmbH. 1 INTRODUCTION Phthalates (esters of phthalic acid) are chemicals with awide field of applications. Phthalates are used as ad-ditives to plastics to increase their flexibility, transpar-ency, durability, and longevity. 1.2 They are found in awide range of products such as construction materials,electrical wire shielding, toys, food packaging, coatings ofpharmaceutical pills, medical devices (catheters andblood transfusion devices), cosmetics (perfume and hairspray), glues, viscosity control agents, binders, syntheticfibers, paint pigments, and insect repellents. 1-6] On thebasis of the number of carbon atoms in the backbonechain, they are classified into low molecular weightphthalates and high molecular weight phthalates. Lowmolecular weight phthalates (e.g., dimethyl phthalate[DMP], diethyl phthalate [DEP], dipropyl phthalate[DPP], dibutyl phthalate [DBP]) are commonly used assolvents and plasticizers in personal care items such asnail polish, color cosmetics, and fragranced lotions. These substances can be harmful due to the potentialfor endocrine disruption of the male reproductive tract2.4.6and testicular cancers.2,4,6]High molecular weightphthalates such as di-(2-ethylhexyl) phthalate (DEHP)and di-isononyl phthalate are most commonly used inpolyvinyl chloride-containing products, and there havebeen concerns with regard to the detrimental effects onhumanhealth caused bbyy e expxpososuruer eto these chemi-cals.178]TheEuropean Union has classified somephthalates (e.g., DMP, DEP, DBP, DEHP, and benzylbutyl phthalate [BBP]) as the main environmental pol-lutants. 9,10] Phthalates are stable at ambient temperatureand can be found almost everywhere, in the atmosphere,water, soil, plants, and aquatic organisms, and they havebecome one of the most ubiquitous environmental pol-lutants, which threaten food security and biohealth andalter the genetics of living organisms. 11,12] Therefore, itis essential and urgent to develop appropriate methodsfor the treatment of phthalates in water, air, and soil. Various techniques for the effective removal and de-gradation of phthalates in water solutions and the soilhave been developed. Some of the most common meth-ods are photochemical and biological treatments. Thephotochemical methods are focusing on advanced oxi-dation processes such as O3-H202, ultrasound-UV-TiO2,Fenton process, or H202-UV.l2,13-17In some cases.radiolysis has been successfully employed to degradeorganic pollutants.[18,19] The biological met arebased on the metabolic degradation of phthalates bymicroorganismsunder aerobic or anaerobic condi-tions. 10,20,21] In the literature, we did not find any studydevoted to the degradation of phthalates in the gas phase,which is the objective of the present study. In the past few decades, different types of electricaldischarges, such as dielectric barrier discharge, glow dis-charge, pulse discharge, and gliding arc discharge, havebeen developed for the degradation of organic compoundsin gasesl22-24] and liquidsl25] due to their high efficiencyand simple construction. For the decontamination of wa-ter, discharges were initiated in the gaseous environmentand the generated reactive species were transferred intothe water or directly generated in water. 26-29] The ultra-violet radiation, high-energy electrons, and other reactivespecies including OH radicals and H202 were used in suchcontaminant-removal processes. 30-33] We have applied positive-polarity DC corona dis-charges (CDs), that is, nonthermal plasmas (NTPs), inthe air for the degradation of vapors of phthalates. Undernormal conditions, the concentrations of these phthalatesin the air are in the range of ppm. Mainly chromato-graphic and mass spectrometric methods (and theircombinations)are used for the detection of phtha-lates.I34-36] These methods are relatively slow and do notallow real-time monitoring of the degradation process. Inthe present work, we examined the efficiency of de-gradation of low-concentration phthalates in ambient airby a simple CD as a function of its current and power,using ion mobility spectrometry (IMS).[37-40] The highsensitivity (in the ppb range) and fast response (in the msrange) of IMS allowed the real-time measurement of thechange in ppm- or sub-ppm-level phthalate concentra-tions and the prompt detection of degradation by-products. The real-time measurement also allowed theaccurate evaluation of the degradation efficiency whenthe experiments were performed under various dischargeconditions in relatively short time intervals. 2 1 EXPERIMENTAL SETUP 2.1 1 Corona discharge reactor (CDR) The degradation of phthalates was carried out in a positiveCDR consisting of a metal wire in a cylindrical chamber,as shown in Figure 1. The wire electrode was made oftungsten (75 um in diameter), whereas the grounded tubewas made of stainless steel with an inner diameter of16 mm. The length of the CDR was 22.4 cm. The CDR wasoperated in positive polarity, using a high-voltage powersupply (Heinzinger LNC 10000-2). The working gas wasambient air enriched by phthalate vapors as the air wasflowing through a glass vial filled with a phthalate sample.The CDR was placed between the source of the workinggas and IMS. The flow rates through the CDR were30 ml min-for DMP and DEP and 50 ml min-for DPP.The total volume of the CDR is 45 ml, and from the FIGURE l Schematic view of the experimental setup-A glassvial connected to the CDR and IMS. A phthalate (DMP, DEP, or DPP)sample is placed in the glass vial. CD, corona discharge; CDR, coronadischarge reactor; DEP, diethyl phthalate; DMP, dimethyl phthalate;DPP, dipropyl phthalate;IMS, ion mobility spectrometry applied flow rates, we can calculate the treatment time of90s for DMP and DEP and 54s for DPP. 2.2 Ion mobility spectrometer The driftfttube-type IMSwasuseddiin theIpresentstudy, 39-42]whose schematic diagram isSshown in Figure 2. The IMS consisted of a CD ion source, a reac-tion region, an ion gate, a drift tube, and an ion collector.The CD ion source here was used only to generate re-actant ions (RIs) for IMS and should not be confusedwith the CD source for the CDR, which was used for thedegradation of pollutants. The role of the CD ion sourceof an IMS will be discussed in the following subsection.As the drift gas for the IMS, we used dry air with 20-ppmhumidity, which was generated by a Zero air generator(MaSa Tech Ltd.) and an additional moisture trap(Agilent Technologies). The IMS operation pressure wasslightly below atmospheric pressure (9×10Pa, massflow, and pressure controller by Bronkhorst) to allowsimple sampling by sucking a sample gas into the IMS.The operational temperature of the IMS and the drift gaswas set to 373 K. The elevated temperature improves theresolution of the instrument as it decreases the clusteringof ions in the drift tube. A homogenous electric field(~670Vcm-) was established between the ion sourceand the detector by a system of isolated ring electrodessupplied by a voltage divider. This electric field trans-ports ions from the ion source to the detector. The con-tinuous ion current generated in the ion source waspulsed by the ion gate (Bradbury-Nielsen type) and shortion bursts (typically 30- to 100-us width and 50-Hz re-petition rate) were generated. The drift velocity of theions depends on their mass-tocharge ratio, the collision.Cross-sectionbetweenttheion anddriftgas,the FIGURE2 Schematic view of the IMS in the reverse flow mode used in this study. The cross-sections of the shutter grid (SG) andaperture grid (AG) are depicted on the left. The drift gas used in this study was zero air with 20-ppm humidity. The sample inlet is connectedto the CDR, as shown in Figure 1 composition of the drift gas, and the drift gas pressureand temperature. The differences in drift velocities ofthe ions result in the temporal separation of the ions inthe drift tube. The drift time spectrum of ions wasmeasured by a Faraday plate detector, whose signalswere amplified by a sensitive low-noise trans-impedanceamplifier (Mesa Ltd.) and recorded by a computer. The drift time ta of the ions is a measured quantity inIMS and is related to the length of the drift tube L and thedrift velocity of ions Vion as The Vion is related to the electric field E and ionmobility K as with E being the electric field. Therefore, the ion mobilitycan be expressed by where Uat is the potential difference across the drift tube.From a microscopic point of view, K depends on suchphysical parameters as the drift gas pressure (or con-centration n), the temperature of the drift gas T, the re-duced mass of the system ion-drift gas molecule u, andthe cross-section for collisions of the ion with a moleculeof the drift gas Q, such that The ion mobility K depends on gas temperature andpressure. For this reason, the ion mobility is normalizedto standard conditions (pressure po=101.00kPa andtemperature To=293K) and is called the reduced ionmobility Ko: It should be noted that the dependence of on Tleads to this formula. The reduced ion mobility Ko for anion in a drift gas is independent of temperature andpressure. The sample gas was introduced into the IMS through asimple capillary inlet and controlled by a microsplittervalve (SUPELCO) accompanied by a short capillary. Theion mobility scale was calibrated uusing 22,6-di-tert-butylpyridine (Sigma-Aldrich) as a standard compoundwith well-known reduced mobility of 1.42 cm²v-ls-1.[43] 2.3 Atmospheric pressure chemicalionization The IMS was equipped with a CD ion source in a point-to-plane geometry in positive polarity. The ion sourceoperated in a drift gas produces RIs, which are also de-tected in IMS, as seen in the top spectrum (denoted inblack) of Figure 3. The RIs consist of two peaks, thedominant one with a reduced ion mobility value of2.21 cm²v-s-, corresponding to H*·(H2O)3,4, and thesecond weak peak at 2.48 cm²v-s-, which we associ-ate with NH4*·(H2O)n ions. RIs in IMS play a key role inIMS because they perform chemical ionization of charge-via the following protontransferreaction: Reaction (6) is highly efficient if the proton bond energyof an RI (H*·(H2O)3,4) is lower than the proton affinityof the molecule M. The composition or size of the RI lon mobility (cm2.V-1.s-1) TABLE1 Operating parameters of ion mobility spectrometry(IMS) used in this study Operating parameters Unit IMS drift tube length 11.93 cm Electric field intensity 670.6Vcm -1 IMS operating pressure 9× 10+ Pa IMS operating temperature 373K Drift gas Dry air (20 ppm humidity) Drift gas flow 1000 ml min Sample gas flow 30-50ml min Corona discharge current 10 uA Shutter grid pulse width 60us Shutter grid frequency 50 Hz (i.e., the number of water molecules in the water cluster)depends on the humidity of the drift gas, which is con-trolled in the experiment. The size of RI decreases alsowith an increasing drift gas temperature (373 K in thepresent experiment). The operating parameters aresummarized in Table 1. Another possible ionization re-action is which is called a switching reaction. This reaction canoccur if the proton affinity of the molecule M is lowerthan that of the RI. Therefore, reaction (7) is less effi-cient and results in weaker sensitivity, compared withreaction (6). The working gas, that is, a mixture of phthalateswith ambient air was prepared in a 20-ml glass vial(SUPELCO) with a silicone/PTFE screw cap that allowsambient air to flow through the vial. The concentrationsof phthalate molecules in the working gas (which dependon the vapor pressures of phthalates) were 3, 0.99, and0.175 ppm for DMP, DEP, and DPP, respectively. Using the IMS technique, we measured the drifttimes of ions and calculated their reduced ion mobilities.To assign each ion IMS peak to the mass-charge ratiom/z, we used an IMS connected to a mass spectrometer(IMS-MS). In this study, we used an orthogonal ac-celerated time-of-flight mass spectrometer, which wasbuilt in our laboratory. Using this technique, we as-sign each IMS peak to the mass-charge ratios m/z anddetermine the possible structures of the correspondingions, if possible.41J Phthalates used in the present work were suppliedfrom Sigma-Aldrich with1 the following purities:DMP 99%, DEP 99.5%, and DPP 98%. The structures,vapor pressures, and other properties of phthalates in-vestigated in this study are summarized in Table 2. 3 RESULTS AND DISCUSSION In Figure 3, we present reference IMS spectra of thephthalates as well as the spectrum of RIs. The spectrumof RIs was recorded as ambient air was supplied to theCDR while a discharge in the CDR was switched off.Similarly, the phthalates spectra were recorded as aworking gas containing phthalate vapors was supplied tothe CDR while a discharge in the CDR was switched off. TABLE 2 Structures, vapor pressures, and other properties of phthalates investigated in this study Note: The limits of detections (LOD) were determined in the present ion mobility spectrometry experiments. Abbreviations: DEP, diethyl phthalate; DMP, dimethyl phthalate; DPP, dipropyl phthalate. The measurements were performed under the standardoperating conditions of IMS given in Table 1. Whenphthalate samples were supplied to the IMS, the spectrashowed the phthalate peaks in addition to those of RIs.On the basis of these spectra, we can identify andquantify the phthalates in the sample air. Each phthalatewas identified by the reduced ion mobility Ko (DMPxy-11.59 cm²v-1s-1,DEP 1.43cm²v-ls-, and DPP1.30cm²v-ls-), which was confirmed by IMS-MS. Thecorresponding ions generated in the IMS appeared to beprotonated phthalate ionsSDMP·H, DEP·H*, andDPP·H+, with m/z being 195, 223, and 251, respectively. 3.1 Removal of phthalates by CDs To remove phthalates from the working gas, we haveapplied a positive DC-CD to the working gas flowingthrough the CDR. Switching on a discharge resulted in adecrease in the intensity of the phthalate ions in IMSspectra. The decrease of the phthalate-related ions de-pended on the discharge current. Figure 4 shows the IMS spectra for the degradationprocess of DMP by CDs. In this process, the dischargecurrent of the CDR was varied between 20 and 500 uA.We have achieved a discharge power of 3 W for a CDcurrent of 500 uA. The IMS spectra, besides RI peaks,showed the DMP peak (DMP·H*1.59 cm’v-s-). Theapplication of a discharge in the CDR to the working gascontaining 3 ppm DMP resulted in the decrease of theDMP peak intensity with an increasing CD current. For adischarge current of 200 uA or below, we observed nonew peaks in the spectra. Only at a discharge currentabove 200 uA, we observed weak structures at 2.08 and 1.87cm²v-1s-l, which we attributed to ethanol, and at1.98 cmv-s-, which we attributed to 2-propanol. Asdiscussed in the following subsection, we also observed apeak of methanol overlapping with the RI peak. Theintensities of these new peaks were so low that the cor-responding species could not be identified with ourIMS-MS. The method for the IMS peak assignment willbe discussed in the following subsection. These newlydetected species are considered to be products of thedegradation of DMP. The IMS in positive polarity detectssubstances with proton affinities higher than those of theRIs via the proton transfer reaction (6). In addition to the product peaks, the peak associatedwith NO+·(H20)n ions (2.35 cm²v-s-) is also seen inFigure 4. The same peak also appeared in the measure-ment of other phthalates, as we shall see later. Its in-tensity increased with an increasing discharge current ofthe CDR. We surmise that this peak was caused by NOmolecules generated in the CDR and transported to theIMS. The peak associated with NH4·(H2O)n is also seenat 2.48 cm²v-ls-, which we also believe was generatedfrom air with water vapor in the CDR. We calculated the energy efficiency for the degrada-tion of DMP, that is, energy consumption by the CDR todegrade a unit mass of DMP at a discharge power of3 W, which was found to be 229.27 kJ mg. The DMPconcentration in the working gas decreased from 3 ppmto less than 270 ppb, resulting in a relative removal effi-ciency of more than 91%. A more detailed discussion onthe relative removal efficiency and energy efficiency maybe found in Section 3.2. Figure 5 shows the IMS spectra for the degradationprocess of DEP by CDs. As in the case of DMP, the peakintensity of DEP decreased with an increasing discharge Ion mobility (cm2.v-1.s-1) FIGURE 4 IMS spectra of DMP. The peakintensity of DMP·Hions is shown to decreaseas the CD current increases, indicating thedegradation of DMP by the CD. The insetpresents the magnified spectra for the cases ofno discharge (black) and a CD current of 500 uA(light blue), showing the IMS peaks for ethanoland 2-propanol when the degradation ofDMP takes place. CD, corona discharge;DMP, dimethyl phthalate; IMS, ion mobilityspectrometry FIGURE 5 IMS spectra of DEP. The peakintensity of DEP· H+ ions is shown to decreaseas the CD current increases, indicating thedegradation of DEP by the CD. The insetpresents the magnified spectra for the cases ofCD currents of 0 uA (black) and 200 uA (cyan),showing the IMS peaks for ethanol and1-propanol when the degradation of DEP takesplace. CD, corona discharge; DEP, diethylphthalate; IMS, ion mobility spectrometry lon mobility (cm2.V-1.s-1) current. The initial concentration of DEP in the workinggas before degradation was 0.99 ppm. The degradationwas studied for a discharge current varying from 10 to200 uA (corresponding to the maximum power of995 mW). At the highest discharge current, the intensityof the DEP peak decreased to the level of noise. Com-pared with DMP, we have seen more pronounced de-gradation product peaks in the IMS spectra at 2.08, 1.95,and 1.68 cm’v-s-, as seen in the inset of Figure 5. Thedegradation product peaks correspond well with theethanol (2.08cm²v-s) and 1-propanol (1.95 and1.68 cm’v-s-). The DEP concentration in the air de-creased from 0.99 to 37.5 ppb, which represents a relativeremoval efficiency of more than 96.2%. The energy effi-ciency for the degradation of DEP, that is, energy consumption to degrade a unit mass of DEP, was foundto be 216.12 kJ mg-at the maximum CDR power of995 mW. A more detailed discussion on the relative re-moval efficiency and energy efficiency may be found in. Section 3.2. The last treated phthalate was DPP, which had thelowest vapor pressure (0.0175 Pa). Due to the low vaporpressure of DPP, we were unable to detect it at a sampleflow of 30 ml min-and, therefore, we have increased theflow to 50 ml min-. The initial concentration of DPP inthe working gas before degradation was 175 ppb. Figure 6shows the IMS spectra for the degradation process ofDPP by CDs. As in the cases of DMP and DEP, the de-gradation by a discharge in the CDR resulted in a de-crease in the DPP peak intensity. In the degradation FIGURE6 IMS spectra of DPP. The peakintensity of DPP·H+ ions is shown to decreaseas the CD current increases, indicating thedegradation of DDP by the CD. The insetpresents the magnified spectra for the cases ofCD currents of 0 uA (black) and 15 uA (green),showing the IMS peaks for 2-propanol when thedegradation of DPP takes place. CD, coronadischarge; DPP, dipropyl phthalate; IMS, ionmobility spectrometry process, a new weak ion peak appeared at 1.98 cm"V-s, which we assigned to 2-propanol. In the applied discharge current range (5-35uA), theDPP concentration decreased from 175 to 15 ppb, whichrepresents a relative removal efficiency of 91.5%. Thelowest level of the DPP peak was achieved at a CDRcurrent of 35 uA, which corresponds to a CDR power of320 mW. The energy efficiency for the degradation ofDPP, that is, energy consumption to degrade a unit massof DPP, was found to be 198.8.4 8k4Jk mJg mgat a CDR werof 320 mW. A more detailed discussion on the relativeremoval efficiency and energy efficiency may be found inSection 3.2. 3.2 Process of degradation The NTP degradation of phthalates in the CDR is a resultof complex processes in the discharge region, such asdirect dissociation by electron impact, reactions withradicals, and other chemically reactive species formed inthe discharge such as O, OH, O3, and NO2. The finalproducts of NTP degradation are CO, CO2, H2O,... as itwas reported for radiolytic degradationand NTPdegradation process in water and soil as reported byQi et al.l46]TThese final degradation products are notdetectable by IMS due to their low proton and hydro-nium ion affinities. The degradation products of phthalates, which weredetected in the IMS spectra, had low intensities. For thisreason, as mentioned earlier, we were unable to use ourIMS-MS to identify them. Instead, the identificationwas performed on the basis of the reduced ion mobi-lities of the products. Han et al.471published IMS spectra of alcohols and their ion mobilities.On the basisof these data, we hypothesized that phthalate degrada-tion produced alcohols. To confirm our hypothesis, wealso obtained the IMS spectra of the correspondingalcohols (methanol, ethanol, 1- and 2-propanol), usingour IMS. The obtained data are presented in Figure 7.good agreement between the mobilities of thedegradation products and those of these alcohols is seenin Figure 7. DMP shown in Figure 4, ethanolI and2-propanol were detected. The methanol (2.18cm’vs,as seen in Figure 7) has ion mobility close to that of the RIs(2.21 cm’vs-), and we were not able to resolve it fromthe RIs. However, at higher discharge powers of CDR, weobserved a shift of the RI peak toward lower ion mobility,which indicates the presence of methanol. The degradationproducts were more pronounced in DEP and DPP;ethanoland 1-propanol were identified for DEP and ethanol and 2-propanol for DDP. The 2-propanol concentration achieves amaximum of 15-uA discharge current, and with furtherincrease of the current, it starts to disappear. We assumethat this is due to competition between 2-propanol forma-tion and decomposition, where the decomposition processstarts to prevail at higher discharge currents. The initial step in NTP degradation is the collisionsof electrons with the molecules, resulting in differentreactions such as ionization, dissociative ionization,neutral dissociation, and excitation. The ionizationreactions of phthalates were studied by several au-thors.[48-50] Two main mass spectral fragmentationpathways were identified. The first one is an alphacleavage of the molecular ion through a loss of alkoxylradicals (OR with R being alkyl substituents) and theaMcLafferty rearrangement withh a 100 Ion mobility (cm2.V-1.s-1) FIGURE 7 Reference IMS spectra ofmethanol, 2-propanol, 1-propanol, and ethanolwith the reduced ion mobilities at some selectedpeaks transfer of two hydrogen atoms through a loss ofR-2H: and There exist many more electron-impact processes re-sulting in the formation of a large number of neutral,excited, metastable, and ionic fragments. These speciescontinue to react mutually and form final degradationproducts. We have detected low concentrations of alcohols,such as methanol, ethanol,and 1- and 2-propanol. Theirpresence can be explained by a two-step process. The firststep is the alpha cleavage to generate alkoxyl radicalsOR (i.e.,OCH3, OC2H5, OC3H, for DMP, DEP, andDPD, respectively) by electron impact.l48,51,52] In thesecond step, the produced alkoxyl radicals subsequentlyreact with water, phthalates, or other hydrocarbon pro-ducts of degradation and are converted to alcohols. Forexample, a reaction of an alkoxyl radical with a watermolecule is given by The detected alcohols represent only a small fractionof the products. The majority of the products were notdetectable by IMS. However, the removal of the phtha-lates in CRD was detected efficiently using the IMStechnique. The efficiency of the degradation process may bequantified by a parameter called relative removal effi-ciency E, which is defined as the ratio of the decrementof the IMS peak intensity of a species of interest (i.e.,aphthalate in this study) to its initial intensity, that is, where I(0) is the initial IMS peak intensity of the phthalateand I(P) is the IMS peak intensity of the phthalate whenthe power supplied to the CDR was P. The relative removalefficiency Er is expressed in %. Figure 8 plots the relativeremoval efficiencies of DMP, DEP, and DPP as functions ofthe discharge power of the CDR used in this study. It is seen in Figure 8 that with an increasing dis-charge power, the relative removal efficiencies ofphthalates increase. The degradation of DMP was leastefficient, as it took about 3000 mW power to achieve 90%degradation, whereas it took 450 and 250 mW to achieve90% degradation of DEP and DPP. DMP and DEP re-moval efficiency is increasing almost linearly with thedischarge power in the log× scale, whereas in the case ofDPP, we see more complex behavior, which indicates thechanges in the process of degradation with the increasingdischarge power. This observation is in agreement withFigure 7, where we see the variation of the 2-propanolintensity with the discharge current. It should be noted,however, that the relative removal efficiency stronglydepends on the phthalate concentration. For this reason,we also calculated the energy efficiency for degradation,which is defined as the electric energy required to re-move a unit mass of a phthalate. The energy efficiencyfor degradation also depends on the power supplied tothe CDR. At the highest value of discharge power used inthis study for each phthalate, we have evaluated theenergy efficiencies for the degradation of DMP, DEP, andDPP as 229.27, 216.12, and 198.84kJ mg, respectively,as discussed in earlier sections. In light of both relativeremoval efficiency and energy efficiency for degradation,we found that DDP can be removed by the CDR mostefficiently, followed by DEP and then DMP. FIGURE 8 The relative removal efficienciesof phthalates as functions of the dischargepower of the CDR used in this study. The initialconcentrations for DMP, DEP, and DPP used inthis study were 3, 0.99, and 0.175 ppm,respectively. It should be noted that the relativeremoval efficiency strongly depends on theinitial concentration of the contaminant.CDR, corona discharge reactor; DEP, diethylphthalate; DMP, dimethyl phthalate; DPP, dipropyl phthalate 4 CONCLUSIONS In this study, we used positive-polarity DC CDs to de-grade three types of phthalates, that is, DMP, DEP, andDPP, at ppm-or sub-ppm-level concentrations in air andevaluated the efficiencies of their degradation as func-tions of the discharge current or power of the CDR, usingIMS. The high sensitivity (in the ppb range) and fastresponse (in the ms range) of IMS allowed the real-timemeasurement of the change in ppm- or sub-ppm-levelphthalate concentrations and the prompt detection ofdegradation byproducts. Such data would be inaccessiblewith conventional chromatographic or mass spectro-metric techniques. Using sample gases (i.e., workinggases)) containing 3ppm DMP, 0.99ppm DEP, and0.175ppm DPP, we performed NTP degradation ofphthalates in air with the CDR described in Section 2.1.With the single-step degradation process by the CDR, weachieved a relative removal efficiency of up to 96% andenergy efficiencies of degradation of 229.27, 216.12, and198.84 kJ mg, for DMP, DEP, and DPP, at the highestpower used in the experiments for each phthalate in thisstudy, respectively. It should be noted that both relativeremoval efficiency and energy efficiency for degradationdepend strongly on the pollutant concentration andpower consumption of the CDR. In general, these effi-ciencies increase with an increasing concentration of thepollutant in air and increasing power. In other words, itis more challenging to achieve high efficiency for low-concentration pollutants. Although there is much room for further improve-ment of the efficiency of the CDR used in this study, it isinteresting to note that a single-step degradation processwith the simple CDR was able to achieve such high re-lative removal efficiencies for phthalate vapors at ppm-or sub-ppm-level concentrations. Furthermore, it is alsonoteworthy that the relative removal efficiencies andenergyyeefficiencies for theedegradation of low-concentration phthalates in air by the CDR were eval-uated with high accuracy and efficiency, owing to thehigh sensitivity and fast response of IMS. We have also detected some byproducts of the de-gradation process, which were tentatively identified asalcohols (methanol, ethanol, and 1- or 2-propanol). Theconcentrations of these byproducts were so low that theidentification of these species would have been difficult,if not impossible, with other conventional mass spec-troscopy. The detection of these byproducts implies thatthe degradation process involves a two-step process toproduce alcohols: An electron-impact dissociation (ordissociative ionization) of phthalates to generate alkoxylradicalss and their subsequent reactions with watermolecules to form alcohols. Other reaction paths of degradation whose byproducts cannot be detected bypositive-polarity IMS need to be studied further withdifferent diagnostics, which is beyond the scope of thepresent study. As discussed earlier, the low-concentration phtha-lates in air studied in this study are ecological hazardsand sufficiently harmful to human health and the en-vironment at the ppm or sub-ppm level. The degradationof such substances, therefore, must be performed inrealistic conditions, as we did in this study. In morepractical applications, the NTP degradation of pollutantsmust be performed in the actual environment, where theinteraction of hazardous substances with our ecologicalsystem must be minimized. Although the experimentspresented in this study were performed in the laboratory,the high portability and relatively low cost of an IMSwould also allow the analyses of low-concentrationcontaminants in air and their degradation by NTPs insuch an environmental field. ACKNOWLEDGMENTS This study was supported by the Slovak Research andDevelopment Agency (contract no. APVV-17-0318 andAPVV-19-0386) and the Slovak Grant Agency forScience (contract no. VEGA 1/0417/15). Partial supportfrom the European Union's Horizon 2020 research andinnovation program under the Marie Sklodowska-Curiegrant agreement No 674911, the European UnionsHorizon 2020 research and innovation program undergrant agreement No. 692335, Osaka University Inter-national Joint Research Promotion Programs (Type A),Japan Society of the Promotion of Science (JSPS)Grant-in-Aid for Scientific Research(S) 15H05736, andJSPS Core-to-Core Program JPJSCCA2019002 is alsoacknowledged. CONFLICT OF INTERESTS The authors declare that there are no conflict of interests. AUTHOR CONTRIBUTIONS All authors listed have made substantiall and in-tellectual contributions to the work. Ladislav Moravskyperformed the investigation and wrote a draft, BartoszMichalczuk and Jana Hrda performed the investiga-tion, Satoshi Hamaguchi reviewed, revised, and editedthe draft, and Stefan Matejcik reviewed, revised, andedited the draft, and was in charge of the projectmanagement. DATA AVAILABILITY STATEMENT The data that support the findings of this study areavailable from the corresponding author upon reasonablerequest. ( Ladislav Moravsky h ttps://orcid.org/0000-0003-2579-5607 ) ( Bartosz Michalczuk https://orcid.org/0000-0003-155 4 -3043 ) ( Satoshi Hamaguchi h tt p s://orcid.org/ 0 000-000 1 -6580-8797 ) ( Stefan Matejik http://orcid.org/0000-0001-7238-5964 ) ( REFERENCES ) ( [1] P. Gerbaux, J. de Winter , R . Flammang, V . S. Nguyenb,M. T . N guyenb, Int. J. Mass Spectrom. 2010, 2 9 0, 1 2 7. ) ( [2] Z. Wang, Y. Shao, N. Gao, X . Lu, N. An, Chemosphere 2018, 193,602. ) ( 3] H. Ohtani, I . Miura, Y. Ichikawa,E n viron. H e alth Perspect. 2000,108, 1 189. ) ( 4 J. C. Hubinger, D . C. H a very, J. C o smet. Sc i . 2 0 06, 57, 127. 5 ) ( 5] K. Sun, J. Jin, M. Keiluweit , M. Kleber, Z . Wang, Z. Pan, B. Xing, Bioresour. Technol. 2 012, 1 18, 1 20. ) ( 6] S. Venkatesh, C . C. Y e ung, Q. J. Su n , J. Zh u ang, T. Li,R. K . Y. L i, R. Vellaisamy, S ens. Actuators, B 2018, 259, 650. ) 7R. Hauser, A. Calafat, Occup. Environ. Med. 2005, 62,806.89 ( T. Schettler, Int. J . Androl. 2006, 29, 134. ) ( European Union, Council Regulation (EEC), No. 79 3 /93 of 23 March 1993 on the evaluation and control of the risks of existing substances (OJ L 84, 5 April 1 9 93), European Un i on,Brussels. ) ( [10] J. Wang, L. C hen, H . S h i, Y . Q i an, C h emosphere 2000, 41, 1245. ) ( [11] S . Jobling, T. Reynolds, R. White, M. G. Parker,J. P. Sumpter, Environ. Health P e rspect. 1995, 1 0 3, 5 8 2. ) ( [12] B. Yuan, X . L i , K. L i , C .h W u qiang, Co l loids Surf. A: Physicochem. E n g. A s pects 2011, 379, 15 7 . ) ( [13] SS. Yuan, C. Liu , C. S. Liao , B. V. Chang , Chemosphere 2002, 49, 1 295. ) ( 14 T . K. Lau, W. Chu, N. Graham, Chemosphere 2005, 60,1045. ) ( [15] G. P. Yang, X. K. Zhao,X. J. Sun, X. L. Lu, J. Hazard. Mater. B 2005, 126, 1 12. ) ( |16| S. Kaneco, H. K atsumata, T. S uzuki, K . O hta, Chem.Eng. J. 2006,125,59. ) ( [17] N. D aneshvar, M . A. Behnajady, A. Y. Zorriyeh, J. Hazard.Mater. 2 007, 1 39, 275. ) ( [18]S. Zhang, H. J i ang, M . L i , H. Yu, H . Y i n, Q. Li, Environ. S c i. Technol. 2007, 4 1, 1977. ) ( 19] M. H . W u, N. Liu, G . X u, J . Ma, L. Tang, L. Wang, H. Y. Fu, Radiat. Phys. Chem. 2011, 80,420. ) ( |20 N. Adhoum, L. Monser, Sep. Purif. Technol. 2004, 38,233. ) ( [21] B . Xu, N . G ao, H. C h eng, S. Xia, M . Rui, D. Z h ao, J. Hazard. Mater.2009, 162, 9 54. ) ( [22] M. L eins, L . A lberts, M. Kaiser, M . Walker, A . S c hulz, U. Schumacher, U. Stroth, P o lymers 2009, 6, S227. ) ( |23| S. Schmid, M . C. Jecklin, R. Zenobi, Chemosphere 2 0 10, 79,124. ) ( 24 X. L. Gang, X. Weiping,WW. R ongbing,N. Mingjiang,D. Changming, G . X i ang, L . Z h ongyang, C. Kefa, Pl a sma Chem. Plasma Process. 2014, 34, 1 033. ) ( 25| T . Wang, G . Qu, X. Yin, Q . Sun, D. Liang, X. G uo, H. Jia, J. Hazard. M ater.2 0 18, 357, 279. ) ( 26 I. V. Lisitsyn, H. Nomiyama, S. Katsuki, H. Akiyama, Rev. Sci . Instrum. 1999, 7 0, 3457. ) ( |27| P. Bruggeman, C . L e ys, J. P hys. D : A ppl. Phys. 2 009, 4 2, 053001. ) ( Y. Zhang, M. Zhou, X. H ao, L. Lei, Chemosphere 2007,67,702. ) ( 28 M. M agureanu, D . Piroi, N. B . NMandache, V . David,A. M edvedovici, V. I. P a rvulescu, Wa t er Res . 2010, 44, 3445. ) ( 30| ) ] K. K itano, H . Aoki, S. Hamaguchi, Jpn. J. Appl. Phys. 2006, 45, 8 294. ) ( [31] H. A oki, K . Kitano, S . H amaguchi, P l asma S o urces Sci.Technol. 2008, 17,025006. ) ( 32 J. Li, T . Wang, N. Lu, D. Zhang, Y. Wu, T. Wang, Plasma Sources Sci. Technol. 2011,20,034019. ) ( 33] T . C. Wang, G. Qu, J. R en, Q. Yan, Q. S u n, D . L i ang, S. Hu, Water Res. 2016, 89,28. ) ( 34 J. Fischer, K. Ventura, B. Prokes, P. Jandera, Chromatographia 1993,37,47. ) |35 J. H. Petersen, T. Breindahl,Food Addit. Contam.2000,17,133. ( 36| M .J . Silva N. A . M a lek, C. C. Hodge, J. A. Re i dy, K. Ka t o,C. B . Barr, J. Chromatogr. B : Anal. Technol. Biomed. Life Sci. 2003,789,393. ) ( 37 M. S tano, E . Safonov, M. K ucera, S . Matejik, C hem. Listy 2008,102, s 1414. ) ( M. S abo,S . Matejcik, Anal. Chem. 2011, 83, 1985. ) ( M. Sabo, S. Matejik, Analyst 2013, 1 38, 6907. ) ( B. Michalczuk, L. M o ravsky, J. Hr d a, S. Matejik, Int . J. Mass Spectrom. 2020, 449, 11 6275. ) ( |41| B . Michalczuk, L . Moravsky, P . Papp, P . Mach, M . Sabo,S. Matejcik, Phys. C hem. C h em. Ph y s. 2019, 21, 13 6 79. ) ( 42 B. Michalczuk,N M. S Sabo, K. J Jatzova. L. Moravsky, M. Gregorova, S. M atejcik, Talanta 2 020, 209, 120567. ) ( [43] G. E iceman, E. G. N a zarov, J. A . S t one, Anal. C h im. Acta 2003,493,185. ) ( |44 C. G obble, J. C hickos, S. P . Verevkin, J. C hem. Eng. Data . 2014, 59,1353. ) ( 45 5 ] I. T. Cousins, D. Mackay, T. F. Parkerton, Handbook ofEnvironmental Chemistry,Vol. 3, P a rt Q, Springer, N ew York,NY 2003, pp. 57-84. ) ( 46 Z. H . Qi, L . Yang, Y . X i a, Z . F . D i ng, J. H. Ni u , D. P. Liu, Y . Zhao, L. F. Ji, Y. Song, X . S. L in, E nviron. Sci.: W ater R e s. Technol. 2019, 5,920. ) ( 47| 7 H . Y . H an, G . D . Huang, S . P. J in, P. C. Zheng, G. H. Xu,J. Q. Li, H. M. Wang, Y. Chu, J. E n viron. S c i. 2007, 1 9 , 751. J. Yinon, Org. Mass Spectrom. 1988, 23, 755. ) ( 49 ] S. C. L eung, B. Y . Giang, Bull. E nviron. Contam. To x icol. 1993,50,528. ) ( 50 P. Yin, H. Chen,X. L i u, Q. Wang, Y. Jiang, R. Pan, Ana. Lett. 2014,47, 1 579. ) ( 51| Y. A. J eilani, B. H. Cardelino, V. M. I beanusi, J. Am. S oc. Mass Spectrom.2011, 2 2 , 1999. ) ( |52 M . L acko, P. P a pp, S. Ma t ejik, J. Ch e m. Phy s . 2018, 148, 214305. ) ( How to cite this article: L. Moravsky, B. ) ( Michalczuk, J. Hrdá, S. Hamaguchi, S. Matejtik.Monitoring of nonthermal plasma degradation ofphthalates b y ion m obility spectrometry.Plasma Processes Polym. 2021;e2100032. ) ( https://doi.org/10.1002/ppap.202100032 ) 离子迁移谱法用于监测电晕放电对邻苯二甲酸酯蒸气的降解。在电晕放电反应器(线对圆筒的几何形状)中,在环境空气中以直流正极性检查了三种不同的邻苯二甲酸盐(二甲基[DMP],二乙基[DEP]和二丙基[DPP])。对于DMP,DEP和DPP,分别达到了高达96%的相对去除效率和229.27、216.12和198.84 kJ mg -1的能量降解效率。还可以检测到极低密度的副产物,例如甲醇,乙醇,1-丙醇和2-丙醇。确定的降解过程涉及两个步骤:(i)邻苯二甲酸酯的电子轰击解离成烷氧基自由基;(ii)烷氧基自由基与水分子反应形成醇。
关闭-
1/11
-
2/11

还剩9页未读,是否继续阅读?
继续免费阅读全文产品配置单
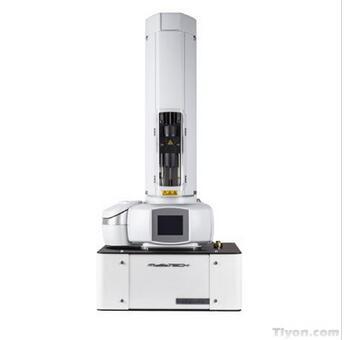
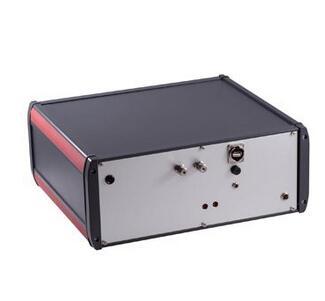
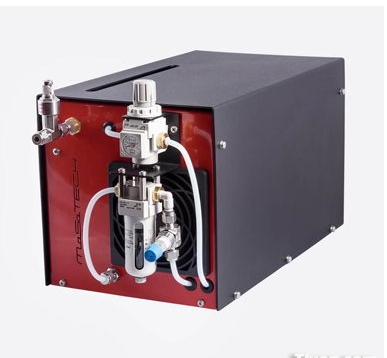
图拉扬科技有限公司为您提供《环境中邻苯二甲酸酯检测方案(离子迁移谱仪)》,该方案主要用于空气中有机污染物检测,参考标准《暂无》,《环境中邻苯二甲酸酯检测方案(离子迁移谱仪)》用到的仪器有MCCGC-AIMS PeakMachine气相离子迁移谱、PAIMS离子迁移谱系统、masa零级空气发生器。
我要纠错
推荐专场

相关方案
 咨询
咨询