
方案详情文
智能文字提取功能测试中
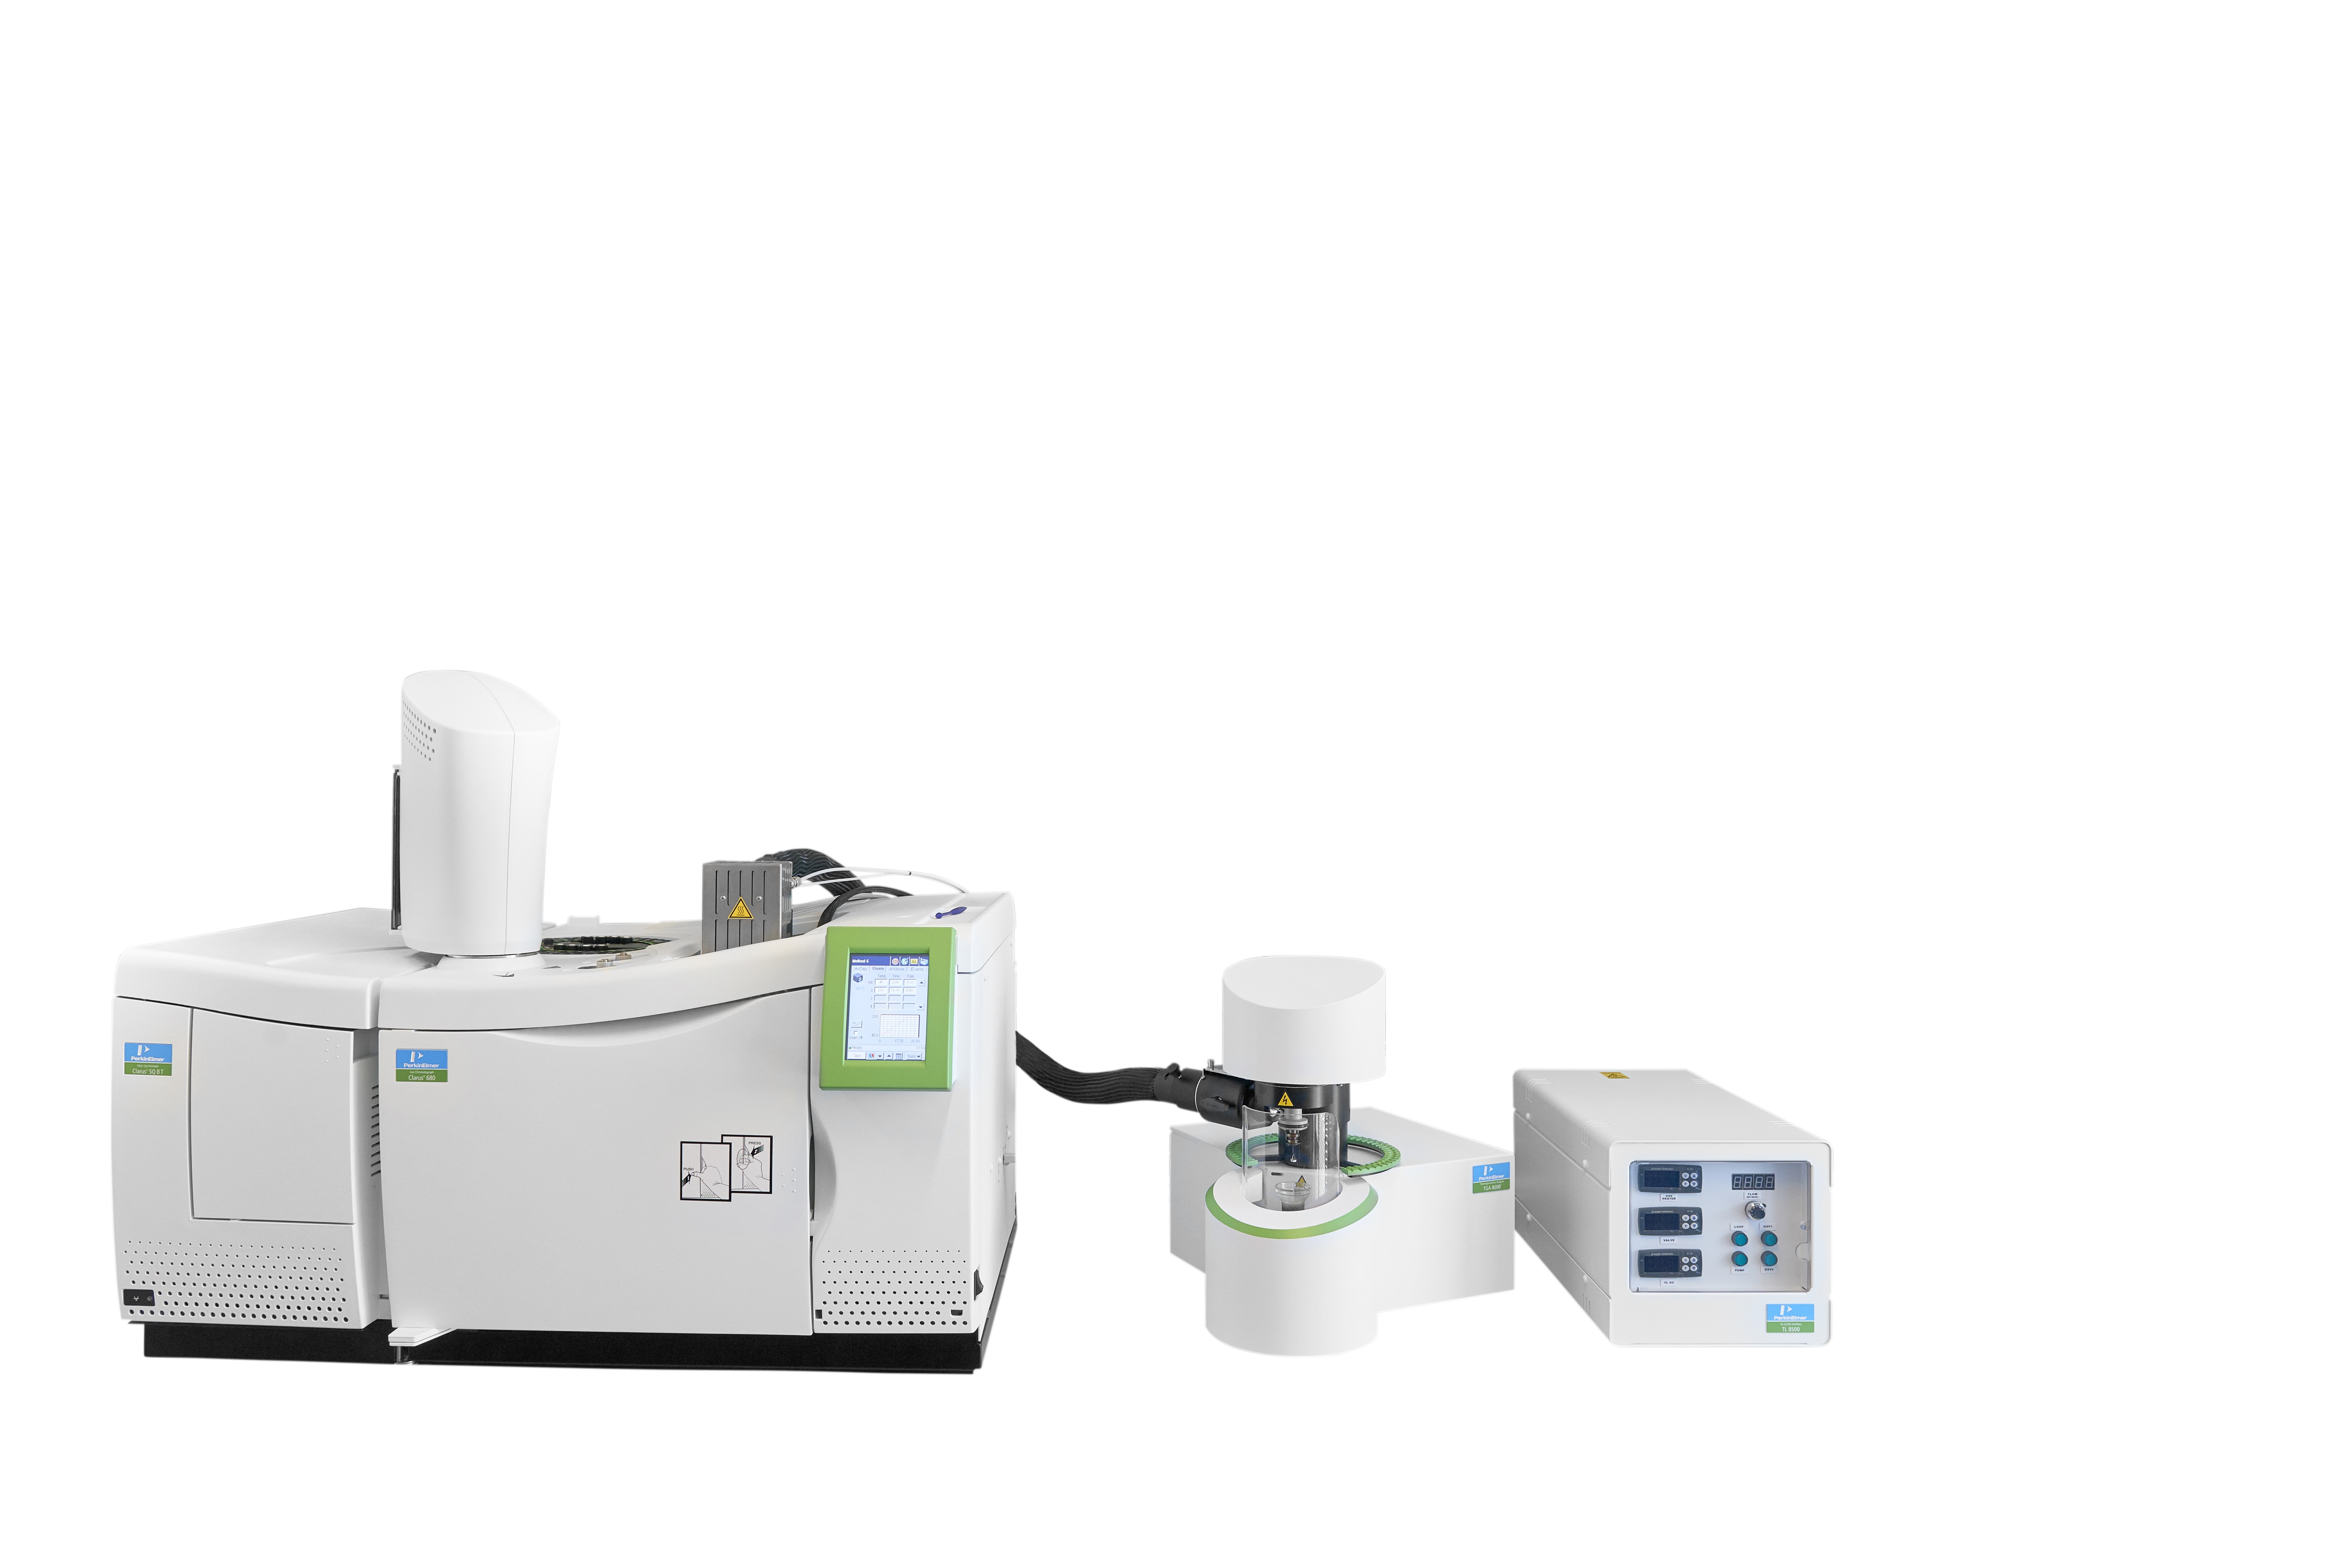
TG-IR Analysis - ExperimentalCopyright C2000-2010, PerkinElmer, Inc. All rights reserved. PerkinElmer is a registered trademark of PerkinElmer, Inc. All other trademarks are the property of their respective owners.008640B01 TG-IR Analysisof Layers ofaCable Used in theAutomotive Industry PerkinElmer was given a sample of a cable used in theautomotive industry. The purpose was the identification ofthe polymer used to form the external sheath of the cable.The cable is composed of five concentric layers disposed inthe following sequence: rubber, fabric, rubber, fabric, rubber.As the polymeric material of the cable is carbon black filled, its identification by infrared spectroscopy was not applicable. Thus we decided to use the TG-IR technique, as it allowsthe identification of a material through its decomposition products. Such analysis is completely free frominterferences due to the presence of carbon. TG-IR Analysis - Sample Preparation There is no particular sample preparation needed for TG-IR analysis. A sharp scalpel is used to remove a small partof the external rubber sheath (about 26 mg). As general rule, in order to be able to identify gas released in limited quantities, the mass of a sample for TG-IRanalysis must range between 10 and 30 mg. A too small sample can prevent a correct analysis, while a too largesample can lead to incomplete combustion (or pyrolysis) of that part of the sample not undergoing the gas flow. While under nitrogen flow (100 mL/min), the sample is heated at arate of 20 ℃/min. During the TGA analysis process, spectra of the gas released bythe sample are acquired at a sampling frequency of one spectrumevery 4 seconds, and with a spectral resolution of 4 cm-1. TG-IR Analysis - Discussion of the Results The TGA analysis and the intensity profile of the gases releasedby the sample are discussed. Three main weight losses are seen:the first around minute 15, the second around minute 24, and thethird around minute 29. Together with the weight loss, three TG-IRpeaks are detected: hence the sample degrades while releasing gas. Let us now analyse the details of the acquired spectra, and thenproceed to the identification of the released gases. Ten minutes after start up of the analysis (T=200℃) there isa slight decline in the derived curve: from this point onward thespectra show the stretching band of the -CHzand -CHs (peak A)groups; a limited CO2 generation reaching a maximum at minute15 (Figures 1 and 2) is also observed. 严 The carbon dioxide peak probably derives from the COz loss of thevinyl-acetic group of the polymer; the peak related to the organicpart could originate from the evaporation of an additive or anearly decomposition of the polymeric matrix. This last hypothesiswould also appear to be supported by the fact that immediately. after, a marked generation of HCl occurs. See the followinggraphs: In Figure 3 the intensity profiles related to hydrochloricacid and A peak are compared; Figure 4 shows the HCl spectrumsuperimposed on the A peak as it appears before data processing.Figure 5 shows the HCl band after the subtraction of peak A Hydrochloric acid emission during the analysis confirms the presenceof chlorine in the sample. Let us now pass to the analysis of the gases released during thesecond important weight loss, occurring around minute 24 (about500℃). At this temperature, the polymer decomposes markedly,giving off different gases due to chain fragmentation: the presenceof methane, ethylene and medium-short alkyl chain fragmentscan be noted. Obviously, the spectra of these gases are partiallyoverlapping. To identify the chemical species, please see the followinggraphs:(6) shows the spectra of the spectra atlas, and the spectrumrecorded at minute 24.4, (7) shows the profiles relative to each ofthe gases. Once the generation of these gases is over, from 27 minutesonwards and until the end of the analysis, emission of CO2 andtraces of CO can be detected. Figure 1. Released gases. Figure 2. Peak A shows the stretching of-CH,and-CH, groups; and CO, peak. These experiments were performed using the Pyris"1 TGA.PerkinElmer offers both Thermal Analysis and IR for better andmore complete sample characterization from a single supplier. Figure 7. Gas profiles superimposed. Figure 3. Intensity profiles of released gases. Figure 4. HCl spectrum superimposed on Peak A. Figure 8. CO, profile. Figure 5. HCl band after Peak A subtracted. Figure 9. Gas profiles of CO, and traces of CO. Figure 6. Atlas of spectra. The appendix shows several graphical representations of theanalyses that for space saving reasons were not presented onthe previous pages. False color map relative to the generation of hydrochloric acid. Stack plot centered on the band at 2950 cm", between 21.5 and 28.0. PerkinElmer, Inc. 940 Winter StreetWaltham, MA 02451 USAP: (800)762-4000 or(+1) 203-925-4602 www.perkinelmer.com For a complete listing of our global offices, visit www.perkinelmer.com/ContactUs
关闭-
1/4

-
2/4

还剩2页未读,是否继续阅读?
继续免费阅读全文产品配置单
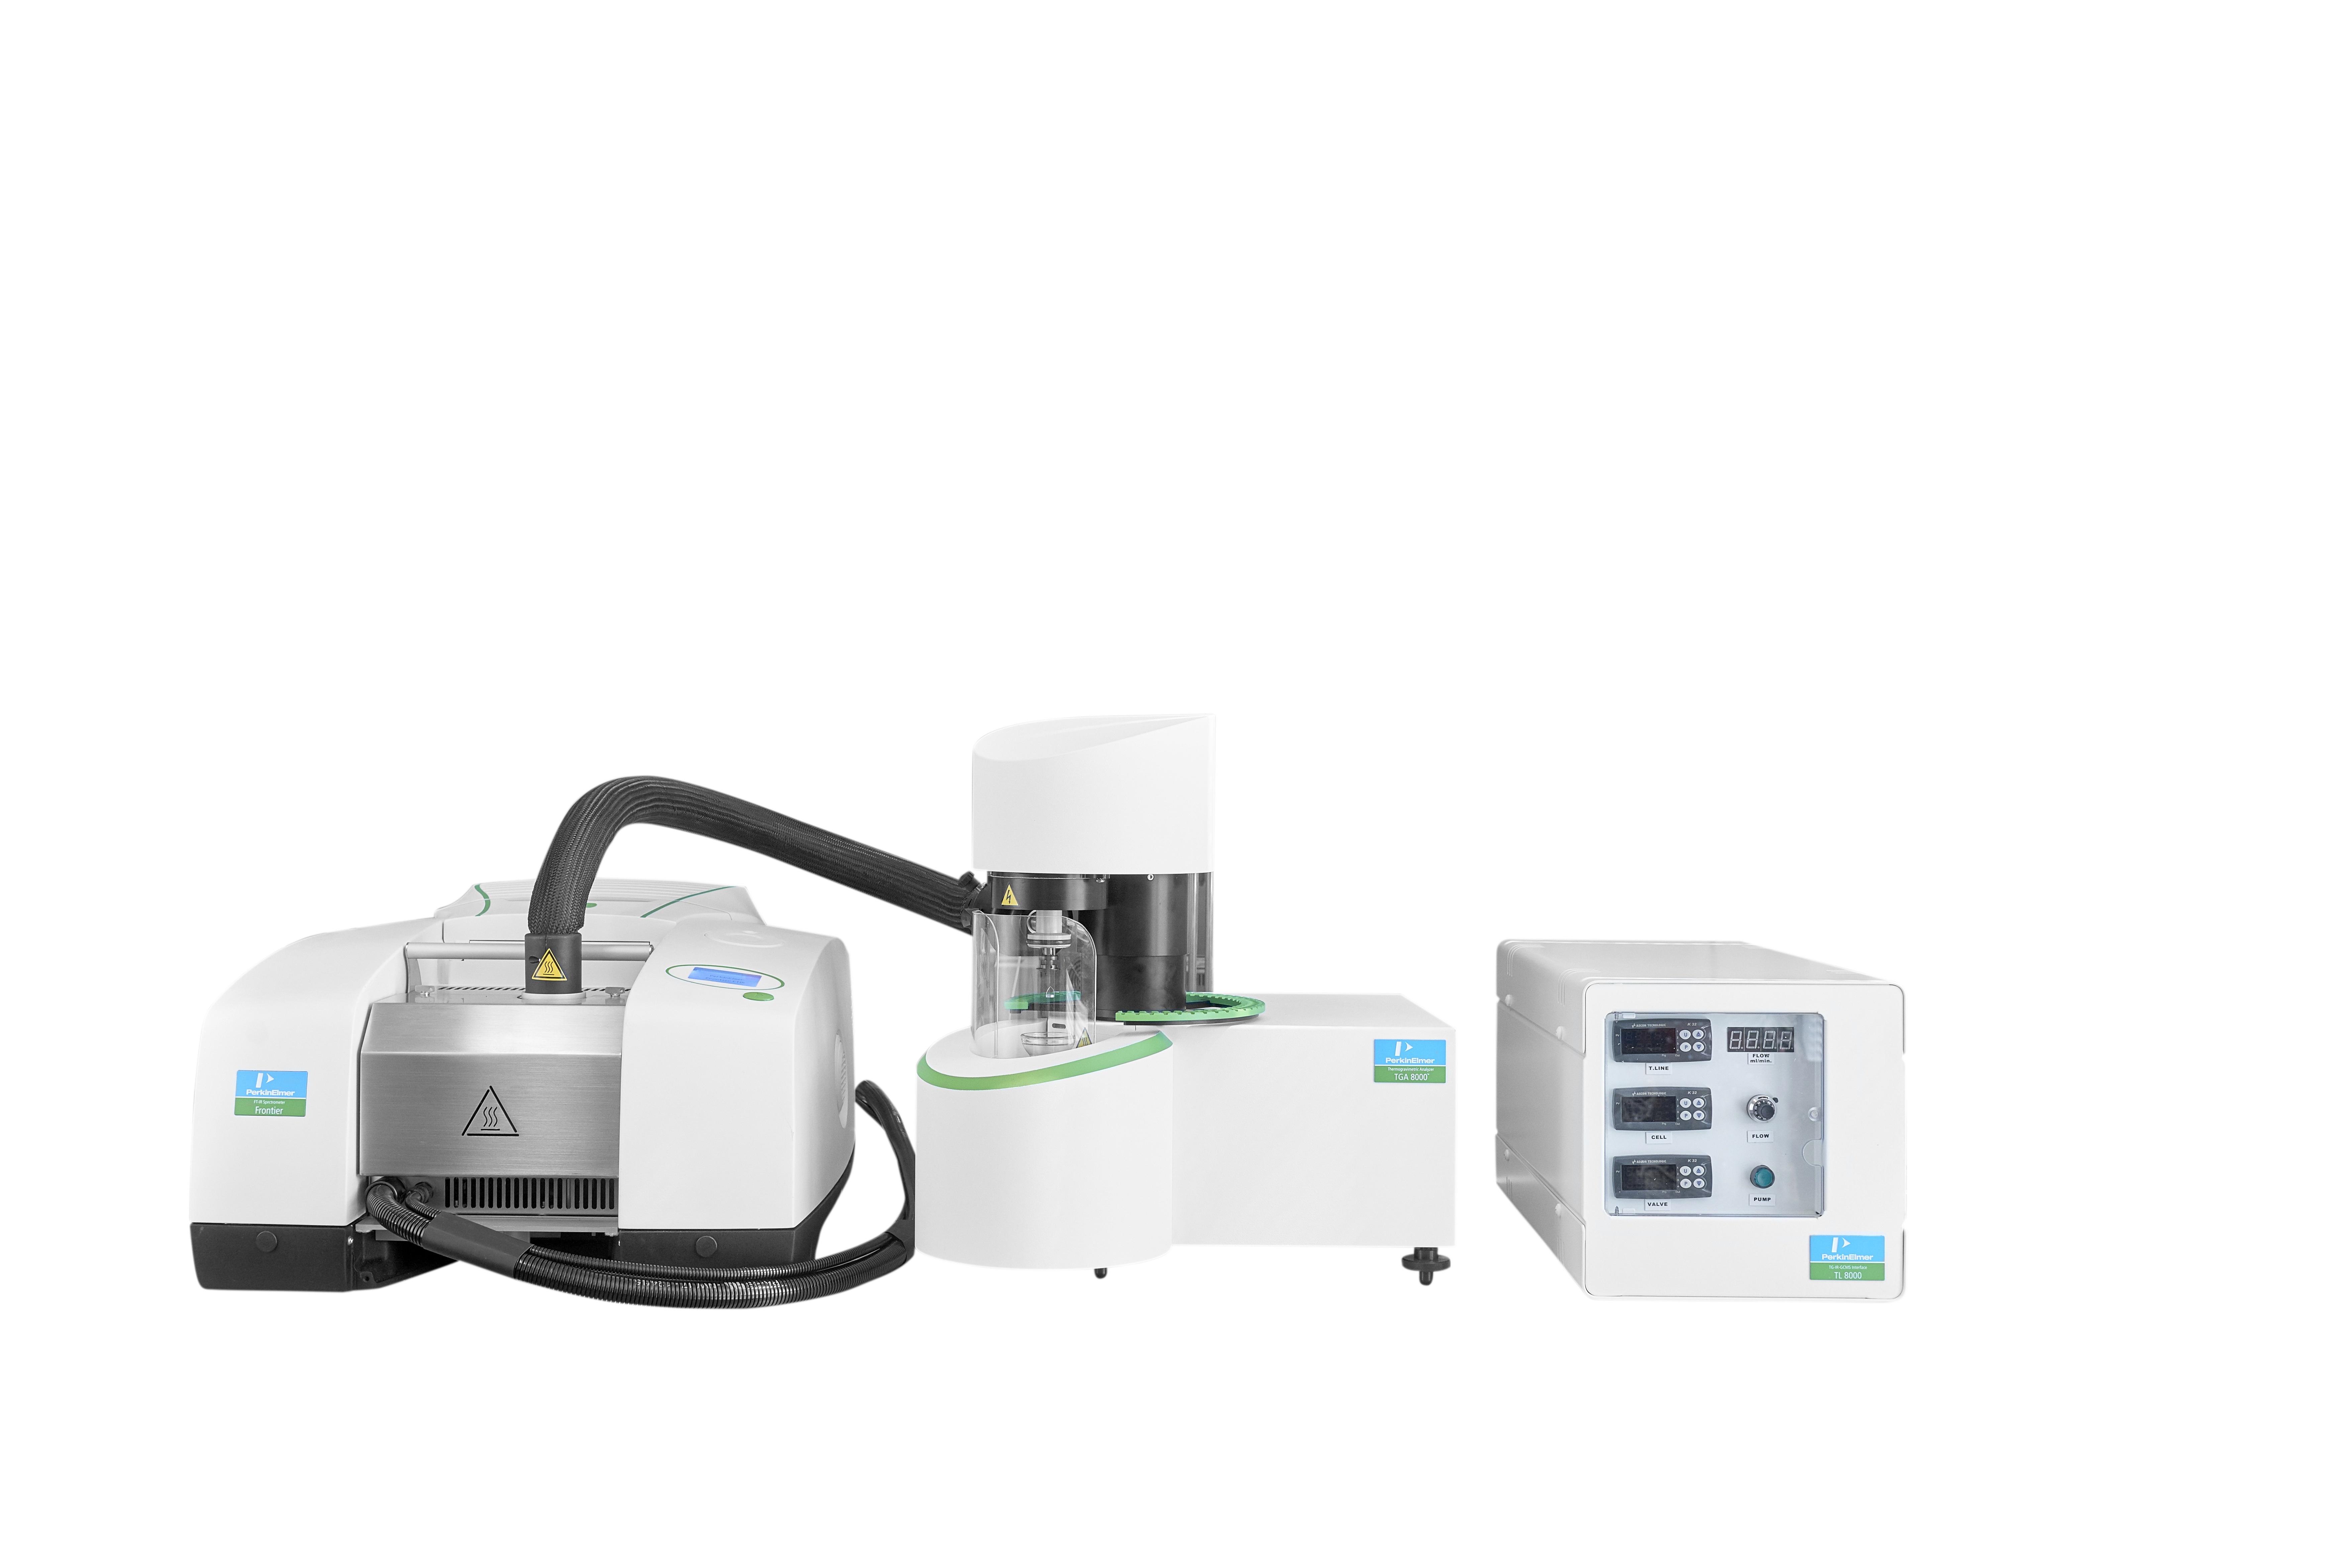
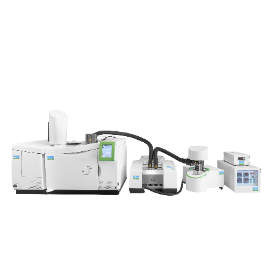
珀金埃尔默企业管理(上海)有限公司为您提供《电缆外层中TG-IR分析检测方案(热分析联用仪)》,该方案主要用于汽车电子电器中可靠性能检测,参考标准《暂无》,《电缆外层中TG-IR分析检测方案(热分析联用仪)》用到的仪器有热重红外联用技术TG-IR。
我要纠错
推荐专场
相关方案
 咨询
咨询