

方案详情文
智能文字提取功能测试中
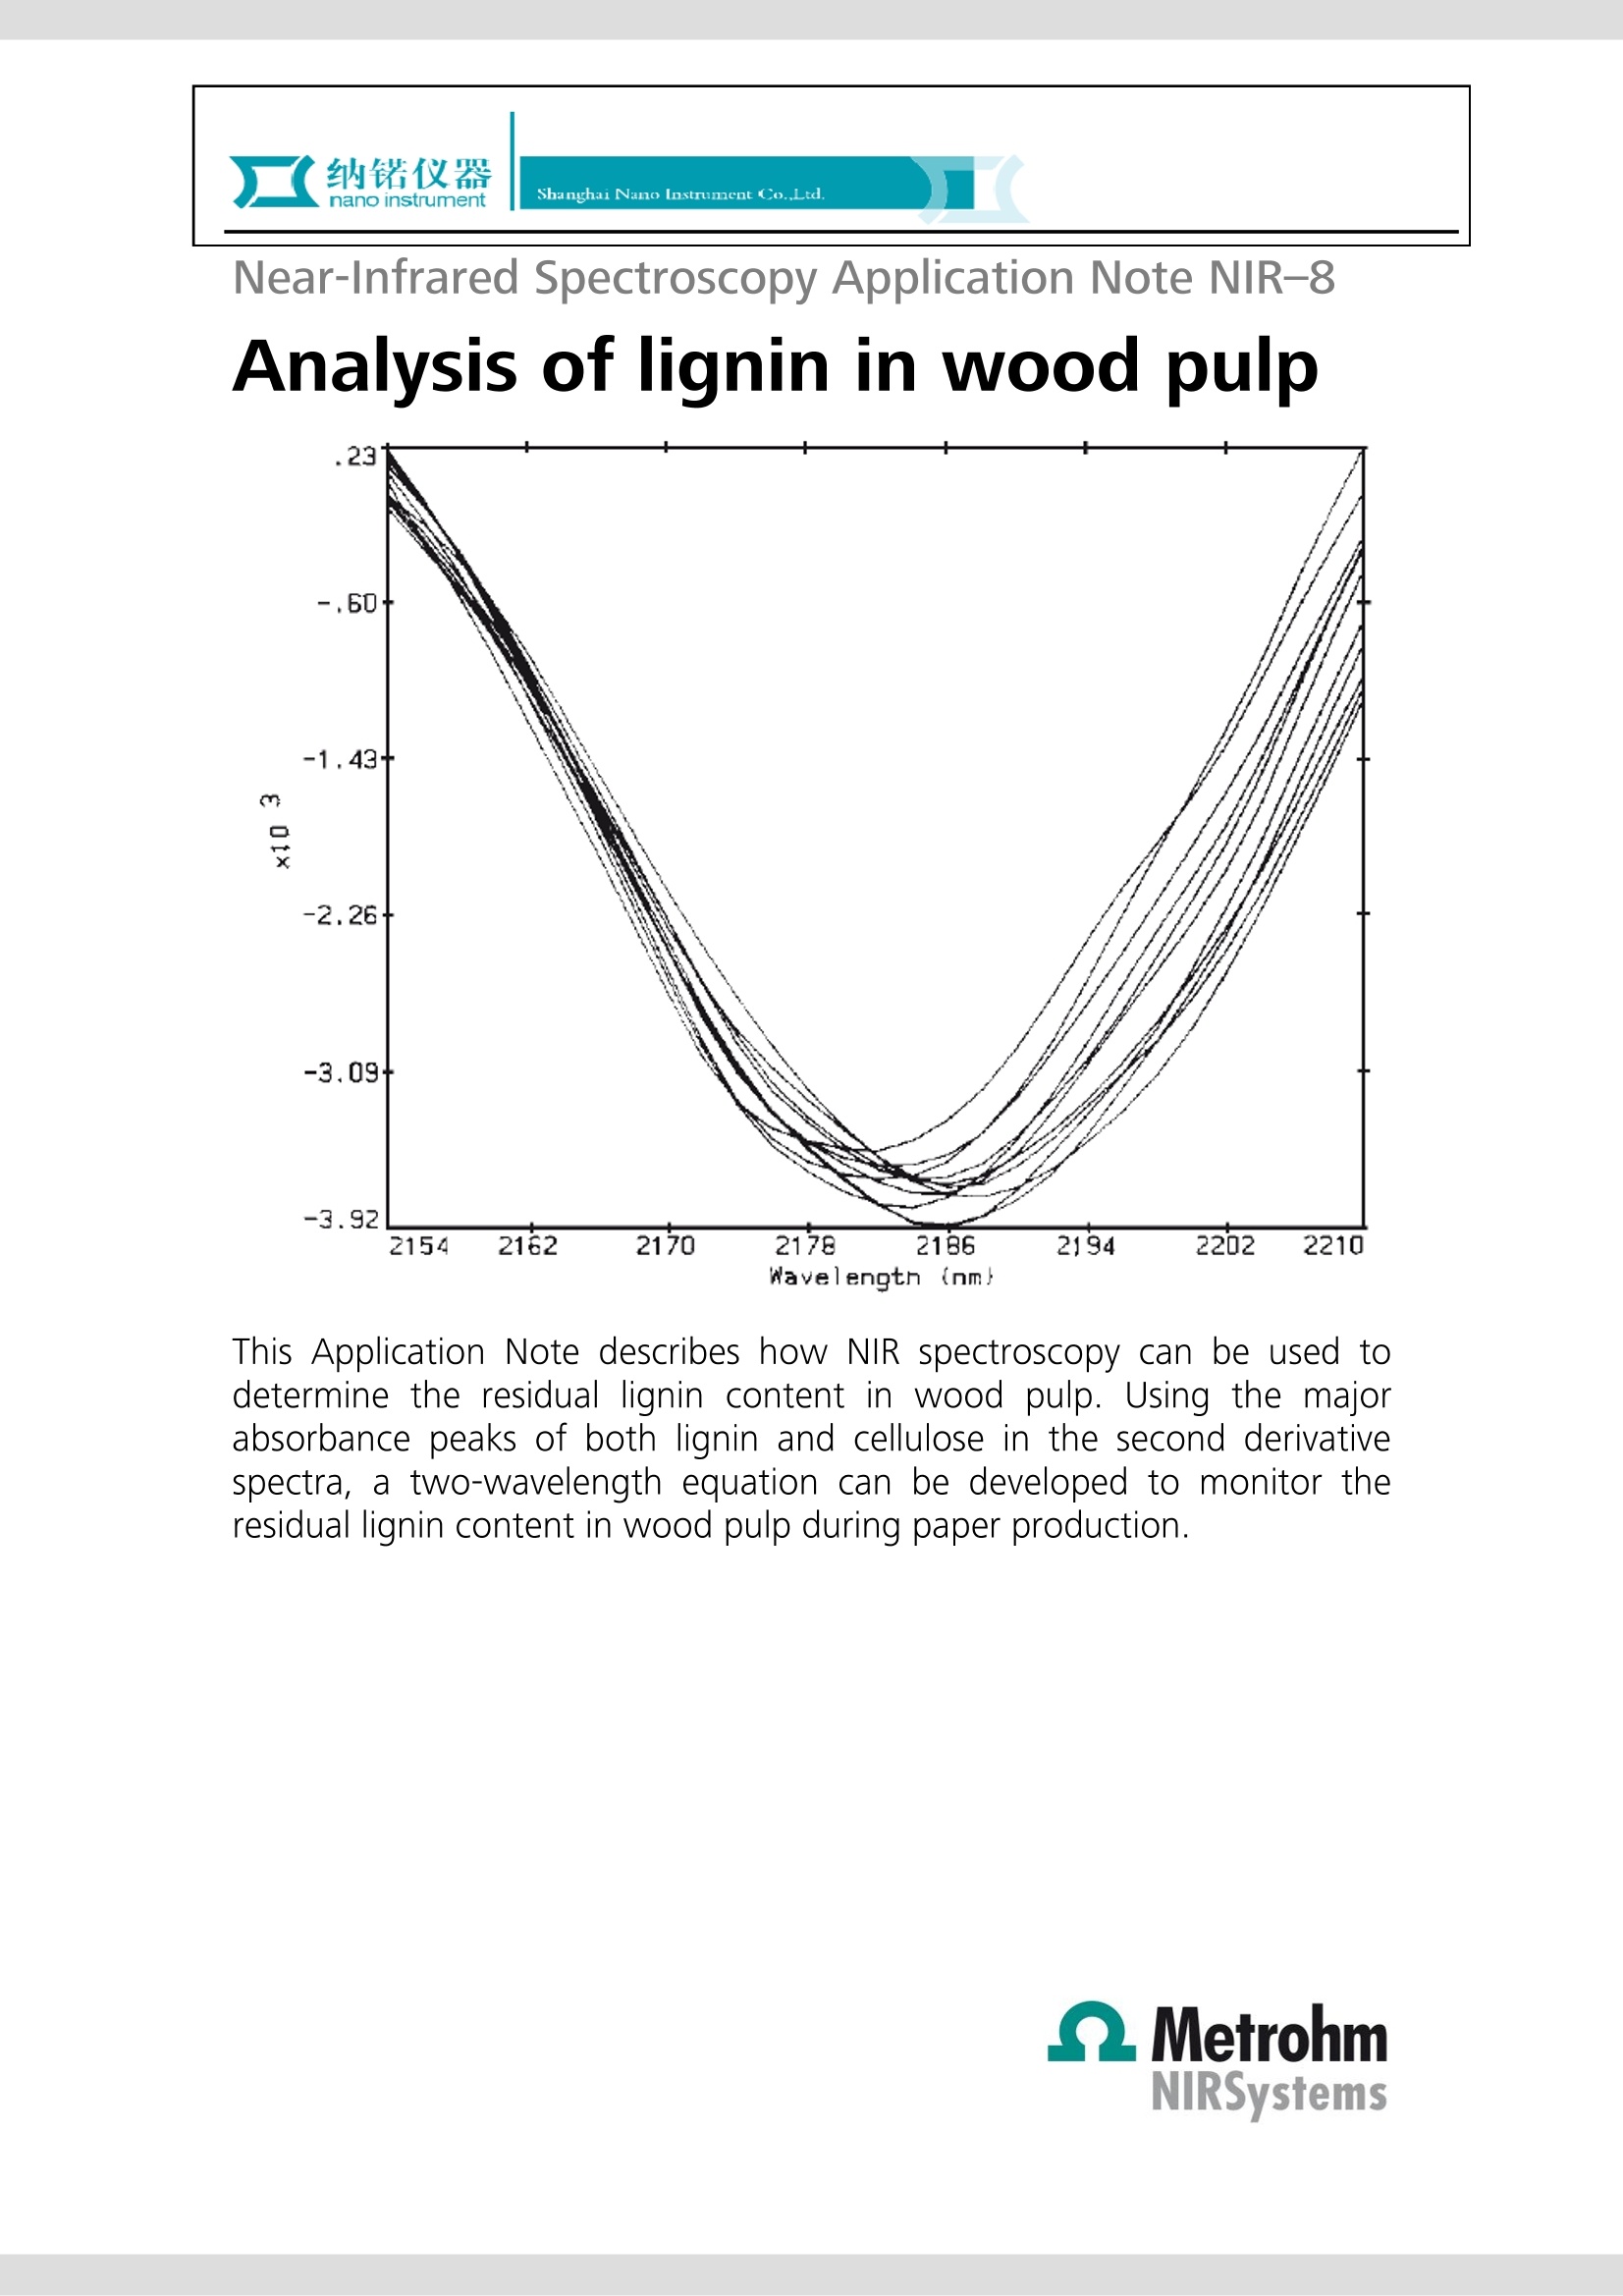
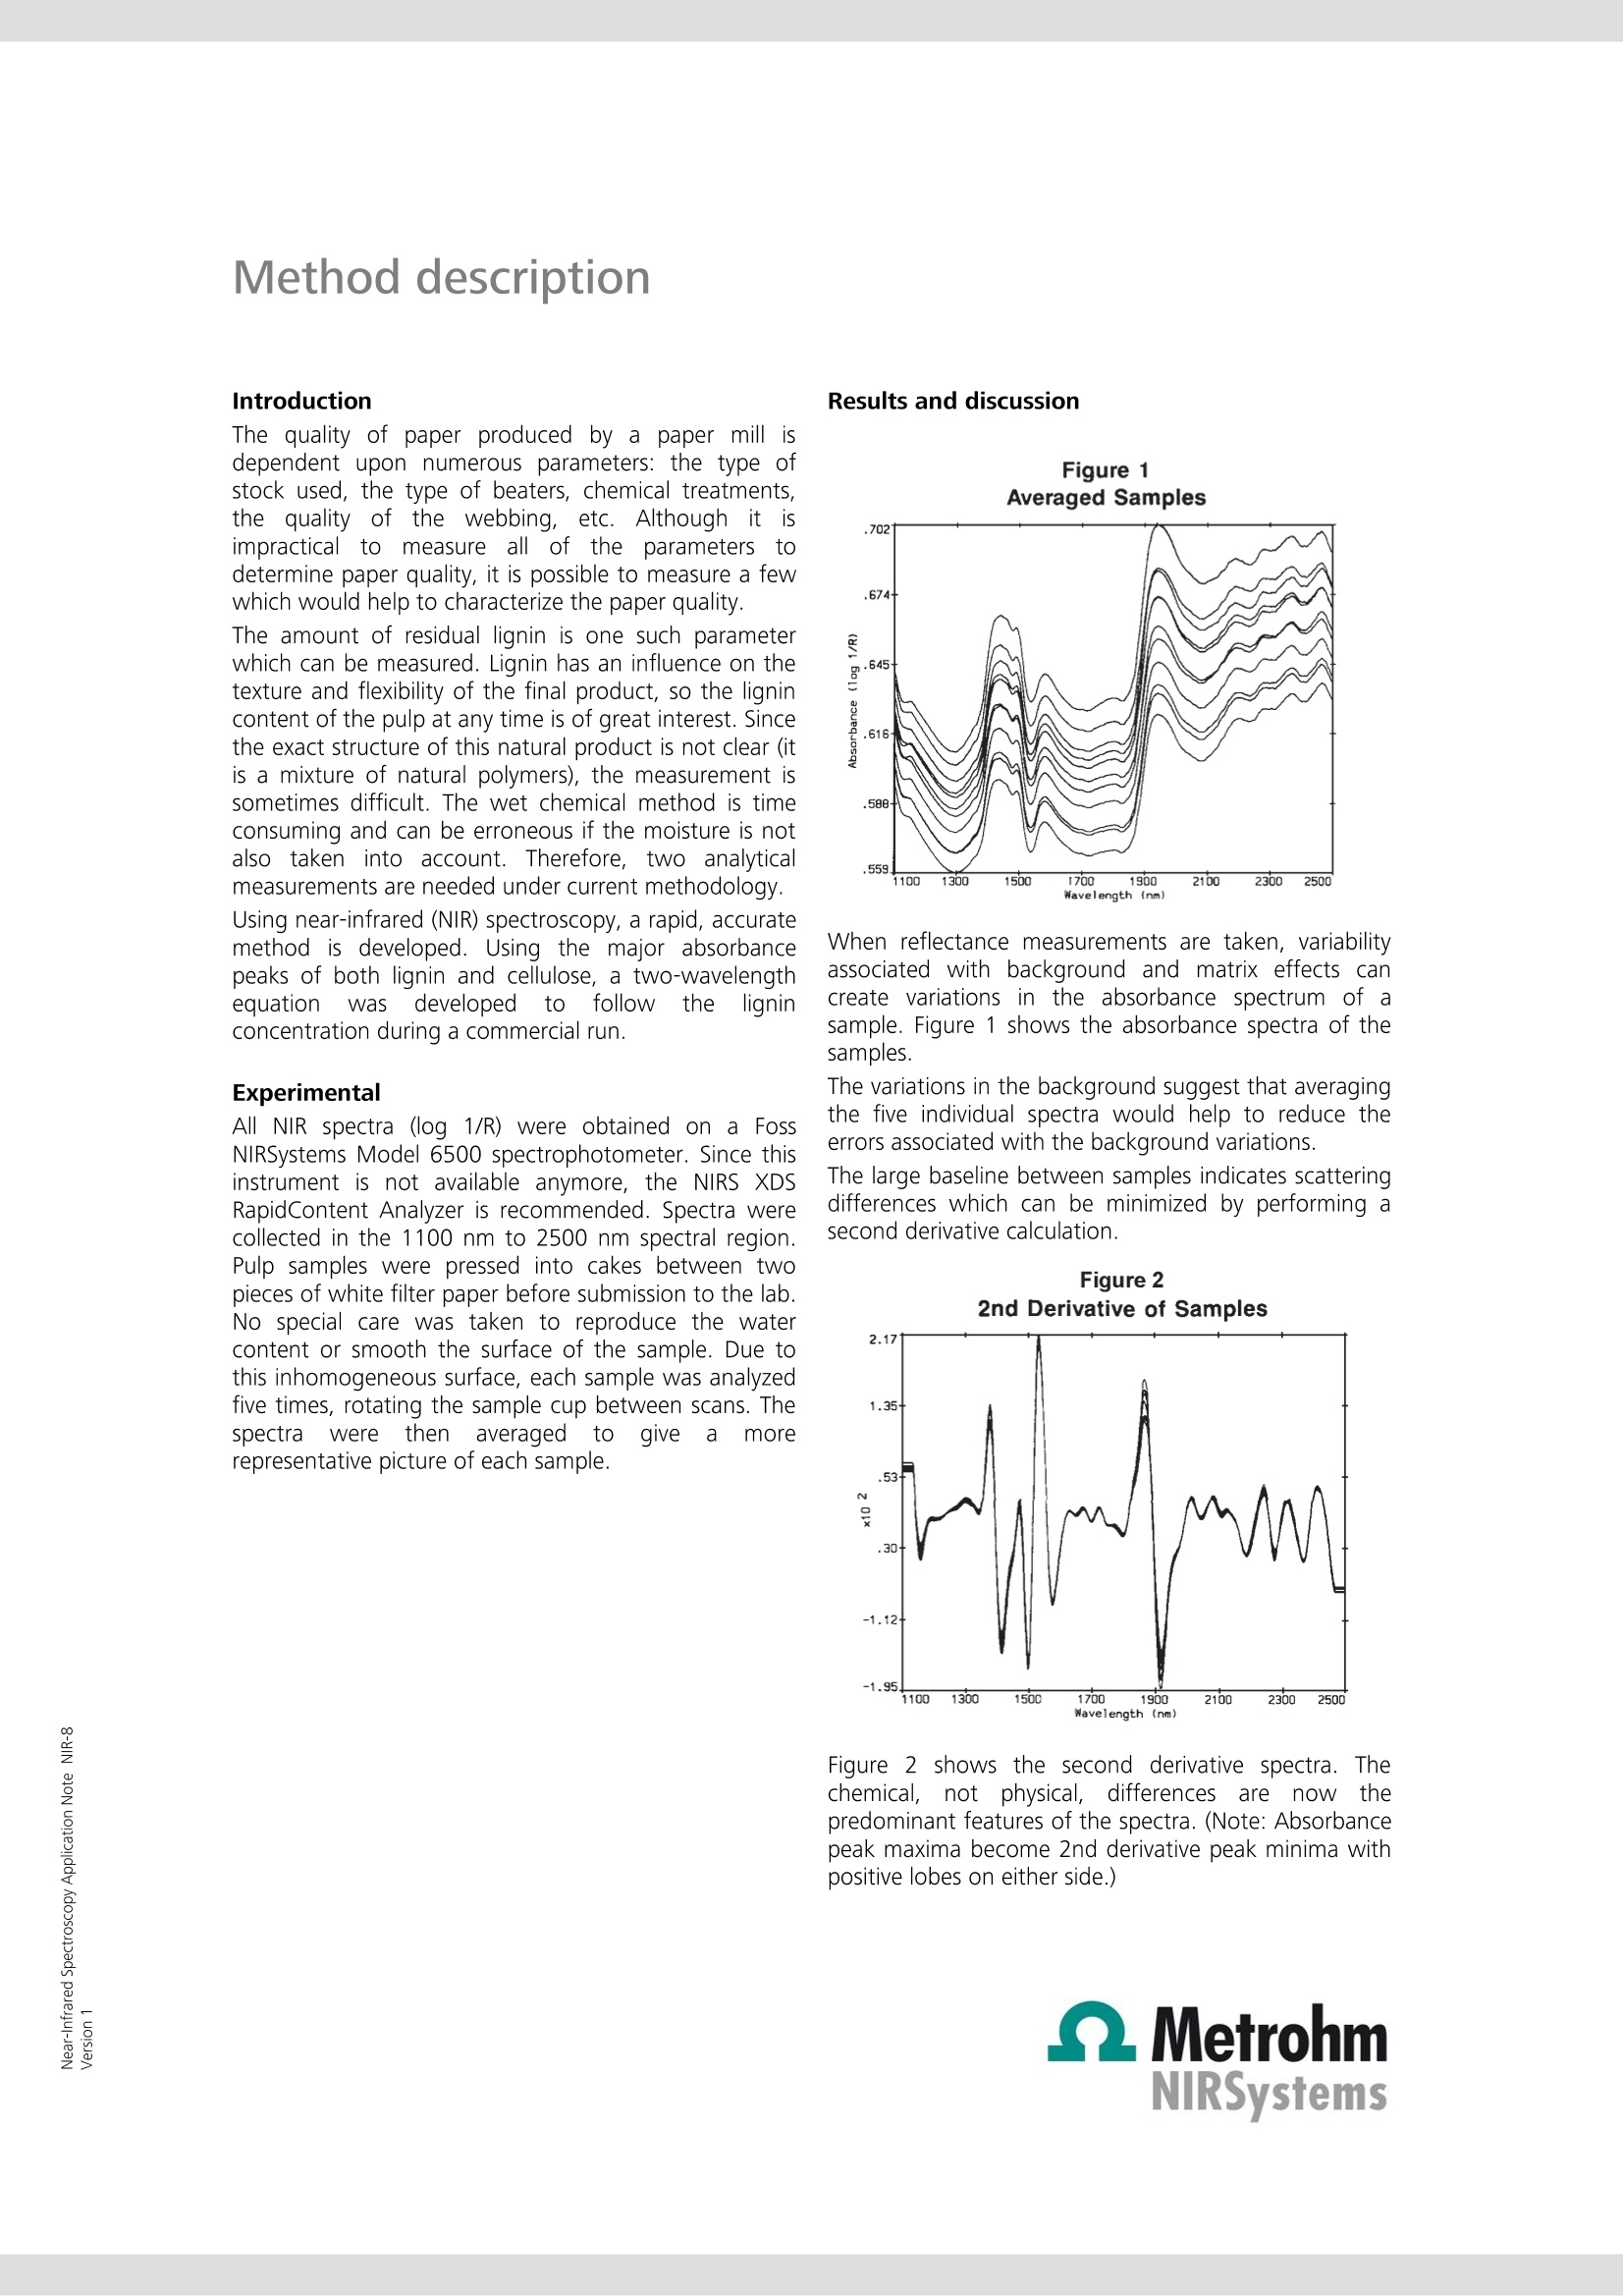
Near-Infrared Spectroscopy Application Note NIR-8 This Application Note describes how NIR spectroscopy can be used todetermine the residual lignin content in wood pulp. Using the majorabsorbance peaks of both lignin and cellulose in the second derivativespectra, a two-wavelength equation can be developed to monitor theresidual lignin content in wood pulp during paper production. Introduction The quality of paper produced by a paper mill isdependent upon numerous parameters: the type ofstock used, the type of beaters, chemical treatments,the quality of the webbing, etc. Although itimpracticall to0measure all of the parameterstodetermine paper quality, it is possible to measure a fewwhich would help to characterize the paper quality. The amount of residual lignin is one such parameterwhich can be measured. Lignin has an influence on thetexture and flexibility of the final product, so the lignincontent of the pulp at any time is of great interest. Sincethe exact structure of this natural product is not clear (itis a mixture of natural polymers), the measurement issometimes difficult. The wet chemical method is timeconsuming and can be erroneous if the moisture is notalso taken into account. Therefore, two analyticalmeasurements are needed under current methodology. Using near-infrared (NIR) spectroscopy, a rapid, accuratemethod is developed. Using the major absorbancepeaks of both lignin and cellulose, a two-wavelengthequation wasdeveloped tofollow the ligninconcentration during a commercial run. Experimental All NIR spectra (log 1/R) were obtained on a FossNIRSystems Model 6500 spectrophotometer. Since thisinstrument is not available anymore, the NIRS XDSRapidContent Analyzer is recommended. Spectra werecollected in the 1100 nm to 2500 nm spectral region.Pulp samples were pressed into cakes between twopieces of white filter paper before submission to the lab.No special care was taken to reproduce the watercontent or smooth the surface of the sample. Due tothis inhomogeneous surface, each sample was analyzedfive times, rotating the sample cup between scans. Thespectrawerethenaveraged to give a morerepresentative picture of each sample. Results and discussion Figure 1 When reflectance measurements are taken, variabilityassociated with background and matrix effects cancreate variations in the absorbance spectrum of asample. Figure 1 shows the absorbance spectra of thesamples. The variations in the background suggest that averagingthe five individual spectra would help to reduce theerrors associated with the background variations.The large baseline between samples indicates scatteringdifferences which can be minimized by performing asecond derivative calculation. Figure 22nd Derivative of Samples Figure 2 shows the second derivative spectra. Thechemical, not physical, differences arenowtithepredominant features of the spectra. (Note: Absorbancepeak maxima become 2nd derivative peak minima withpositive lobes on either side.) Method description Figure 3 While the exact structure of lignin is uncertain, there isknown to be a phenolic hydroxyl group present. Thisfunction absorbs in the 2160-2180 nm region of thespectrum. An enlargement of this spectral region isshown in Figure 3. A multilinear regression (MLR) was performed at 2172and 1556 nm. The 1556 nm wavelength is attributed tocellulose. It is included in the model to reduceinterferences due to the cellulose. A correlation (R) of0.914 and a standard error of calibration (SEC) of 1.07%were obtained. Conclusions NIR spectrophotometry appears to be a sound methodfor the measurement of lignin in paper pulp. The timesaved over the current wet method could result in morerapid turnaround of batches,nmore accuratedeterminations, and, in time, a better product at areduced cost. One advantage of a rapid means ofanalysis is that realtime corrections may be made on theproduction line, avoiding over-reactions caused by thelag time between sampling and reporting of lab data.Other applications in the paper industry which havebeen proven successful are hardwood/softwood ratios(seealso AN-NIR-9), moisture,\waxes.coatings,polymercellulose blends, and sizing to name a few.
关闭-
1/3
-
2/3
还剩1页未读,是否继续阅读?
继续免费阅读全文产品配置单
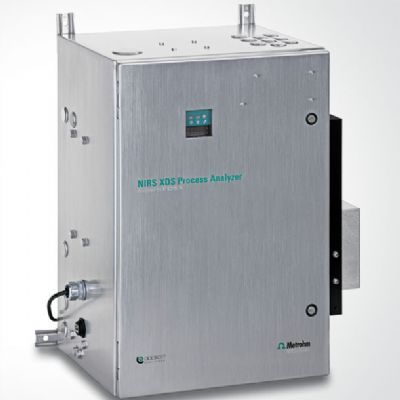
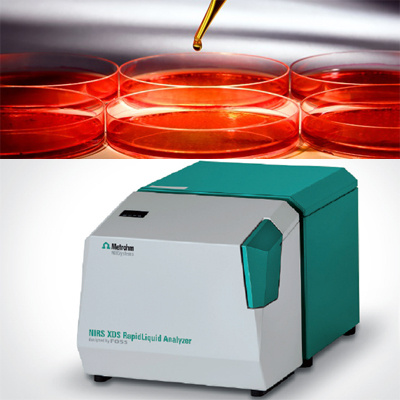
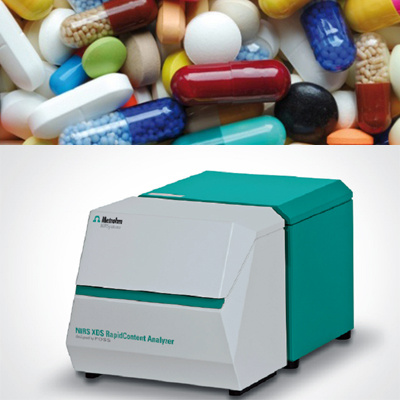
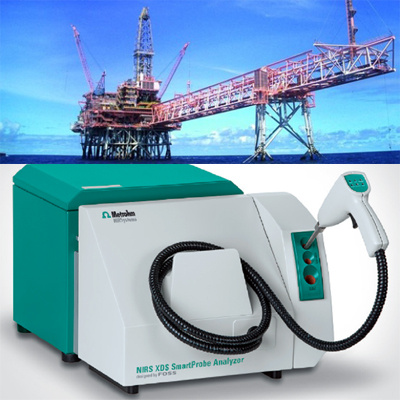
上海纳锘实业有限公司为您提供《木浆中木质素含量检测方案(近红外光谱仪)》,该方案主要用于林产品中木质素含量检测,参考标准《暂无》,《木浆中木质素含量检测方案(近红外光谱仪)》用到的仪器有瑞士万通 XDS MultiVial 近红外光谱分析仪、瑞士万通 XDS近红外在线分析仪 –微光纤束型、瑞士万通 NIRS XDS TOPA 近红外光谱分析仪、瑞士万通 PRO 近红外在线分析仪、瑞士万通 DS 2500 近红外光谱分析仪、瑞士万通 XDS 近红外在线分析仪 ——直射光/非接触型、瑞士万通 XDS 近红外在线分析仪 -单光纤型、瑞士万通 XDS RLA 近红外光谱分析仪、XDS RCA 近红外光谱分析仪、瑞士万通 XDS SmartProbe 近红外光谱分析仪、瑞士万通 瑞士万通 XDS MasterLab 近红外光谱分析仪、瑞士万通 XDS IOPA 近红外光谱分析仪。
我要纠错
推荐专场
近红外光谱(NIR)
更多
相关方案
 咨询
咨询