

方案详情文
智能文字提取功能测试中
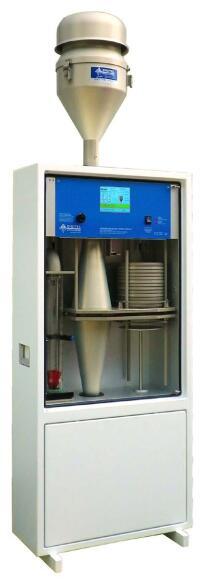
BNL-93682-2009-IR Investigation ofthe Potential for Biofuel Blends inResidual Oil-Fired Power Generation Units as anEmissions Reduction Strategy, for New York State C.R. Krishna and Roger J. McDonald May 2009 Energy Sciences and Technology Department/Energy Resources Division Brookhaven National Laboratorv P.O. Box 5000 Upton, NY 11973-5000 www.bnl.gov Notice: This manuscript has been authored by employees of Brookhaven Science Associates, LLC underContract No. DE-AC02-98CH10886 with the U.S. Department of Energy. The publisher by accepting themanuscript for publication acknowledges that the United States Government retains a non-exclusive, paid-up,irrevocable, world-wide license to publish or reproduce the published form of this manuscript, or allow othersto do so, for United States Government purposes. DISCLAIMER This report was prepared as an account of work sponsored by an agency of theUnited States Government. Neither the United States Government nor anyagency thereof, nor any of their employees, nor any of their contractors,subcontractors, or their employees, makes any warranty, express or implied, orassumes any legal liability or responsibility for the accuracy, completeness, or anythird party’s use or the results of such use of any information, apparatus, product,or process disclosed, or represents that its use would not infringe privately ownedrights. Reference herein to any specific commercial product, process, or serviceby trade name, trademark, manufacturer, or otherwise, does not necessarilyconstitute or imply its endorsement, recommendation, or favoring by the UnitedStates Government or any agency thereof or its contractors or subcontractors.The views and opinions of authors expressed herein do not necessarily state orreflect those of the United States Government or any agency thereof. Investigation of the Potential for Biofuel Blends in ResidualOil-Fired Power Generation Units as an EmissionsReduction Strategy for New York State Brookhaven National Laboratory Energy Sciences and Technology Department Energy Resources Division May 2009 C.R. Krishna and Roger J. McDonald Under Agreement 10081 New York State Energy Research and Development Authority Legal Notes NYSERDA This report was prepared by Brookhaven National Laboratory in the course ofperforming work contracted for and sponsored by the New York State Energy Researchand Development Authority (NYSERDA). The opinions expressed in this report do notnecessarily reflect those of NYSERDA or the State of New York, and reference to anyspecific product, service, or method does not constitute an implied or expressedrecommendation or endorsement of it. Further, NYSERDA and the State of New Yorkmake no warranties or representations, expressed or implied, as to the fitness forparticular purpose or merchantability of any product, apparatus, or service, or theusefulness,completeness or accuracy of any process, methods, or other informationcontained, described, disclosed, or referred to in this report. NYSERDA, the State ofNewYork, and the contractor make no representations that the use of any product, apparatus,process, method, or other information will not infringe privately owned rights and willassume no liability for any loss, injury, or damage resulting from, or occurring inconnection with, the use of information contained, described, disclosed, or referred to inthis report. United States Department of Energy This report was prepared as an account of work sponsored by an agency of theUnited States Government.Neither the United States Government nor any agencythereof, nor any of their employees, nor any of their contractors, subcontractors, or theiremployees makes any warranty, express or implied, or assumes any legal liability orresponsibility for the accuracy, completeness,(orusefulness of any information,apparatus, product, or process disclosed, or represents that its use would not infringeprivately owned rights. Reference herein to any specific commercial product, process, orservice by trade name, trademark, manufacturer, or otherwise, does not necessarilyconstitute or imply its endorsement, recommendation, or favoring by the United StatesGovernment or any agency, contractor or subcontractor thereof. The views and opinionsof authors expressed herein do not necessarily state or reflect those of the United StatesGovernment or any agency, contractor, or subcontractor thereof. Table of Contents Legal notes .2 List of figures . 4 List of tables .4 1. Introduction . 2. Experimental Setup 3. Measurement Techniques .110 4. Experimental Results. 4.1 Combustion Tests in the commercial boiler .. 14 4.2 Particulate Measurement tests in the commercial boiler (Residual oil and blends) 17 4.3 Particulate Measurement tests in a residential boiler (Filter Temperature effect tests)).. .4.4 Carbon content analysis 5.Conclusions .... 6. Acknowledgements 7..References . 1B222222 List of Figures 1. Blending System .6 2. Test Boiler .. .7 3. Internal Mixing Twin Fluid Atomizer .7 4. Electric Steam Generator .... .8 5. Sampling Stack with Induced Draft Fan Shown at Mezzanine .8 6. Particulate Sampling and Measurement System .... .9 7. Boiler and PM2.5 Sampling for Filter Temperature Tests .110 8. Schematic of the PM 2.5 Measurement .... .112 9. NOx Emission from The Fuels Compared . .115 10. SO2 Emission from # 6 and RB 40 Fuels Compared .16 11. CO Emission from the Three Fuels Compared. .16 List of Tables 1.1 No.6 Fuel Analysis.14.2.2 Pa rtic ulat e Emi ssio n Da ta f or N o. 6 fue l .173. 3Particulate Emission Data for RB10 .118 4. Particulate Emission Data forRB40 .118 5. Emissions Data, Residential Boiler ASTM No. 2 Fuel Baseline .119 6. Fine Particulate 2.5 um Emission-Low Filter Temperature .. ..1 7.. Emissions Data, Residential Boiler No. 2 Fuel, High Filter Temperature 20 8..] Fine Particulate 2.5 um Emission- High Filter Temperature .. .22.9. Carbon Content Analysis2 1.Introduction There is a significant amount of oil, about 12.6 million barrels per year, used forpower generation in New York State [1].The majority of it is residual oil. The primaryreason for using residual oil probably is economic, as these fuels are cheaper thandistillates. However, the stack emissions from the use of such fuels, especially in denselypopulated urban areas, can be a cause for concern. The emissions of concern includesulfur and nitrogen oxides and particulates, particularly PM 2.5. Blending with distillate(ASTM #2) fuels may not reduce some or all of these emissions. Hence, a case can bemade for blending with biofuels, such as biodiesel, as they tend to have very little fuelbound sulfur and nitrogen and have been shown in prior work at Brookhaven NationalLaboratory (BNL) [2] to reduce NOx emissions as well in small boilers. Some of theresearch carried out at CANMET in Canada [3] has shown potential reductions in PMwith blending of biodiesel in distillate oil. There is also the benefit obtaining from therenewable nature of biofuels in reducing the net carbon dioxide emitted thus contributingto the reduction of green house gases that would otherwise be emitted to the atmosphere. The present project was conceived to examine the potential for such benefits ofblending biofuels with residual oil. A collaboration was developed with personnel at theNew York City Poletti Power Plant of the New York Power Authority. Their interestarose from an 800 MW power plant that was using residual oil and which was mandatedto be shut down in 2010 because of environmental concerns. A blend of 20% biodiesel inresidual oil had also been tested for a short period of about two days in that boiler acouple of years back. [4] In this project, emission measurements including particulatemeasurements of PM2.5 were made in the commercial boiler test facility at BNLdescribed below. Baseline tests were done using biodiesel as the blending biofuel.Biodiesel is currently and probably in the foreseeable future more expensive than residualfuel. So, another task was to explore potential alternative biofuels that might conferemission benefits similar to those of biodiesel, while being potentially significantlycheaper. Of course, for power plant use, availability in the required quantities is also asignificant criterion. A subsidiary study to determine the effect of the temperature of the filter used tocollect and measure the PM 2.5 emissions was conducted. This was done for reasons ofaccuracy in a residential boiler using distillate fuel blends. The present report details the results obtained in these tests with the baselineASTM No. 6 fuel and blends of biodiesel with it as well as the results of the filtertemperature study. The search for the alternative ‘cheaper’biofuel identified a potentialcandidate, but difficulties encountered with the equipment during the testing preventedtesting of the alternative biofuel. 2. Experimental Setup The blending of the residual fuel and the biodiesel for the combustion tests in thecommercial boiler are made in the system shown in Figure 1. It consists of 55-gallondrums to hold the base residual fuel, the biodiesel and the blend. Two pumps are used tocirculate the different fuels. The required connections were made with copper tubing andincluded valves, pressure gauges and pressure relief valves to provide control and safety.The high viscosities of the residual fuel and the blend at normal ambient temperatures arereduced for pumping by the heating of the corresponding drums by drum band heaters. The mixing drum is set on a scale and the blends are made by weight of the blendingfuels. The fuel to the burner is supplied from this mixing drum through a heated line andthe flow rate can be calculated by timing the change in weight on the scale. Figure 1. Blending System The combustion tests are carried out in the boiler shown in Figure 2. This is aPeerless 0-715-FDA-W boiler capable of a firing rate of about 1.5 million Btu/hr. It isnormally equipped with astandard distillate oil burner, common in such boilerinstallations. This burner has a pressure atomizer, which is unsuited for residual oil andso was replaced by a Delavan 30615-10 Airo air atomizing nozzle, which is an internalmixing type. A cutaway picture of this atomizer is shown in Figure 3. Unlike pressureatomizers, the fuel flow rate is not fixed by the nozzle at a given fuel pressure and hencea metering orifice is used in the fuel system to regulate the fuel flow rate. For the presenttests, as mentioned earlier, the atomizing medium was steam which was generated by theelectric steam generator shown in Figure 4 and transported through insulated piping tothe burner. The fuel is transported to the burner by a separate pump from the blend drum.The fuel piping is heat traced to a location as close to the burner as is possible. Thedistillate burner’s pump is left connected to the atomizer as well and supplies distillatefuel from a tank outside the laboratory for starting. After the distillate oil flame isestablished, the fuel from the blend drum is gradually fed into the atomizer while thedistillate oil flow is reduced with the help of valves in the two fuel lines. The burnerblower is used to supply combustion air for starting on (No.2) distillate fuel and forfiring the blends. The boiler as shown in Figure 2 has two exhaust stacks for conveying thecombusted gases outside the building. The larger one, termed the main stack, is usednormally. This connects to the chimney outside the laboratory room and operates bynatural convection. However, the proximity of the right angle bend makes;itunsatisfactory for particulate measurements. Hence, the smaller stack is used for makingthe emission measurements.This stack has an extended length that brings it to a mezzanine in the lab and is connected to an induced draft fan for venting to the outside.This part of the stack with the fan is shown in Figure 5 below. The particulate dilution sampling and PM 2.5 measurement system to CTM-39 isshown with the sampling probe set up on the mezzanine level in Figure 6 below. Thegaseous emissions are measured with the Testo Model 350 test instrument. The fueltemperatures are measured with thermocouples, and the fuel flow rate is measured bytiming with a stopwatch a known change in the drum weight. The tests to determine the effects of filter temperature on the PM2.5 measurementwere carried out in the residential boiler shown in Figure 7 below. Figure 2. Test Boiler Airo Nozzle Assembly P/N 30615 (.875"Hex) & PIN 30616 (1.250"Hex) Figure 3. Internal Mixing Twin Fluid Atomizer Figure 4. Electric Steam Generator Figure 5. Sampling Stack With Induced Draft Fan Shown at Mezzanine Figure 6. Particulate Sampling and Measurement System Figure 7. Boiler and PM2.5 Sampling for Filter Temperature Tests 3. Measurement Techniques The fuel flow rate was measured by timing the change in weight of the blenddrum. The blend or residual density can be used to calculate the volumetric flow rate. Thefuel temperature and the steam pressure were measured with a thermocouple and apressure gauge to set the operating conditions. The smoke number (per ASTM D1256-94) was set at #1 typically. For performance measurements, the combustion air wasvaried by changing the setting on the burner air register at the same fuel flow rate toobtain different oxygen values in the stack. The PM measurements were carried out atone excess air level, that is, one oxygen concentration in the stack. The basic flue gas emissions data were obtained using an electro-chemical basedanalyzer capable of measuring oxygen, CO, NO, NO2 and SO2 as well as measuring stackgas temperature and determining steady state efficiency. The acceptance of portableelectrochemical-based analyzers by state and federal environmental agencies has grownsignificantly over the past decade. Numerous third party organizations have tested andevaluated the technology and found that not only do they satisfy the accuracyrequirements of many compliance-testing programs, but also offer a more affordable andbetter time managed solution. Coupled with great cross utilization capability that canidentify improvements in the combustion process and product quality, this makes theseanalyzers a valuable asset to many types of combustion research. The specific analyzerused in this project was a Testo Model 350 equipped with low range CO and NOxcapabilities. This specific device was evaluated, tested and its performance verified underthe US EPA’s Environmental Technology Verification (ETV) Program by the AdvancedMonitoring Systems (AMS) Center, one of six technology areas under ETV and operated by Battelle (Columbus, OH) in cooperation withthe EPA’sNational ExposureLaboratory. Fine particulate measurements were conducted by a series of tests to determinethe gravimetric amounts of particulates below 2.5 microns (PM 2.5). This measurementtechnique is based on US EPA Conditional Tests Method (CTM) 39 for Measurementsof PM2.5 and PM10 Emissions by Dilution Tunnel Sampling (Constant Sampling RateProcedures). This method was developed for large emission sources like oil or gas-firedpower generation utilities or manufacturing plants. These units have stack dimensionstypically sized several feet and not a few inches as in our application. So, the method wasmodified to accommodate the tighter geometry found with residential heating appliancevents. The primary modification included using only a single particle-sizing cyclone witha cut size of 2.5 microns. These cyclones are normally used inside the stack and areintended to function at the stack temperature. Due to the small diameter of the flue (6-inch) used the procedure was modified to install the cyclone outside the flue with a wrapheater and temperature controller to maintain the temperature at the same level as theinternal stack temperature. At the test conditions established, a series ofthree measurements were made. Thethree samples were obtained at the same operating conditions and provided dataevaluation based on the standard deviation for statistical reasons. If the standard deviationwas high due to one measurement that test was repeated to see if more consistent datawas obtainable. A fourth sample was obtained for analysis of elemental carbon andorganic carbon present in the particulate sample. These samples needed to be obtained ona pre-conditioned pure quartz media filter. The preconditioning involved baking anyimpurities out of the blank filter by placing it in an oven at 800 degrees Celsius for aperiod of at least two hours. The smoke measurementit was obtained using a “Bacharach” smoke testerdesigned to conform to ASTM D1256-94 (1999),‘Standard Test Method for SmokeDensity in Flue Gases from Burning Distillate Fuels.’The“Bacharach” smoke tester is amanually operated smoke pump used usually to set up the appropriate air-fuel ratio. The PM2.5 measurement system’s schematic is shown in Figure 8. The stack gasis sampled through a hook shaped nozzle located in the center of the stack at conditionsas close to isokinetic as possible. The next component of the sampling train was thecyclone (cut-off sized for 2.5 microns), which was heated to and controlled at the stacktemperature. This is followed by a heated probe and the sample flow meter venturi, whichis used to measure the sample flow rate, also kept heated at the stack temperature. Thesampled gas is cooled and diluted to near ambient conditions by mixing, at the mixingcone, with HEPA filtered ambient cool dry air at about 65-70° F as shown. The combinedgas stream has sufficient time in the residence chamber for particulates to form and/orcondense before they are trapped by the 142-mm filter. A computer is used to controltemperatures, to maintain flow rates as particulate builds up on the filter and to collect theexperimental data. The normal filter is desiccated and weighed to the nearest 1/10milligram using an analytical balance (Mettler Toeldo AG104) before and after samplingto determine the mass of PM 2.5 particulates collected. The stack conditions (oxygenconcentration) and the sampling flow rates can be used to relate this to stackconcentration and hence to the fuel burning rates. Two types of filters are used. Thegravimetric samples are collected on borosilicate glass microfiber filters with woven glass cloth bonded with PTFE (Teflon). This is done in triplicate for reasonable statistics.A pure quartz filter is used for one measurement for subsequent analysis to determine thesplit between elemental and organic carbon in the particulate. This quartz filter is pre-conditioned by baking it at 800°C for two hours to remove any possible carboncontaminants before use with the sampling system. The elemental and organic carboncomponents in the particulate sample on the quartz filter were analyzed by a testinglaboratory (Sunset Labs) using the thermal optical technique (NIOSH 5040). Theprotocol followed (CTM-39) for setting up and operating the sampling system is morecomplex than suggested in this outline of the procedure. The complete method can bedownloaded from the US EPA’s website at http://www.epa.gov/ttn/emc/ctm.html. The compact size of the dilution tunnel sampler used in this project provides forthe ability to wash it down with acetone and subsequent recovery of the particulateresidue on the walls. The acetone rinse and residue is collected in pre-weighed aluminumtins. Then the acetone is evaporated in a hood and the residue is weighed using theanalytical balance to determine the amount of particulate material recovered. A similartechnique using an acetone wash was used to recover the sample from the 2.5 cut sizecyclone. Several other research organizations have conducted dilution tunnel samplingusing very large apparatus that preclude an accurate recovery of this residue. Figure 8. Schematic of the PM 2.5 Measurement Prior to the start of this work, BNL hosted a research team from the US EPAtasked with conducting a detailed speciation profile of the fine particulates for a typicalresidential oil-fired boiler. This project involved testing a single unit with a single sampleof fuel and was conducted over a three-day period. The EPA team utilized a very largedilution tunnel sampler built for EPA. This measurement system has been deployed toconduct speciation profiles for various different types of fine particulate generatingsources. These include power generation units, commercial boilers, engine sources, etc.This was done to determine if there are any unique emissions characteristics from thesegeneric source types that could then be traced in their detailed air quality monitoringstations located throughout the country. This would then enable them to apportionambient particulate concentrations to be the result of these various generic sources. TheEPA dilution tunnel involved a large truckload of equipment and components.. Thisemissions sampler was a modified dilution sampling system like that used by Hildemannet al. [5]. After researching different possibilities BNL had acquired a very compactdilution sampler. It was built by a commercial vendor of emissions sampling equipmentand was based on the EPA design developed for EPA CTM-039. This design wasgenerated by another arm of the US EPA tasked with instrumentation development formultiple users interested in conducting fine particulate measurements for compliance toEPA regulations concerning fine particulate emissions. The availability of both dilution tunnel samplers allowed BNL to conduct a directsimultaneous side-by-side comparison of the two measurement systems. While the EPAresearchers were at BNL conducting their project BNL ran its measurement system inparallel sampling off the same stack simultaneously. This provided BNL an opportunityto evaluate the performance of its compact dilution sampler against using a larger versionof a modified dilution sampling systems like that used by Hildemann et al.[5]. The boiler used in the testing was a conventional cast iron boiler equipped with aflame retention head burner. At EPA’s request the boiler was tested under cyclic on andoff conditions according to the duty cycle specified in ASHRAE Standard 103-1193. Theunit was fired with conventional ASTM No. 2 heating oil with a sulfur content of 1,440ppm. The test was repeated three times over the course of three days. The gravimetricfine particulate emission factor measured by the EPA group was reported as 49 +/- 5mg/kg. The BNL measurement using the compact dilution sampler was 46 mg/kg with astandard deviation of 8 mg/kg, which indicates close agreement between the twosampling methods. These can be compared to the existing emission factor of 57 mg/kglisted in EPA AP-42. During the evaluation dealing with the effects of filter temperature on PM resultsall of the flexible air ducts lines were shortened and insulated to preserve the temperatureof the cool or hot air as required. In attempting to run the tests at the low temperaturecondition the air conditioner used to dehumidify the dilution air was set to run atmaximum cooling capacity. A 1500 watt heater in an enclosed plenum was used topreheat the dilution air prior to its intake to the HEPA filter to achieve the high filtertemperature condition. A conventional residential boiler running continuously was usedin these tests. As stated before three tests were conducted for statistical reasons. 4. Experimental Results 4.1. Combustion Tests in the commercial boiler The baseline residual fuel to ASTM No. 6 was obtained from the BNL steamplant and was tested in the test boiler seen in Figure 2. The analysis of the No. 6 fuel isgiven in Table 1 below. The procedure is to start the boiler on No. 2 diesel fuel withsteam atomization and then switch to the No. 6 fuel or the blend, which has been keptheated to the temperature required for atomization. Fue and atomization steam pressuresare maintained at the appropriate levels for the internal mixing atomizer used. Once, theflame is stabilized, emission measurements are made at different excess air levelsobtained by altering the air gate settings without changing the fuel flow rate. The steadystate conditions are maintained with the boiler producing saturated steam, which isvented outside the lab. Table 1 Parameter BNL Resid Hydrogen,% 12.28 Carbon,% 87.09 Sulfur,% 0.284 Nitrogen,% 0.284 Oxygen,% 0.28 Btu/Pound 18545 Btu/gallon 146468 Btu/lb, LHV NA F Factor (Calculated) NA Sodium Total (mg/kg) NA Nickel Total (mg/kg) NA Chlorine(mg/kg) Note 1 API Gravity at 60°lF 17.7 Ash, % .088 Compatibility NA Flash point,F >200 Micro Carbon Residue NA Pour Point.F 27 Viscosity, SSF at 122F 31.5 Viscosity Kin at 122F 61.7 Viscosity, SSU at 100°F 57.3 (Note 2) Viscosity Kin, at 100F 118.9 Water,% (by volume) NA Water &Sed,%(by volume) 0.10 Btu/lb, LHV NA Note 1: Chlorides, organic: 3 ppm, Chlorides, Total: 3 ppm. Note 2: A typo possibly, this number seems to be SSF. NA: Not Available. The biodiesel bought from a supplier is made from soy oil and meets the ASTMD6751 specification as of that date. The specification has changed recently. This wasblended, in the system described before, at two levels, 10% and 40%, for the combustionand emission as well as the PM tests. Following the combustion tests, the PM2.5 measurement tests with the CTM-39system in place as seen in Figure 6 above were carried out at one excess air level. Asmentioned before, this requires a continuous running period of several hours, as threetestss are required for gravimetric measurement and one for the carbon speciationmeasurement using the quartz filter. Typical runs for each of these tests lasted about anhour. The results from the combustion tests will be presented as summary graphs of thegaseous emissions as a function of excess air (represented by the oxygen concentration inthe stack). The gas concentrations will be ‘corrected for dilution,’ by calculating anequivalent value at 3% oxygen in the stack, so that they can be compared. Figure 9 belowcompares graphically the NOx at 3% 0 for the three fuels. As has been noticed before[2], blending biodiesel reduces the NOx emission from this boiler and the effect increaseswith increase in the blending amount. Though not directly measured, this is not due to theslightly lower heating value of the biodiesel, as the contrary happens in diesel enginesgenerally. NOx at 3% 02 compared for # 6 Oil, RB 10 and RB 40 Blends Figure 9. NOx Emission from The Fuels Compared Figure 10 below shows the SO2 data, again corrected for the dilution effects, forthe base No. 6 fuel oil and the RB 40 blend (60% No. 6 and 40%biodiesel). The data forRB10 (90% No. 6 and 10% biodiesel) shows a lot of scatter for some unknown reasonand is omitted here for clarity. The SO2 emission is a direct function of the sulfur contentin the fuel and quite obviously, the absence of sulfur in the biodiesel transfers directly toreduction in the blend SO2 emission. Stack SO2 at 3% for # 6and RB 40 Figure 10. SO2 Emission from #6 And RB 40 Fuels Compared Figure 11 below compares the carbon monoxide emissions from the three fuels. Inthe mid range of excess airs, the blends seem to have lower CO emissions. CO at 3% 02 Figure 11. CO Emission from The Three Fuels Compared Overall, the combustion performance suggests that blending with biodiesel couldreduce NOx emissions and the SO2 emissions will go down because of the lower sulfurcontent in the blend. Clearly, these results are specific to this boiler and also with noattempts to optimize the atomization for the blend. 4.2 Particulate Measurement tests in the commercial boiler (Residual oil and blends) Test results for the particulate measurements are presented in Tables 2,3 and 4below for the baseline No. 6 fuel, RB10 and RB40. The expectation was that the RB40blend would have significantly lower PM emissions as compared to the RB10 andbaseline fuel. Based on our measurements the RB40 blend did perform slightly betterthan the baseline fuel but was higher in fine particulates than that measured for RB10blend by roughly 24%. It was noticed during the tests with RB40 a great deal ofinstability in a first series of tests, which manifested as swings in the measured O2 levelsin the stack. The instrument checked out to be alright and hence attempts were made toadjust the fuel to ‘correct’ for it. During a second series of tests, the conditions were alittle less unstable and the results reported here are from this series of tests. However,even these results are deemed unsatisfactory and might be the cause ofthe unexpectedincrease in the calculated fine particulates emission. This is also borne out by the data forthe PM2.5 in the tables (Rows 4, for example), which show much greater variationbetween the three tests for RB40 compared to the other two fuels. Subsequent diagnosticmeasurements suggest that the problem might be due to the interaction between the largenatural convection stack, which is closed during the tests and a smaller induced draftstack. As this had been the configuration during all the previous successful tests in priorprojects, it was not considered to be the problem initially. This unexpected diversion ofresources precluded repeating the PM tests for RB40 before the completion of the project. If we compare the data in tables 2 and 3, the expectation that PM2.5 is reduced byblending with biodiesel is borne out. This is true for the total PM emission as well despitea small increase in PM10 for the RB10 compared to that for No. 6. Table 2. Particulate Emission Data for No. 6 Fuel Baseline Fuel Fine particulates (<2.5 microns) Larger Particulates (> 2.5 microns) Fuel BNL No. 6 BNL No. 6 Run #1 #2 #3 Average #1 #2 #3 Average Part. concentration (dry) mg/m 39.39 36.24 37.68 37.77 11.22 10.8011.07 11.03 PM Conc. @ 3% Oxygen mg/m 45.63 41.96 43.60 43.73 13.00 12.5012.81 12.77 mg/KJ 12.82 11.79 12.25 12.29 3.65 3.51 3.60 3.59 mg/kg 557.2 512.4 532.4 534.0 158.7 152.6156.4 155.9 lbs/MMBtu 0.029 0.008 lbs/1000 gallons 4.2 1.2 All particulate lbs/1000 gallons 5.5 Table 3. Particulate Emission Data for RB10 B10 blend with baseline fuel Fine particulates (<2.5 microns) Larger Particulates (> 2.5 microns) Fuel RB10 No. 6 RB10 No.6 Run #1 #2 #3 Average #1 #2 #3 Average Part. Concentration (dry) mg/m3 30.00 29.42 29.08 29.50 13.30 13.32 13.20 13.27 PM Conc.@ 3% Oxygen mg/m 33.80 34.33 37.27 35.13 14.98 15.54 16.91 15.81 mg/KJ 9.40 9.55 10.37 9.77 4.17 4.32 4.70 4.40 mg/kg 409.7 416.1 451.7 425.8 181.6 188.4 205.0 191.7 Lbs/MMBtu 0.023 0.010 Lbs/1000 gallons 3.3 1.5 All particulate lbs/1000 gallons 4.8 Table 4. Particulate Emission Data for RB 40 B40 blend with baseline fuel Fine particulates (<2.5 microns) Larger Particulates (> 2.5 microns) Fuel RB40 No.6 RB40 No.6 Run #1 #2 #4 Average #1 #2 #4 Average Part. Concentration (dry) mg/m3 31.25 26.82 24.25 27.44 4.50 4.54 4.47 4.50 PM Conc.@ 3%Oxygen mg/m° 46.11 42.87 41.22 43.40 6.64 7.25 7.60 7.16 mg/KJ 12.95 12.04 11.57 12.18 1.86 2.04 2.13 2.01 mg/kg 546.5 508.1 488.4 514.3 78.7 86.0 90.0 84.9 lbs/MMBtu 0.028 0.005 lbs/1000 gallons 4.0 0.7 All particulate Ibs/1000 gallons 4.6 4.3 Particulate Measurement tests in a residential boiler (Filter Temperature effect tests) Tests were conducted to evaluate the effects that the temperature of the filtermight have on the fine particulate measurement results. These were done using aresidential sized boiler firing ASTM No. 2 oil as these effects are expected to be smalland the accuracy possible with a distillate oil boiler is more likely to disclose anydifferences. The PM 2.5 apparatus was modified to evaluate any changes betweenmeasured PM 2.5 levels as a function of filter temperature. This required installing a newthermocouple just right behind the filter support frit to accurately determine the true filtertemperature. The targets were a “low’temperature of 25'C (77 F) and a high of 42°C(108 F). Several days were spent trying to achieve these temperatures prior to actualmeasurements. Given the EPA CTM-039 equipment we were not able to actually get thefilter temperature all the way down to 77 F. The unit’s air chiller used to provide pre-conditioning of the air flow was set for maximum output and all air lines were heavilyinsulated. The lowest temperature achieved was about 80°F for short durations but thistended to increase over time. During the actual low temperature tests an averagetemperature of 88° F was achieved. It was also an effort to achieve the higher target of 108° F, which was accomplished by the addition of a heater to preheat the air before itentered the HEPA filter. Tables 5 and 6 below give the data on flue gas emissions and for the fineparticulates for the ‘low’temperature condition. Tables 7 and 8 give the correspondingdata for the ‘high’temperature measurements. The flue gas data are presented to indicatethat the tests were conducted at similar combustion conditions. Samples for elementaland organic carbon analyses were also taken and sent to Sunset Laboratory for EC/OCdetermination. These results are presented in Table 9. Table 5. Emissions Data-Residential Boiler ASTMNo. 2 Fuel Baseline Oil-fired residential boiler with ASTM No. 2 fuel -steady state data - low temperature filter Reading Number 1 2 3 4 5 6 Avg. Avg. @ 3% 02 Stack Temp. Deg F 366 360 367 372 375 373 368.8 **** Oxygen % 6.25 6.23 6.49 6.46 6.61 6.41 6.41 **** CO2% 11.02 11.03 10.84 10.86 10.74 10.9 10.90 *** * COppm 0 0 0 0 0 0 0 0 NOppm 93.3 93.1 94.7 95.6 98.7 98.9 95.7 118.2 NOx ppm 94.2 94.7 96.3 97 100.5 101.6 97.4 120.3 NO2 ppm 0.9 1.6 1.6 1.4 1.8 2.7 1.7 2.1 SO2 ppm 61 61 53 53 65 65 59.7 73.7 Efficiency 86.2 86.6 86 85.9 85.8 86.1 86.1 **** Excess Air 39.2 39 41.3 41.1 42.5 40.6 40.6 **** Table 6 Fine Particulate 2.5 um Emission - Low Filter Temperature Fine Particulate 2.5 um Emission Oil-fired Residential Boiler Run #1 Run # 2 Run # 3 Average Fuel ASTM No.2 ASTM No. 2 ASTM No. 2 Fuel Flow gph 0.702 0.721 0.723 0.715 Btu/Min 1623 1666 1670 1653 Kj/ Min 1712 1758 1762 1744 Oxy% 6.25 6.43 6.51 6.40 PM (dry)mg/dscm 4.71 4.61 4.71 4.68 PM @ 3%Oxy 5.75 5.71 5.86 5.77 mg/MJ 1.62 1.61 1.65 1.62 mg/kg 72.3 71.8 73.6 72.6 lbs per mmBtu 0.0038 lbs. per 1000 gallons 0.524 Table 7 Emissions Data -Residential Boiler ASTM No. 2 Fuel, High FilterTemperature Oil-fired residential boiler with ASTM No. 2 fuel - steady state data - high temperature filter Reading Number 1 2 3 4 5 6 Avg. Avg.@ 3% 02 Stack Temp. Deg F 370.2 371.5 380.7 382.3 367.4 377.1 374.9 **** Oxygen % 6.48 6.45 6.46 6.57 6.22 6.23 6.40 **** C02% 10.85 10.86 10.86 10.78 11.04 11.03 10.90 **** CO:ppm 0.2 0.1 0 0.2 0 0 0 0 NO1ppm 96.7 97 99 97.1 98.6 100.1 98.1 121.1 NOx ppm 99.5 99.9 102 100.3 102 102.8 101.1 124.8 NO2ppm 2.8 2.8 3 3.2 3.4 2.7 3.0 3.7 SO2 ppm 72 73 73 74 72 77 73.5 90.7 Efficiency 86.4 86.3 86 86 86.4 86.2 86.2 **** Excess Air 41.3 41.1 41.1 42.1 39 39.1 40.6 **** Table 8. Fine Particulate 2.5 um Emission- High Filter Temperature Fine Particulate 2.5 um Oil-fired Residential Boiler Run #1 Run # 2 Run # 3 Average Fuel ASTM No. 2 ASTM No. 2 ASTM No.2 Fuel flow gph 0.735 0.739 0.737 0.737 Btu/Min 1698 1707 1704 1703 kj/Min 1792 1801 1797 1797 Oxy% 6.48 6.56 6.18 6.41 Part Con (dry) 4.78 5.13 5.01 4.97 PM @ 3%Oxygen 5.93 6.40 6.09 6.14 mg/MJ 1.67 1.79 1.71 1.73 mg/kg 74.6 80.2 76.6 77.1 lbs per mmBtu 0.0040 lbs. per 1000 gallons 0.557 As can be seen from the average values, there appears to be a slight increase inthe fine particulate emission level with the increased filter temperature. This can beobserved from the average values for the low temperature of 1.62 mg/KJ with a standarddeviation of 0.02 mg/KJ or 75.6 mg/kg with a standard deviation of 0.9 mg/kg ascompared to the higher temperature case with 1.73 mg/KJ with a standard deviation 0.06mg/KJ or 77.1 mg/kg with a standard deviation of 2.8 mg/kg. It is only a slight increaseand would require a much more extensive study to see if this is really a trend. Somewhatsimilar results were obtained by Glen England as reported in Figure 2-28 and discussedon page 56 in NYSERDA Report 04-05,‘Development of Fine Particulates EmissionFactors and Speciation Profiles for Gas- and Oil-Fired Combustion Systems’. Theseresults were in a gas-fired system. This effect is a very weak relationship and alternative studies have actually indicated adecrease inparticulate levelswithi iincreasingtemperature in diesel engine exhausts. 4.4 Carbon content analysis Throughout this study for residual oil (ASTM No. 6) as well as the filtertemperature tests with heating oil (ASTM No. 2), various particulate samples werecollected on prepared (pre-baked at 800°C) pure quartz glass filters for determining theelemental and organic carbon content of the PM2.5 particulates. The samples on the filterwere preserved below 32F in a freezer prior to shipping to the test laboratory. Thecarbon speciation of the samples were determined using the NIOSH 5040 method. Theconcentrations measured by the test laboratory were used to calculate the actual emissionrates for organic and elemental carbon. These calculations are based on the run times andon the part of the total fuel consumption contributed to the samples collected by thedilution tunnel. The final results are presented in Table 9 below. The RB40 results maynot be quite right because of the difficulties in running those tests noted above.TheRB 10 results might suggest, when compared with the baseline #6, that organic carbonmight be a slightly higher proportion of the total carbon with the blending of thebiodiesel. However, more measurements are required for firm conclusions. Table 9. Carbon Content Analysis Sample ID OC mg/kg EC mg/kg OC+ECmg/kg Peerless' ASTM #6 Baseline 10.65 10.07 20.72 Peerless' ASTM #6 RB10% 10.26 8.79 19.05 Peerless' ASTM #6 RB40% 23.45 16.32 39.77 DunkirkLow Temp 1.94 1.05 2.99 Dunkirk High Temp 3.77 2.32 6.09 Notes:refers to the commercial boiler. refers to the residential boiler. 5. Conclusions The project essentially studied how blending biodiesel with residual oil affects itscombustion performance. The intended goal was that this could pave the way forapplication in power generation boilers if the results were beneficial and of course theeconomics are favorable. The latter might need the use of a cheaper ‘biofuel’ and whilesome work was done in the project to identify potential biofuels, they were not testedduring the course of this work. The work was carried out in a distillate oil test boiler ofabout 1 million Btu per hour capacity modified to run residual oil. The primary interestwas in the effect on the gaseous and particulate emissions. The measurements showedthat the sulfur dioxide emission was reduced as expected, and the NOx emission waslower too. The latter is not necessarily expected, although some previous work [2] hadalso shown this. PM2.5 measurements showed that the addition of biodiesel could lead toreductions in the fine particulate emission as well. In terms of application to powergeneration equipment, it is expected that the SO and PM2.5 reductions will hold.However, because of the very different combustion environment in a large utility power generation boiler, it is not obvious that the NOx reduction with addition of biodiesel willbe obtained. This would have to be demonstrated by field tests, especially if a cheaperbiofuel’is identified. Some tests were conducted in a residential boiler using distillate fuel (ASTM #2home heating oil) to examine if the temperature of the filter used to collect the PM2.5sample in the test apparatus had any bearing on the measured value. The limited numberof tests suggests that, there is a small increase in weight of the fine particulates with theincrease of filter temperature. A final conclusion would require more testing. 6. Acknowledgements We thank Yusuf Celebi and George Wei for considerable help in the performanceof the tests and in acquiring data. Li Kou of NYPA was helpful in the discussions andcoordinatedNYPA'sparticipation. Barry Liebowitz, the ProgramManageraatNYSERDA, facilitated the funding and was very understanding of the practical problemsencountered during the tests that led to unexpected expenditure of resources. 7. References 1. NYSERDA, Patterns and Trends New York State Energy Profiles 1993-2007, January2009. ( 2. C.R. Krishna, Low Cost Bioheating Oil Application, BNL-71444-2003-IR, 2003. ) 3. S. Win Lee et al., Emission Reduction Potential From The Combustion Of Soy MethylEster Fuel Blended With Petroleum Distillate Fuel, Fuel 83 (2004) 1607-1613,2004. 4. W. Louer, Project Manager, Biodiesel Co-Firing-Field Demonstration Results, EPRIReport 1014844, 2007. 5. Hildemann, L.M.; Cass, G.R.; Markowski, G.R. A Dilution Stack Sampler forCollection of Organic Aerosol Emissions: Design, Characterization And Field Tests.Aerosol Sci. Technol. 1989, 10, 193-204,1989. doc( Printed on recycled paper./doc(
关闭-
1/24
-
2/24

还剩22页未读,是否继续阅读?
继续免费阅读全文产品配置单
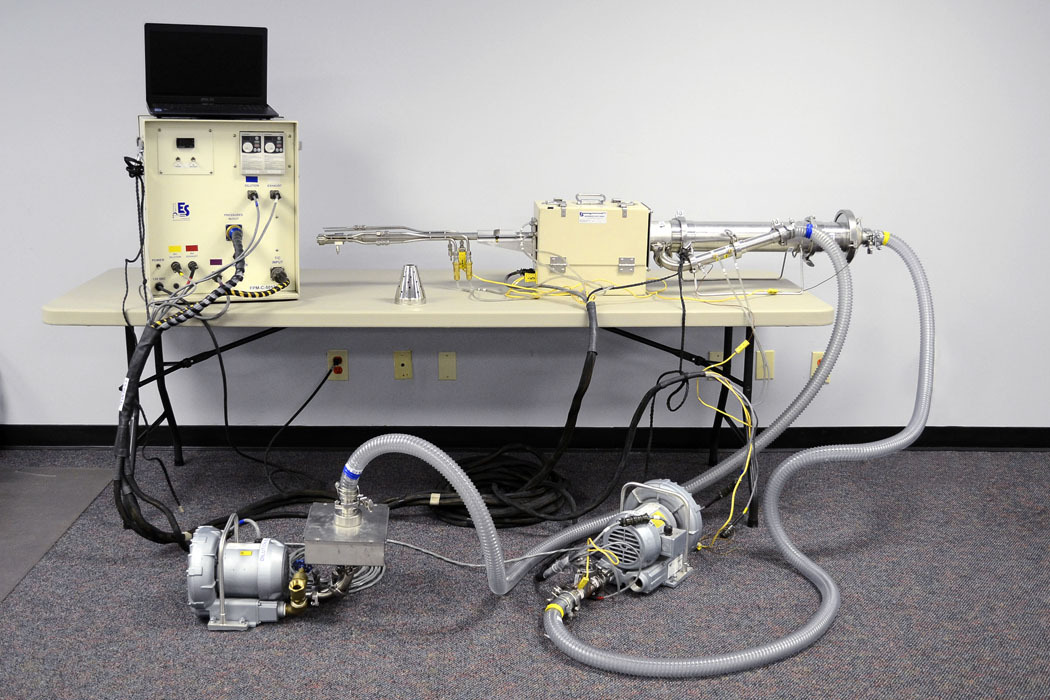
北京迪特锐科技有限公司为您提供《空气中颗粒物检测方案 》,该方案主要用于空气中颗粒物检测,参考标准《暂无》,《空气中颗粒物检测方案 》用到的仪器有便携式PM2.5稀释采样系统。
我要纠错
推荐专场
相关方案
 咨询
咨询