方案详情文
智能文字提取功能测试中
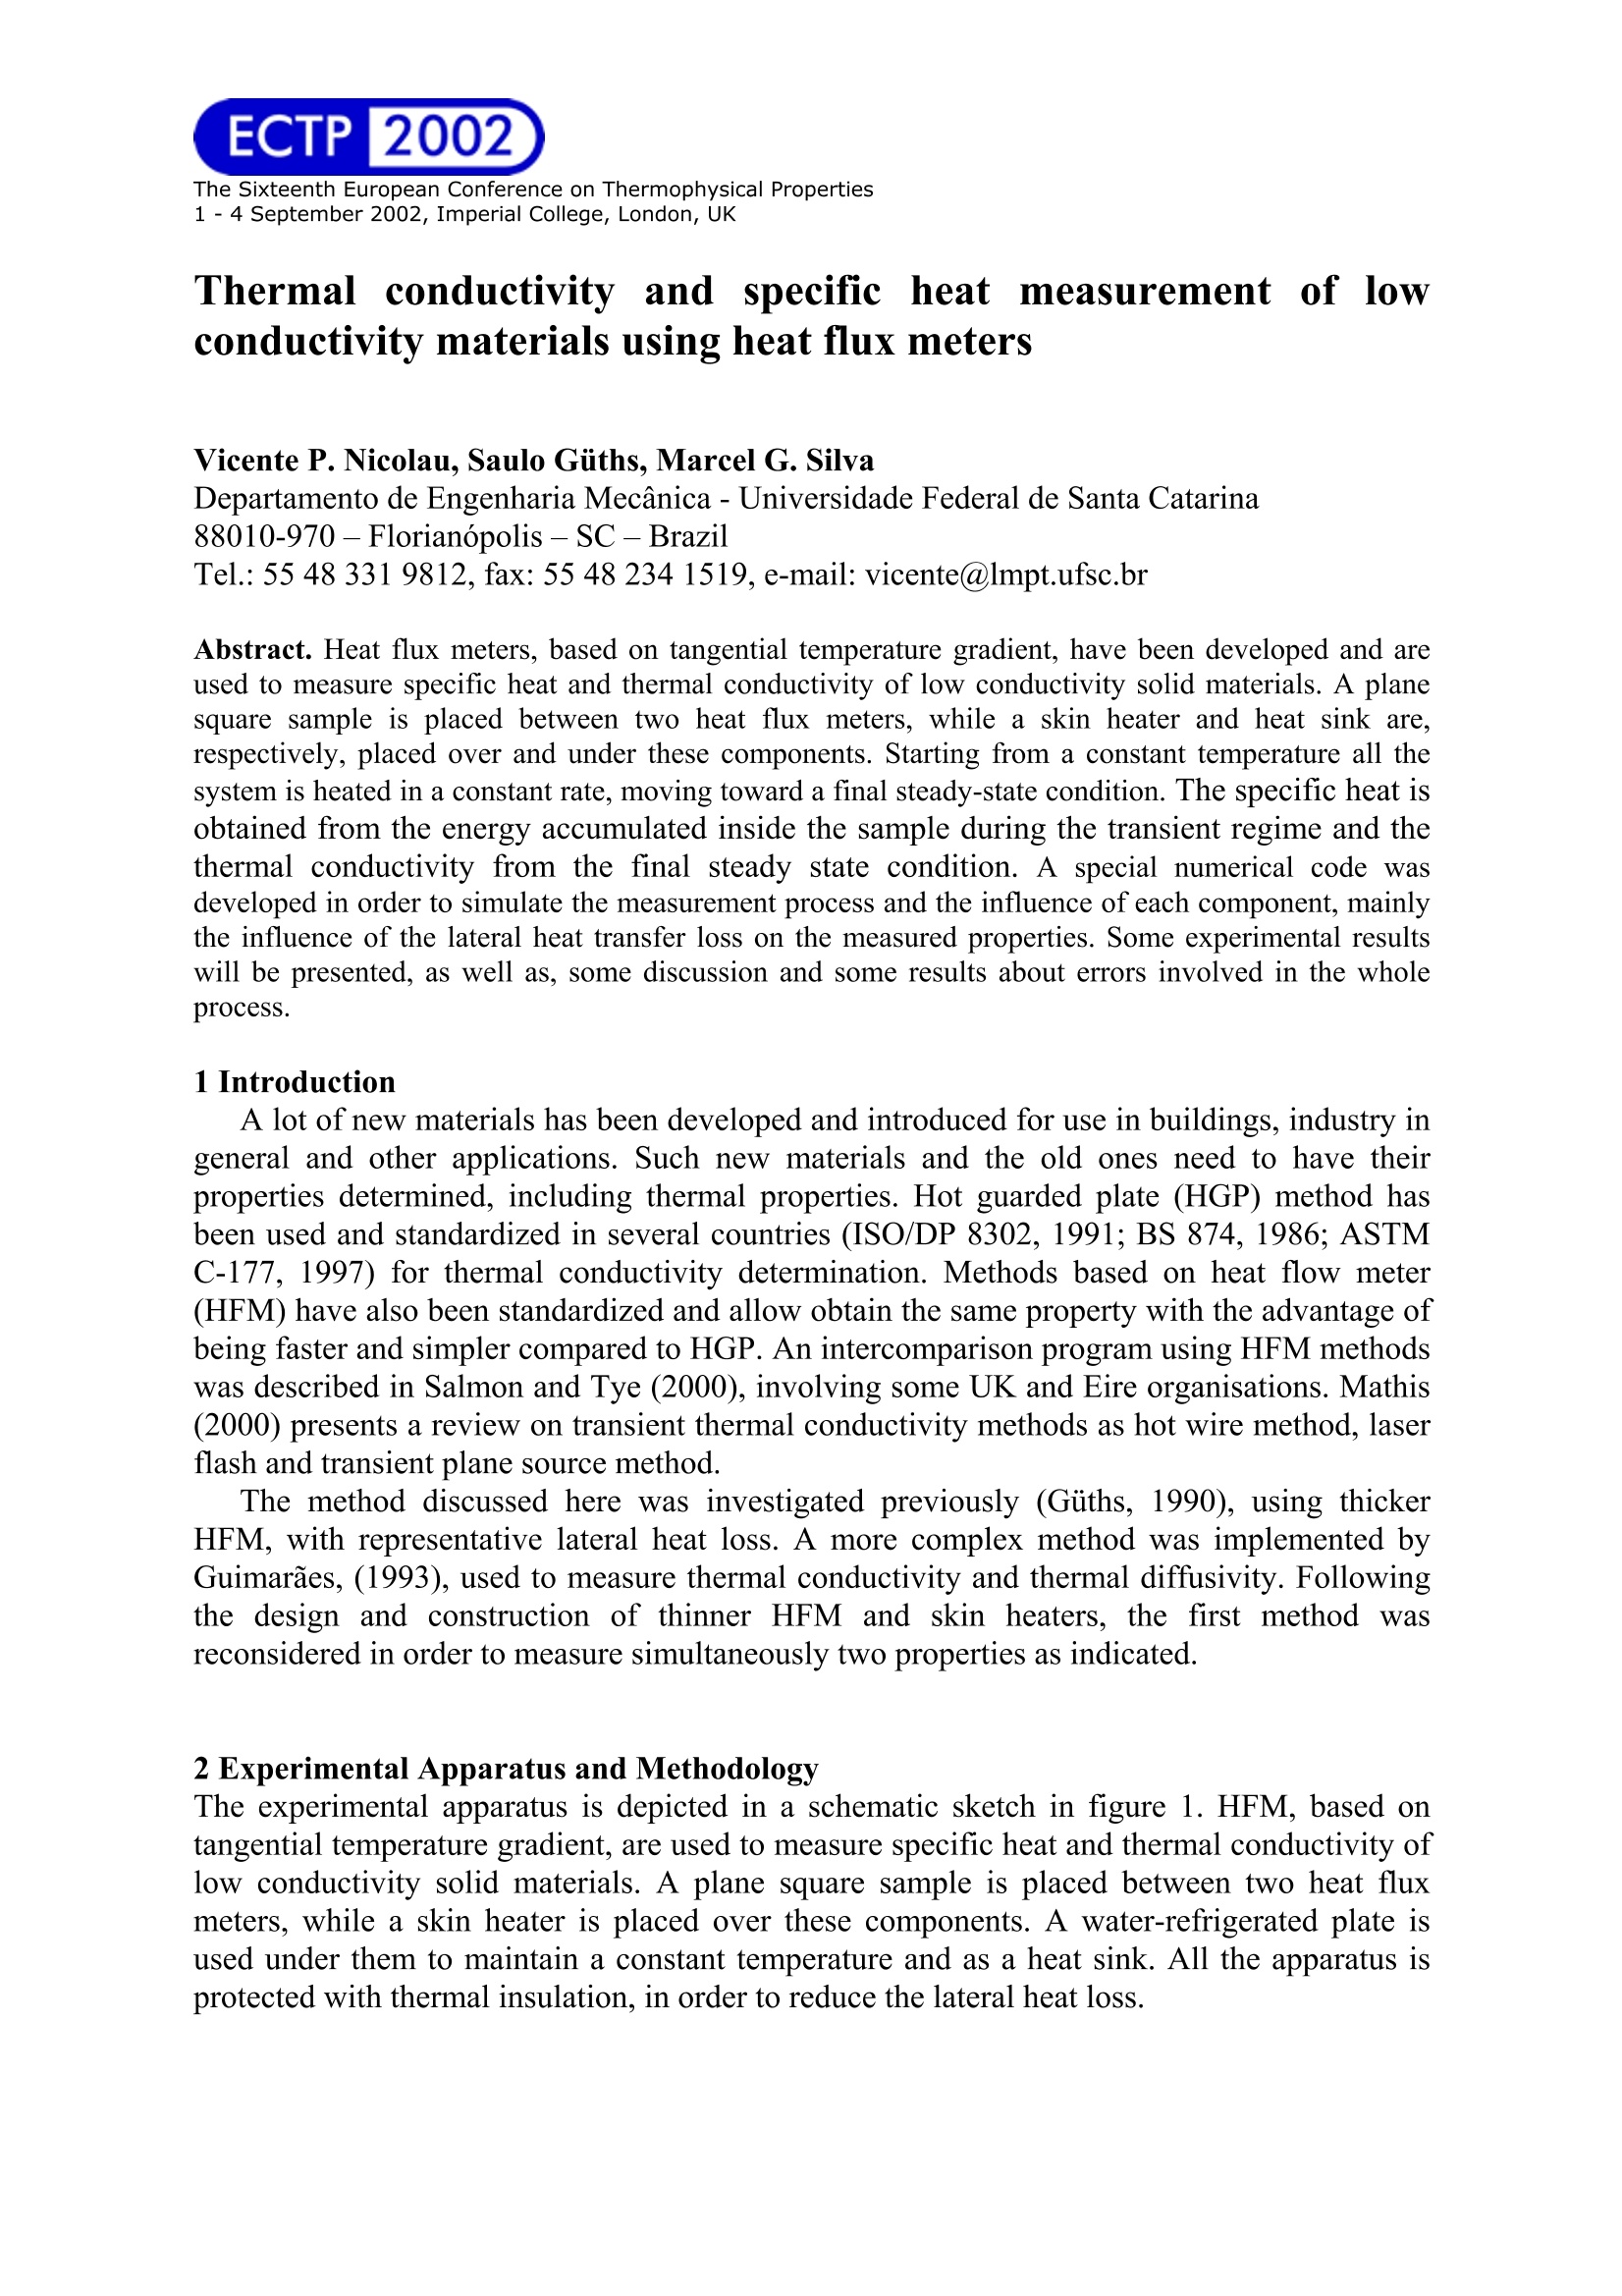
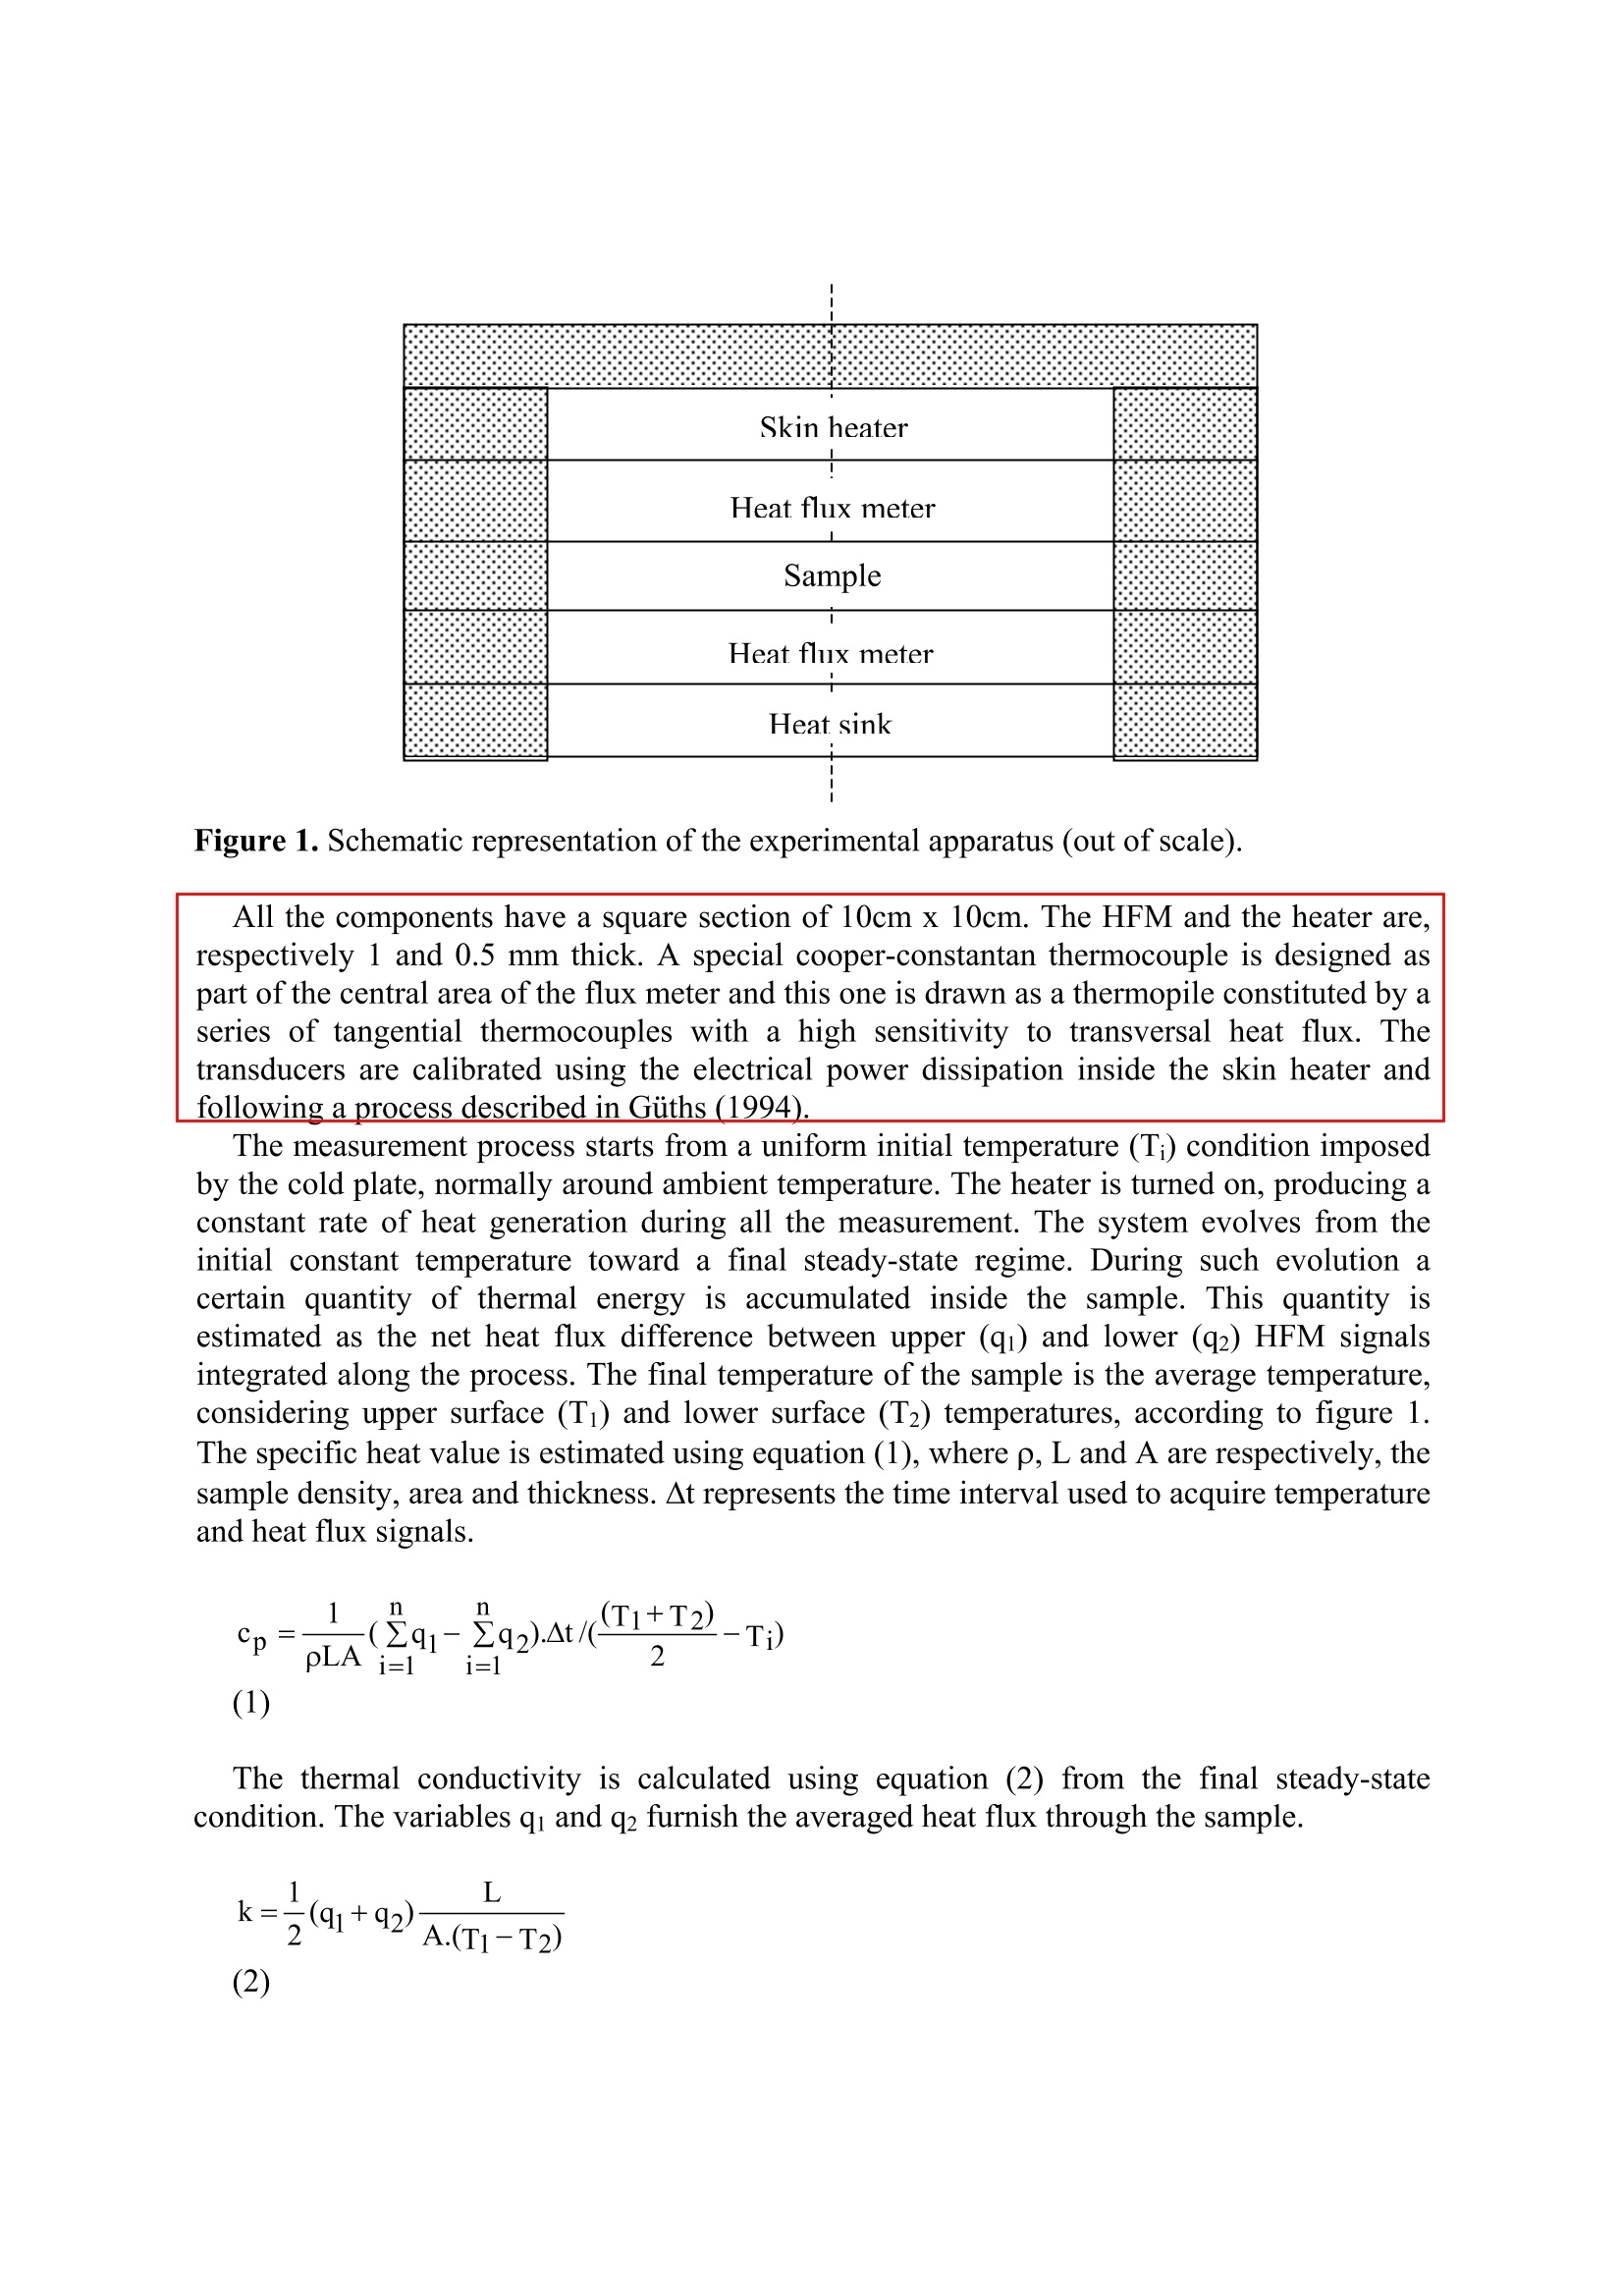
ECTP20022)The Sixteenth European Conference on Thermophysical Properties 1 - 4 September 2002, Imperial College, London, UK Thermal conductivity and specific heat measurementof lowconductivity materials using heat flux meters Vicente P. Nicolau, Saulo Giiths, Marcel G. Silva Departamento de Engenharia Mecanica-Universidade Federal de Santa Catarina 88010-970 -Florianopolis -SC -Brazil Tel.: 55 48 331 9812, fax: 55 48 234 1519, e-mail: vicente@lmpt.ufsc.br Abstract. Heat flux meters, based on tangential temperature gradient, have been developed and areused to measure specific heat and thermal conductivity of low conductivity solid materials. A planesquare sample is placed between two heat flux meters, while a skin heater and heat sink are,respectively, placed over and under these components. Starting from a constant temperature all thesystem is heated in a constant rate, moving toward a final steady-state condition. The specific heat isobtained from the energy accumulated inside the sample during the transient regime and thethermal conductivity from the final steady state condition. A special numerical code wasdeveloped in order to simulate the measurement process and the influence of each component, mainlythe influence of the lateral heat transfer loss on the measured properties. Some experimental resultswill be presented, as well as, some discussion and some results about errors involved in the wholeprocess. 1 Introduction A lot of new materials has been developed and introduced for use in buildings, industry ingeneral and other applications. Such new materials and the old ones need to have theirproperties determined, including thermal properties. Hot guarded plate(HGP) method hasbeen used and standardized in several countries (ISO/DP 8302, 1991; BS 874, 1986; ASTMC-177, 1997) for thermal conductivity determination. Methods based on heat flow meter(HFM) have also been standardized and allow obtain the same property with the advantage ofbeing faster and simpler compared to HGP. An intercomparison program using HFM methodswas described in Salmon and Tye (2000), involving some UK and Eire organisations. Mathis(2000) presents a review on transient thermal conductivity methods as hot wire method, laserflash and transient plane source method. The method discussed here was investigated previously (Guths, 1990), using thickerHFM, with representative lateral heat loss. A more complex method was implemented byGuimaraes, (1993), used to measure thermal conductivity and thermal diffusivity. Followingthe design and construction of thinner HFM and skin heaters, the first method wasreconsidered in order to measure simultaneously two properties as indicated. 2 Experimental Apparatus and Methodology The experimental apparatus is depicted in a schematic sketch in figure 1. HFM, based ontangential temperature gradient, are used to measure specific heat and thermal conductivity oflow conductivity solid materials. A plane square sample is placed between two heat fluxmeters, while a skin heater is placed over these components. A water-refrigerated plate isused under them to maintain a constant temperature and as a heat sink. All the apparatus isprotected with thermal insulation, in order to reduce the lateral heat loss. Figure 1. Schematic representation of the experimental apparatus (out of scale). All the components have a square section of 10cm x 10cm. The HFM and the heater are,respectively 1 and 0.5 mm thick. A special cooper-constantan thermocouple is designed aspart of the central area of the flux meter and this one is drawn as a thermopile constituted by aseries of tangential thermocouples with a high sensitivity to transversal heat flux. Thetransducers are calibrated using the electrical power dissipation inside the skin heater andfollowing a process described in Guths (1994) The measurement process starts from a uniform initial temperature (T;) condition imposedby the cold plate, normally around ambient temperature. The heater is turned on, producing aconstant rate of heat generation during all the measurement. The system evolves from theinitial constant temperature toward a final steady-state regime. During such evolution acertain quantity of thermal energy is accumulated inside the sample. This quantity isestimated as the net heat flux difference between upper (qi) and lower (q2) HFM signalsintegrated along the process. The final temperature of the sample is the average temperature,considering upper surface (Ti) and lower surface (T2) temperatures, according to figure 1.The specific heat value is estimated using equation (1), where p, L and A are respectively, thesample density, area and thickness. At represents the time interval used to acquire temperatureand heat flux signals. (1) The thermal conductivity is calculated using equation (2) from the final steady-statecondition. The variables qi and q2 furnish the averaged heat flux through the sample. (2) 3 Numerical Simulations Some difficulties are associated to this kind of measurement, as contact resistance,temperature determination of sample surfaces,HFM calibration, and so on. However, themost important problem inherent to this method is the lateral heat loss in the sample. Suchheat loss is responsible for the difference observed in the heat flux transducers signals, not soimportant when thermal conductivity is measured, but essentially important when specificheat is determined. As the last one is calculated by signal integration from the beginning up tothe end of the measurement, the difference between heat flux signals do not allow to establishclearly when the measurement must be stopped. Continuous calculations show the specificheat value increasing indefinitely even so steady-state regime is attained. In order to reducethe heat loss effect, a correction will be necessary, and such correction will be dependent onthe sample thickness. A numerical code using Fortran language was specially developed as a tool to determinethe relative importance of the heat loss on the values of the measured properties. The explicitform of finite difference method was considered to solve the heat equation appliedindividually to all components of the apparatus. The explicit method is very time consuming,but it is easier to be implemented. The numerical code allows obtain the temperature and heatflux distribution, the lateral heat loss in the sample, and to evaluate the values of theproperties determined following the same process used in the experimental method. Thesevalues are compared with those used to promote the simulation, allowing estimate theassociated experimental error. Following the simulation, figure 2 presents the upper and lower surface heat fluxes duringthe transient regime up to steady-state condition, for a nylon sample’s 6.2 mm thick. Theproperty values considered in the simulation are: k= 0.26 W/mK, cp=1730 J/kgK and p=1140kg/m’. The observed difference between heat fluxes is the sample’s accumulated energy,which is used to compute the specific heat value, according to equation (1). Figure 2. Upper (HFM-1) and lower surface (HFM-2) heat fluxes, for nylon sample 6.2 mmthick. Similar behaviour is observed in figure 3, where a 15.3 mm sample is simulated. Thecurves are more distant than those presented in the previous figure. More energy isaccumulated inside the sample, and a more important difference is observed between upperand lower surface heat fluxes, through the heating regime and when the system attains steady-state condition. Figure 3. Upper (HFM-1) and lower surface (HFM-2) heat fluxes, for nylon sample, 15.3 mmthick. The temperature distributions inside the sample are plotted in figure 4, for the thinnersample. The thickness (6.2 mm) was divided in 10 nodes, the temperatures ranging from 26 to36.5 ℃. In the radial direction 4 of the sample was taken into account, including also 10nodes in such direction (the x origin is the sample center, and Lsample is a half of the samplewidth). The lateral insulation was also considered, including 5 nodes. The configurationpresented in figure 4 is the final configuration when the steady-state condition is attained. Amore uniform distribution is observed in the low temperature surface, in contact with thelower transducer (HFM-2). On the hotter sample surface a temperature reduction is observedfrom the center to the border, showing clearly a lateral heat loss toward the insulation. As thecooling plate covers only the sample area, the insulation material shows some nodes withhigher temperature when compared with the sample temperature at the same level. Someenergy is lost near the upper surface of the sample and a little fraction is recovered to thesample near the lower surface. Specific heat results for a nylon sample (6.2 mm thick), is plotted in the figure 5, throughthe measurement time. The reference value is depicted as a horizontal line and such value isused in the simulation. The estimated value was obtained as defined in equation (1), followingthe accumulated difference between signals from upper and lower HFM. A constantincreasing in the specific heat value has the heat loss as the responsible agent. Even so steady-state condition is attained, heat flux on upper sample face is more important than theequivalent on the lower face. Such differences, from lateral heat loss, are accumulatederroneously as energy inside the sample. While the measurement is carried on, the specificheat value increases continuously. Two different corrections are then applied: in the first one the upper HFM signal is limited by the maximum value obtained in the lower HFM signal(the final value). This one is taken as true value, without interference from the lateral heatloss. The second type (called proportional correction), considers a correction applied on theheat flux on the upper surface equal to the ratio of final heat flux on the lower surface to finalheat flux on the upper surface. Both corrections stop the increasing tendency of cp value, aspresented in the figure 5, where the proportional correction represents to be more adequate forthe sample considered. Figure 4. Temperature distributions along parallel plans from upper to lower sample surfaces(sample thickness - 6.2 mm). Figure 5. Specific heat estimations with different correction methods (thickness -6.2 mm). Similar analysis was performed for a thicker sample (15.3 mm) and the results aresummarized in the Table 1 as an error related to the standard value used in the simulation. Inorder to reduce the influence of lateral heat loss on the measured values, another heat fluxtransducers were constructed, with the same dimensions as the previous ones, but using onlythe central area as sensitive area (50 mm x 50mm). The remaining external area has the samecharacteristics, but only the central area is active and responsible for the measurement. Someresults presented in the table 1 from measurement simulations, show a small error in the C,value for the value obtained from equation (1), without any correction, and a smaller errorwhen the correction based on the maximum value is applied. When the sensitive area in theHFM is only the central area, the proportional correction method promotes a more significanterror and must be discarded. Table 1. Simulated errors (%), in the specific heat calculation. Sample Measurement No correction - Correction: Correction: Maximum value thickness [mml areamm xmm Equation (1) Proportional 6.2 100x100 10.2 5.3 1.0 6.2 50 x 50 0.3 0.0 1.3 15.3 100x 100 12.1 0.6 9.6 15.3 50 x 50 3.6 1.0 6.9 Thermal conductivity determination is also simulated and some results are presented infigure 6. The property value should be calculated at the end, when the system reaches steady-state condition. However as it could be observed in figure 6, there is a convergence towardthe reference value faster than expected. It could be observed in addition, that time intervalnecessary to achieve the steady-state condition is dependent on the sample thickness. In thiscase HFM with sensitivity only in the central area were considered. Figure 6. Thermal conductivity estimation for samples with distinct thickness (HFM sensitiveonly in the central area). 4 Experimental Results Some experimental results were obtained and are presented here. The chosen samplematerial was nylon, with properties presented in the last topic. Before using the experimentalapparatus to measure properties, a checking on the transducers behavior has been executedand the results are presented in figure 7. The results show a heat flux rate variation imposedon the transducers in order to verify the system inertia. A small difference appears when a fastvariation is imposed,which is reduced when a constant power is restored. Figure 7. Transducers response checking to an imposed heat flux rate (without sample). Figure 8. Temperature evolution during measurement process -ambient and sample surfaces. As an example, figure 8 shows the temperature distributions for a sample 15.3 mm thick.Upper surface temperature experiments a strong growth, because of the proximity with theheat source. Otherwise, the temperature in the lower surface of the sample has a moreattenuated progression, stabilizing near the refrigeration bath temperature, in this case bellowambient temperature. The time necessary to stabilize is about one hour. Table 2. Experimental results for nylon samples. Material density [kg/m] Thermal conductivity W/mK1 Specific heatJ/kgK1 Nylon 6.2 mm 1.1510 0.22 1.7310 Nylon 15.3 mm 1.1410 0.27 1.74 10 Nylon 6.2 + 15.3 mm 一 0.28 1.73 10* Some experimental results for nylon samples are presented in table 2, for two specificthicknesses and a combination of these two samples. A good agreement is observed forspecific heat, but some differences are present in the thermal conductivity results. These arethe first results and new improvements are going to be implemented in order to obtain moreconfidence in the complete measurement system. Of coarse, it will be necessary to comparethe results for a specific sample, whose properties are well known, as it happens in anintercomparison program. 5 Conclusions The results have shown the possibilities of applying the presented method for specific heatand thermal conductivity determination using a plane sample. The thermal conductivitydetermination is straightforward in the sense that the measurement and calculations are verysimple. However for the specific heat the process is more complicated and a continuous dataacquisition is necessary. A correction must be applied to the measured heat transfer value inorder to impose a limit on such variable. This correction constitutes a drawback, but does not discard the method that must be improved and can be used to furnish good results in asecondary level measurement. Acknowledgement. This work was supported by CNPq - Conselho Nacional de DesenvolvimentoCientifico e Tecnol6gico - Brazil. References ISO/DP 8302,1991, Thermal insulation -Determination of steady-state thermal resistance andrelated properties - Guarded hot-plate apparatus. BS 874, 1986, Methods for determining thermal insulating properties - Part 2: Tests for thermalconductivity and related properties -Section 2.1: Guarded Hot-Plate Method. ASTM C-177, 1997, Standard test method for steady-state thermal transmission properties by meansof the guarded hot plate apparatus. Salmon D R, Tye R P, 2000 High Temperatures- High Pressures 32 19-28. ( Mathis N, 2000 High Temperatures - High Pressures 32 321-327. ) Giiths S, 1990 Um metodo transiente para a medicāo de propriedades termicas MSc ThesisMechanical Engineering-UFSC, Brasil. Guths S, 1994 Anemometre a effet Peltier et fluxmetre thermique: conception et realisation. Applicationa l'etude de la convection naturelle These de Doctorat, Universite d'Artois, France. Guimaraes G, 1993 Estimacio de parametros no dominio da frequencia para a determinacao simultanea.da condutividade e difusividade termica, Doctoral Thesis, Mechanical Engineering-UFSC, Brasil.
关闭-
1/9
-
2/9
还剩7页未读,是否继续阅读?
继续免费阅读全文产品配置单
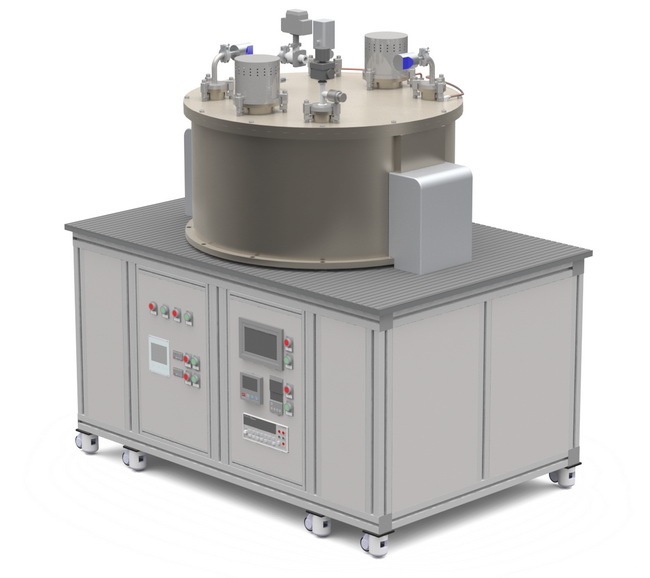
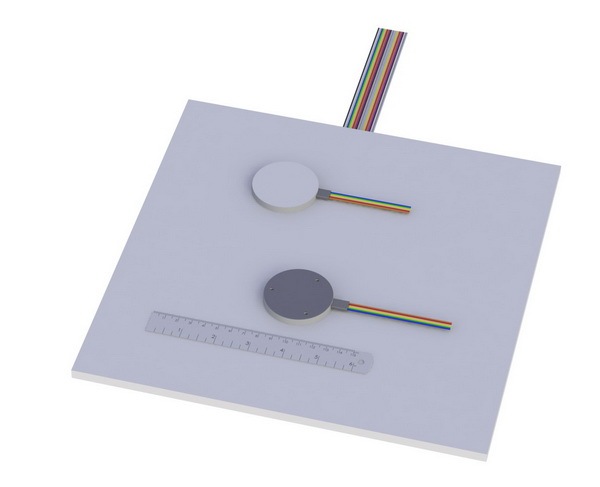
上海依阳实业有限公司为您提供《采用热流计法测量低导热材料的导热系数和比热容》,该方案主要用于其它中检测,参考标准《暂无》,《采用热流计法测量低导热材料的导热系数和比热容》用到的仪器有高温热流计法导热系数测试系统、高灵敏度热阻式热流计。
我要纠错
推荐专场
相关方案


 咨询
咨询


