方案详情文
智能文字提取功能测试中
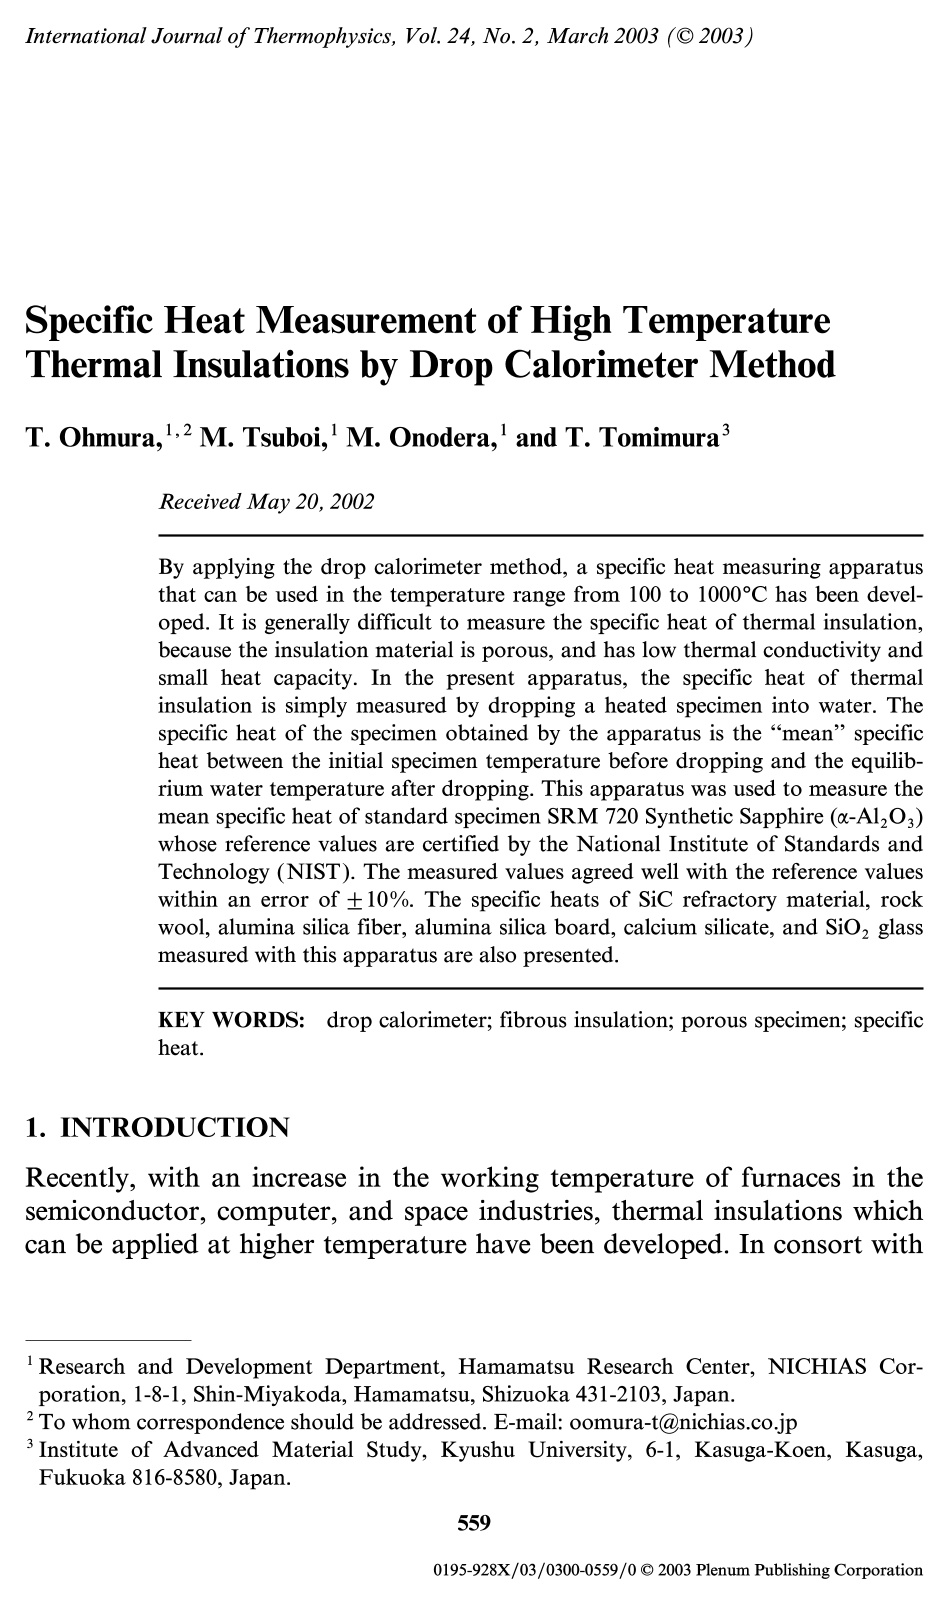
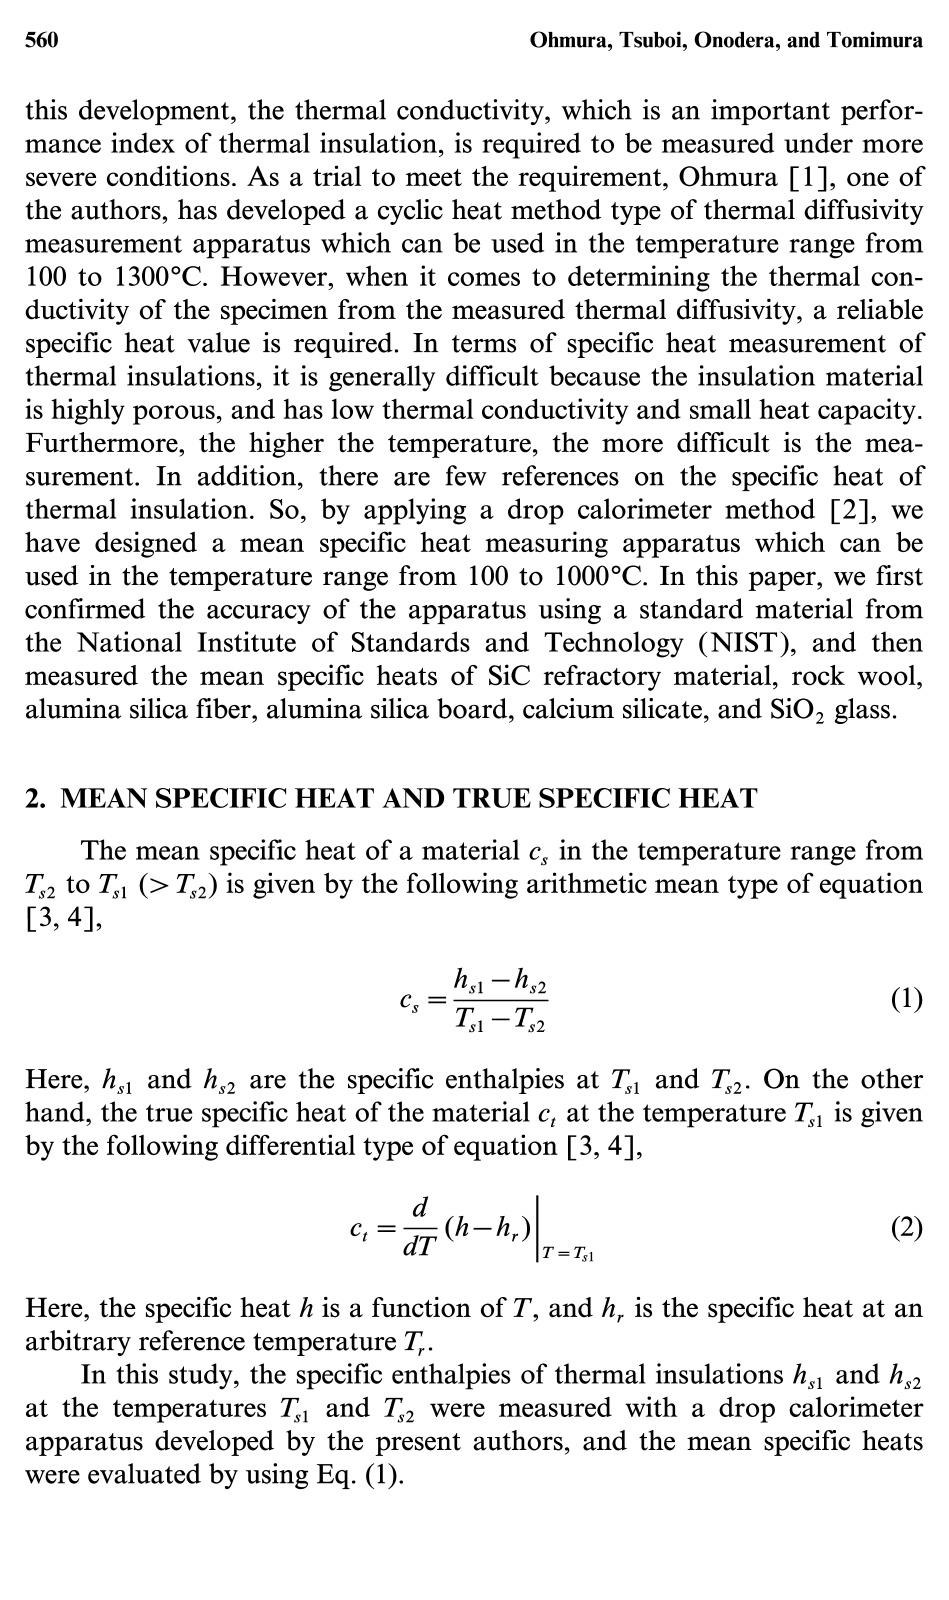
International Journal of Thermophysics, Vol.24, No.2, March 2003 (C 2003) Ohmura, Tsuboi, Onodera, and Tomimura560 5590195-928X/03/0300-0559/0 C 2003 Plenum Publishing Corporation Specific Heat Measurement of High TemperatureThermal Insulations by Drop Calorimeter Method T. Ohmura,1,2M. Tsuboi,M. Onodera, and T. Tomimura’ Received May 20, 2002 By applying the drop calorimeter method, a specific heat measuring apparatusthat can be used in the temperature range from 100 to 1000°C has been devel-oped. It is generally difficult to measure the specific heat of thermal insulation,because the insulation material is porous, and has low thermal conductivity andsmall heat capacity. In the present apparatus, the specific heat of thermalinsulation is simply measured by dropping a heated specimen into water. Thespecific heat of the specimen obtained by the apparatus is the “mean”specificheat between the initial specimen temperature before dropping and the equilib-rium water temperature after dropping. This apparatus was used to measure themean specific heat of standard specimen SRM 720 Synthetic Sapphire (-Al,O;)whose reference values are certified by the National Institute of Standards andTechnology (NIST). The measured values agreed well with the reference valueswithin an error of ±10%.The specific heats of SiC refractory material, rockwool, alumina silica fiber, alumina silica board, calcium silicate, and SiO, glassmeasured with this apparatus are also presented. KEY WORDS:(drop calorimeter; fibrous insulation; porous specimen; specificheat. 1. INTRODUCTION Recently, with an increase in the working temperature of furnaces in thesemiconductor, computer, and space industries, thermal insulations whichcan be applied at higher temperature have been developed. In consort with ( Research a nd Development Department, H amamatsu R e search C e nter, N ICHIAS Co r - poration, 1-8-1, Shin-Miyakoda, Hamamatsu, Shizuoka 431-2103, Japan. ) ( To whom correspondence sh o uld be addressed. E -mail: oomura-t@nichias.co.jp ) ( I n stitute of Advanced M a terial Study, K y ushu Un i versity, 6 - 1, K a suga-Koen, Ka s uga, Fukuoka 816-8580, Japan. ) this development, the thermal conductivity, which is an important perfor-mance index of thermal insulation, is required to be measured under moresevere conditions. As a trial to meet the requirement, Ohmura [1], one ofthe authors, has developed a cyclic heat method type of thermal diffusivitymeasurement apparatus which can be used in the temperature range from100 to 1300C. However, when it comes to determining the thermal con-ductivity of the specimen from the measured thermal diffusivity, a reliablespecific heat value is required. In terms of specific heat measurement ofthermal insulations, it is generally difficult because the insulation materialis highly porous, and has low thermal conductivity and small heat capacity.Furthermore, the higher the temperature, the more difficult is the mea-surement. In addition, there are few references on the specific heat ofthermal insulation. So, by applying a drop calorimeter method [2], wehave designed a mean specific heat measuring apparatus which can beused in the temperature range from 100 to 1000°C. In this paper, we firstconfirmed the accuracy of the apparatus using a standard material fromthe National Institute of Standards and Technology (NIST), and thenmeasured the mean specific heats of SiC refractory material, rock wool,alumina silica fiber, alumina silica board, calcium silicate, and SiO, glass. 2. MEAN SPECIFIC HEAT AND TRUE SPECIFIC HEAT The mean specific heat of a material c, in the temperature range fromT2 to Ti (>T2) is given by the following arithmetic mean type of equation[3,4], Here, hs and h,2 are the specific enthalpies at Tsi and T2. On the otherhand, the true specific heat of the material c, at the temperature T is givenby the following differential type of equation [3,4], Here, the specific heat h is a function of T,and h, is the specific heat at anarbitrary reference temperature T,. In this study, the specific enthalpies of thermal insulations h, and h,at the temperatures Ti and T2 were measured with a drop calorimeterapparatus developed by the present authors, and the mean specific heatswere evaluated by using Eq. (1). 3. MEASURING TECHNIQUES AND APPARATUS The mean specific heat c, is evaluated by measuring the temperaturerise of water, which has been first kept at room temperature, and thenreaches a higher equilibrium temperature after the heated specimen isdropped into it. In the evaluation of the mean specific heat c., the followingtwo points are taken into consideration. (1)Since the initial specimen temperature is higher than 100°C,water in the vicinity of the specimen evaporates vigorously, andthis leads to heat loss accompanied with vapor released from themeasuring system. (2) The temperature rise of water after dropping a specimen is typi-cally 2 to 15℃, which results in heat loss from water to theinternal wall of the water tank (see Fig. 3). From the above discussion, the relation among the total quantity of heatgiven up by the high temperature specimen , the amount of heatsobtained by the water and the internal wall of the water tank g and gc,and the amount of heat lost from water caused by evaporation are given by Here, c is the mean specific heat, r is the latent heat of evaporation,m isthe mass, and T is the temperature. The subscripts c, s, u, w, 1, andrepresent the internal wall of water tank, the specimen,evaporation, water,before dropping, and after dropping, respectively. Since the measuringsystem is put in thermal equilibrium conditions before and after droppingthe specimen, the following relations are assumed: From Eqs. (3) to (7), the mean specific heat c, in the temperature rangefrom T2 to Tei is given by the following equation, Fig. 1..IExample of mean specific heet 一surement. Twi and T2 are the water temperaturesbefore and after dropping the specimen. Figure 1 shows an example of the temperature change of water withtime before and after dropping an alumina silica fiber. In this example, themasses of the water and specimen are 47.4 and 3.3 g, respectively. Theinitial temperatures of the specimen and water are 895 and 20C, respec-tively. From the figure, it is seen that the water temperatures measured bytwo thermocouples (both K-type; 0.3 mm in diameter), one of which isfixed at about 10 mm from the bottom of the water tank and the other isused for both measuring the temperature and mixing the water, rise rightafter dropping the specimen and then soon settle at some equilibrium tem-perature. Here,Twand Tw2 represent the average water temperatures beforeand after dropping the specimen, respectively. In Fig. 1, overshoots ofwater temperatures are observed. This is because the thermocouples comein touch with the high temperature specimen in the water tank. Figure 2 shows a schematic of the mean specific heat measuring appa-ratus [1]. As briefly mentioned above, the two thermocouples ⑤-1 areused for measuring the water temperature in the tank ⑥. The cylindrical heater ① 152 mm long with an ID and OD of 89 and191 mm can increase the specimen temperature up to 1000°C, and can beinclined down to 20 degrees to the horizontal plane for dropping the spe-cimen easily. The dimensions of the specimen ② are about 20 mm inlength, 20 mm in width, and 20 mm in thickness. By weighing the change inwater mass by spontaneous evaporation from the water tank ② during themean specific heat measurement, the amount of vapor released from thewater tank ⑥ by vigorous evaporation induced by the high temperaturespecimen was estimated. Thus, the estimated amount of the vapor wastaken into account when evaluating the mean specific heat with Eq. (8).The water tanks ):and are ordinary disposable cups made of paper. Fig. 2.Schematic of mean specific heat measuring apparatus. Dimensions in mm. The support plate ⑧, which is also made of the same paper as the tanks, isput on the bottom of the measuring water tank⑥ to prevent heat lossthrough the tank bottom. Figure 3 shows a schematic of the measuring water tank ⑥. The tankis composed of two paper cups laminated with each other. This structureenables the water tank to have a thin thermal insulation air layer betweenthe cups. The water tanks ⑥ and ⑦ are surrounded by calcium silicateinsulation. The K-type thermocouples of 0.3 mm in diameter are attachedon the internal and external walls of the water tank to measure the Te on external wall ofwater tank Tc on internal wall of Te : Thermocouple Fig. 3.. Schematic of water tank for mean specific heat measurement. Dimensionsinmm. Fig. 4.Mean specific heat of paper used1 forwater tank and support plate: (0) measured bythe hot disk method; () measured by the DSCmethod;(—) least squares fit of the measuredresults. temperature rise of the water tank after dropping a high temperaturespecimen. Throughout the present measurements, a value of 4.18 kJ·kg-K-[5] was adopted as the specific heat of water c,. The mean specific heat ofthe paper used for the water tank and the support plate was measured withthe hot disk and DSC methods. Figure 4 shows the measured specific heatof the paper. Broadly, the specific heats shown in Fig. 4 can be consideredto be the true specific heat. This is because the present specific heats of thepaper were evaluated under small temperature differences. For example,when measured at 60°C with the DSC method,the temperature rangein the measurement is from 55 to 65°C. In the same manner, the specificheat was obtained using the hot disk method in the temperature rangefrom 20 to 25°C. Anyhow, based on those measured results, we adopted1.17kJ·kg-K- as the mean specific heat of the water tanks and thesupport plate. 4. MEASUREMENT ERROR 4.1. Heat Loss When Dropping a Specimen During the process of moving a specimen from the cylindrical heaterto the measuring water tank, some amount of heat is lost necessarily fromthe specimen to the ambient air. Then, to determine the amount of heatloss, we measured the temperature change of a specimen with time. A spe-cimen with almost the same dimensions as the specimens in the presentmeasurements was held with a pair of tweezers in air after taking it outfrom the cylindrical heater. The temperature change of the specimen wasmeasured by a K-type thermocouple of 0.3 mm in diameter which wasinserted at the center of the specimen. Figure 5 shows the measured temperature change with time. Thesymbol;s ◇,口,A, and O represent the results measured at the initial spe-cimen temperatures of 100, 300, 600, and 1000℃ (that is, before taken outfrom the cylindrical heater), respectively. Here, the dimensionless tempera-ture on the longitudinal axis represents the temperature difference betweenthe specimen center and the ambient air normalized by the differencebetween the initial specimen temperature and the ambient air temperature.From the figure, even if two seconds are required to move the specimenfrom the cylindrical heater to the measuring water tank, the temperaturedrop of the specimen during the process is within 3%. Therefore, the ratioof the quantity of heat lost from the specimen to the ambient air Or to the Fig. 5.TTransientttemperature change of asample cube in air (Temperature at the center ofthe cube):◇,口, A, o are the measured valuesat initial specimen temperatures of 100, 300, 600,1000°C, respectively. total quantity of heat held by the specimen at the initial state Q, is given by However, in the above investigation, only the temperature change at thespecimen center is taken into consideration, which may lead to an under-estimation of Qr. Accordingly, we re-estimated Or by using a chart on heatloss of a sphere with time on referring to the literature [6], for instance.In the present estimation, the cubic specimen (20mmx20 mm×20 mm)was regarded as a sphere with an equivalent radius of 12.4 mm. The bulkdensity, the specific heat, and the thermal conductivity of the specimen,and the mean heat transfer coefficient between the specimen and the ambientair were assumed to be 130 kg·m-3,1000J·kg-1K-,0.2W·m- K-, and15 W·m-.K-, respectively. From the chart for the required time of 2 s,the ratio of the heat Qr lost from the specimen to the ambient air to thetotal quantity of heat O, held by the specimen at the initial state is given by 4.2. Heat Loss to Measuring Water Tank and Thermal Insulation In the evaluation of mean specific heats using Eq. (8), heat loss to theinternal wall of the measuring water tank , is considered as explained in Table I. Temperature Rise in Each Part of Water Tank Temperature rise (C) Initial specimen temperature (C) 100 300 600 Water in tank 0.43 2.1 6.0 Internal wall of water tank 0.34 2.0 6.1 External wall of water tank 0.24 1.5 3.5 Thermal insulation 0.18 0.76 2.4 the previous Section 3 (see Eq. (6)). However, heat losses to the externalwall of the water tank and the surrounding thermal insulation are nottaken into account here. In this section, we show the results on the effectsof those heat losses on the accuracy of measurement. Table I lists the temperature rise in each part of the measuring watertank system after dropping a rock wool specimen with initial temperaturesof 100, 300, and 600°C. The temperature rise of water in the tank is almostthe same as that of the internal wall of the tank. As for the temperaturerises of the external wall of the water tank and the surrounding thermalinsulation, relatively high values were observed. Then, to investigate it inmore detail, we estimated the amount of heat that could be accumulated ineach part of the water tank system after dropping the specimen. Table II shows an example estimated by using the temperature riselisted in Table I for the specimen mass m, =2.64 g and the initial tempera-ture T1=600°C. Here, the mean specific heat of water c,, is referenced to avalue in the literature [5]. Concerning the heat accumulated in the thermalinsulation, it was estimated by assuming that the heat flowing in from thewater tank is accumulated in the surrounding layer of 3 mm thickness,which is about 8% of its mean thickness of 40 mm. From the estimationdescribed above, the ratios of the quantities of heat accumulated in theexternal wall of the water tank Ou and in the thermal insulation Om to the Table II. Accumulated Heat in Each Part of Water Tank Mass Specific heat Temperature Accumulated (g) (kJ·kgK-) rise (C) heat (J) Water in tank 46.8 4.18 6.0 1.18×10 Internal wall of water tank 4.25 1.17 6.1 30.3 External wall of water tank 4.25 1.17 3.5 17.6 Thermal insulation 4.52 1.02 2.4 11.1 total quantity of heat held by the specimen at the initial state Q. (in thisexample, 1.27×10’J) are given by 4.3. Error Caused by Assumption of Constant Specific Heats for WaterTank and Water As shown in Fig.4, the mean specific heat of the water tank changeswith temperature. When the temperature of the water tank changes by±3℃ at a temperature of 40℃ for instance, its mean specific heat cchanges by about ±0.15kJ·kg-.K-. Then, by using the values shown inTable II, the quantity of heat Oiy corresponding to this change in the meanspecific heat c is estimated at an initial specimen temperature 600°C, forexample, the following result is obtained. Therefore, the ratio of the quantity of heat Orv corresponding to thechange in c to the total quantity of heat held by the specimen at the initialstate Q, is given by Meanwhile, the specific heat of water is 4.175 to 4.183 kJ·kg-·K-inthe temperature range from 20 to 40℃[5]. Therefore, it can be consideredthat the change in the specific heat of water has virtually no effect on theevaluation of the mean specific heat of specimen. 4.4. Error Accompanying Evaporation of Water The amount of water that evaporates from the measuring water tankwas estimated by subtracting a mass change before and after dropping aspecimen in the monitoring water tank from that in the measuring watertank. In the present study, the amount of evaporation is 30 to 50 mg, anda balance which has a minimum scale of 0.1 mg was used for the mea-surements. As for the latent heat of evaporation, its value is 22454 to 2406 kJ·kg-in the temperature range from 20 to 40℃ [5], and here, thevalue was assumed to be 2436kJ·kg. Furthermore, the amount of heatdissipated to raise the temperature of water from 20 to 100°C is neglectedin Eq. (8). Therefore, the error accompanying the evaporation of water isgiven by 4.5. Total Heat Loss From Eqs. (10) to (15) shown above, the ratio of the overall heat lossCloss arising during mean specific heat measurements to O, is given by Therefore, the measurement error in the present system can be estimated tobe about 9% at maximum. 5. SPECIFIC HEATMEASUREMENT OF STANDARD MATERIAL To confirm the accuracy of measurement for the present apparatus, wemeasured mean specific heats of the standard material SRM 720 SyntheticSapphire (a-A1O3), whose reference values are certified by the NationalInstitute of Standards and Technology (NIST)[7]. NIST has proposed the following approximation equation for thespecific enthalpy h (J·mol-) of a-Al,O in the temperature range from 0to 900°C (the absolute temperature 0; from 273.15 to 1173.15 K). Here, Fig. 6. Specific enthalpy of the standard specimenSRM 720 Synthetic Sapphire (a-A1203):(O)measured values; (——) Standard values by NIST;(---)±5% deviations from the solid line. The specific enthalpy h was measured using an Bunsen ice calorimeter, and0 represents the initial specimen temperature. For the purpose of comparing the specific enthalpies measured by thepresent apparatus with those calculated by Eq. (17), we first recalculatedthe specific enthalpy differences h-h293.15 using Eq. (17). Here, h293.15 is thespecific enthalpy at 20C. The results are shown in Fig. 6. The symbol·shows the measured specific enthalpies, and these values are plotted againstthe initial specimen temperature T. The solid line represents the specificenthalpy h-h293.15 by NIST,and is also plotted against T1. The two brokenlines are ±10% deviations from the solid line. As seen from the figure, Fig. 7.Mean specific heat of the standard spe-cimen SRM 720 Synthetic Sapphire (-A1,O;):()measured values; (——) Standard values by NIST;(-- -)±5% deviations from the solid line. Table ⅢI.Thermal Insulations Measured in This Study Density Measured temperature range p(kgm-) T (C) SiC refractory material 2800 290 to 1000 Rock wool 100 100 to700 Alumina silica fiber 130 100 to 1000 Alumina silica board 320 200 to 800 Calcium silicate 120 100 to 1000 SiO, glass 2465 200 to 600 the measured results agree with the reference solid line within ±10% in thetemperature range from 100 to 1000°C. Similarly, Fig. 7 compares the measured mean specific heats with thereference solid line by NIST. In the figure, the solid line was obtained bysubstituting Eq. (17) into Eq. (1), that is, by dividing (hs1-h293.15) by(T-20). Here, the meanings of the symbol· and the two broken lines arethe same with those in Fig. 6. In this example, too, the measured resultsagree with the reference solid line within almost ±10% in the temperaturerange from 100 to 1000°C. From the results shown above, the present apparatus can be said tohave sufficient accuracy to measure the mean specific heats of thermalinsulations for practical use. 6. MEASURED MATERIALS Six kinds of thermal insulations selected in this study are listed inTable III. Here, p means bulk density, except for SiO glass. The composi-tion of each thermal insulation [8, 9] is also shown in Table IV. Table IV. Composition of Each Thermal Insulation (mass%) SiO, A10: CaO MgO Fe,0 SiC SiC refractory material Rock wool 40.7 20 14.9 33.3 5.5 2.6 Alumina silica fiber Alumina silica board Calcium silicate 43.5 7.1 29.0 0.7 2.9 SiOz glass 75 15 Fig.8. Meanspecific heat of SiC refractorymaterial: (●) measured values; (——) least squaresfit of the measured results; (-- -)±5% deviationsfrom the solid line. 7. RESULTS AND DISCUSSION The mean specific heats c, of the SiC refractory material, the rockwool, the alumina silica fiber, the alumina silica board, the calcium silicate,and the SiO glass are shown in Figs. 8-13, respectively. In each figure, themean specific heat values are plotted against the initial specimen tempera-ture Ti. The symbol· represents the measured values, and the solid linerepresents the following logarithmic equation approximated by using leastsquares. Fig. 9.. Mean specific heat of rock wool: (●)measured values; (—) least squares fit of themeasured results; (---)±5% deviations from thesolid line. Fig. 10.Mean specific heat of alumina silicafiber: (●) measured values; (—) least squares fitof the measured results; (---)±5% deviationsfrom the solid line. Here, the coefficients co and c are listed in Table V. Furthermore, thebroken lines indicate ±5% deviations from the solid line. From thesefigures, it can be seen that the mean specific heats of various kinds ofmaterials are distributed within ±5% deviations from Eq. (19). Although mean specific heats of many kinds of ceramics (for example,AlO3, SiC, SiO2, etc.) have been measured over a wide range of tempera-tures, there are few references on mean specific heats of thermal insulationswhich are made of ceramics. Even if there are some reference values, themethod of measurement, initial specimen temperatures, and other importantinformation are rarely specified. Furthermore, in some cases, compounding Fig. 11.Mean specific heat of alumina silicaboard: () measured values; () least squaresfit of the measured results; (---) ±5% devia-tions from the solid line. Fig. 12.Mean specific heat of calcium silicate:(●) measured values; (—) least squares fit of themeasured results; (-- -)±5% deviations from thesolid line. Fig. 13. Mean specific heat of SiO, glass: ()measured values; (—) least squares fit of themeasured results;(---)±5% deviations from thesolid line. Table V. Coefficients of Eq. (19) for Various Types of Thermal Insulations Co C1 SiC refractory material 3.37×10⁻¹² 1.53×10- Rock wool 1.91×10- 1.04×10- Alumina silica fiber -8.75×10⁻² 1.57×10--1 Alumina silica board -4.59×10- 2.25×10- Calcium silicate 4.39×10- 8.29×10- SiO, glass -2.86×10- 2.01×10- ratios of materials in thermal insulations, which are commercially availableunder the same name, differ from one another depending on companies.So, for the present state, it is difficult to compare the measured results withother results. Collecting data on mean and true specific heats of thermalinsulations whose conditions of measurements are precise and comparisonswith relevant investigations are the subject for a future study. 8. CONCLUSIONS By applying the drop calorimeter method,we have designed a meanspecific heat measuring apparatus that can be used in the temperaturerange from 100 to 1000°℃. Using this apparatus, we first measured meanspecific heats of the standard material SRM 720 Synthetic Sapphire(a-A1,O3), whose reference values are certified by the National Institute ofStandards and Technology (NIST), and confirmed that the measuredresults agreed with the reference values within ±10% deviations. Next,based on the results, we measured the mean specific heats of SiC refractorymaterial, rock wool, alumina silica fiber, alumina silica board, calciumsilicate, and SiOz glass. Furthermore, for those thermal insulations, wepresented logarithmic equations for the mean specific heat expressed as afunction of the initial specimen temperature. REFERENCES 1. T. Omura, Int. J. Soc. Mater. Eng. Resour.9:17 (2001). ( 2. Thermophysical Properties Handboo e k ( Japan Society of Thermophysical Pr o perties,Yokendo, Tokyo, 1990), p. 546 (in Japanese). ) ( 3 . Shin-Jikken Kagaku K ouza 2, K isogijutsu 1 Netsu· Atsuryoku (Maruzen, T okyo, 1977), p . 1 86 ( in Japanese). ) ( 4. D. E . Sharp a nd L. B. G inther, J . Am. C eramic Soc. 34:260 (1951). ) ( 5. Thermophysical P roperties Handbook c (Japan Society of Thermophysical il P Properties, Yokendo, Tokyo, 1990), p. 64(in Japanese). ) 6. J. P. Holman, Heat Transfer (McGraw-Hill, New York, 1989), pp. 147-148. ( 7. N ational B ureau of S t andards Certificate, Standard R eference M aterial 7 20, S ynthetic S apphire -A1,O. (Nat. Inst. Stds. Tech., Gaithersbarg, Maryland, 1982). ) ( 8. Handbook of Ceramics Technology (Japan Society o f Ceramics, Gihoudo, T okyo, 1 9 93), pp. 1720-1729 (in Japanese). ) ( 9. C alcium S i licate Thermal Insulation Materials (Society of Calcium Silicate Ther m al Insula- tion, Tokyo, 2 001), p . 9 (in Japanese). )
关闭-
1/17
-
2/17
还剩15页未读,是否继续阅读?
继续免费阅读全文产品配置单
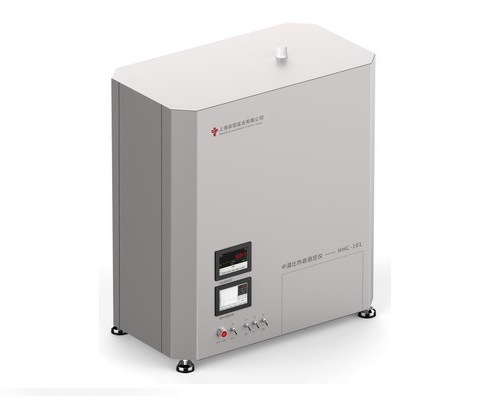
上海依阳实业有限公司为您提供《隔热材料中高温比热检测方案 》,该方案主要用于其他中高温比热检测,参考标准《暂无》,《隔热材料中高温比热检测方案 》用到的仪器有下落法中温量热仪/比热容测定仪。
我要纠错
推荐专场
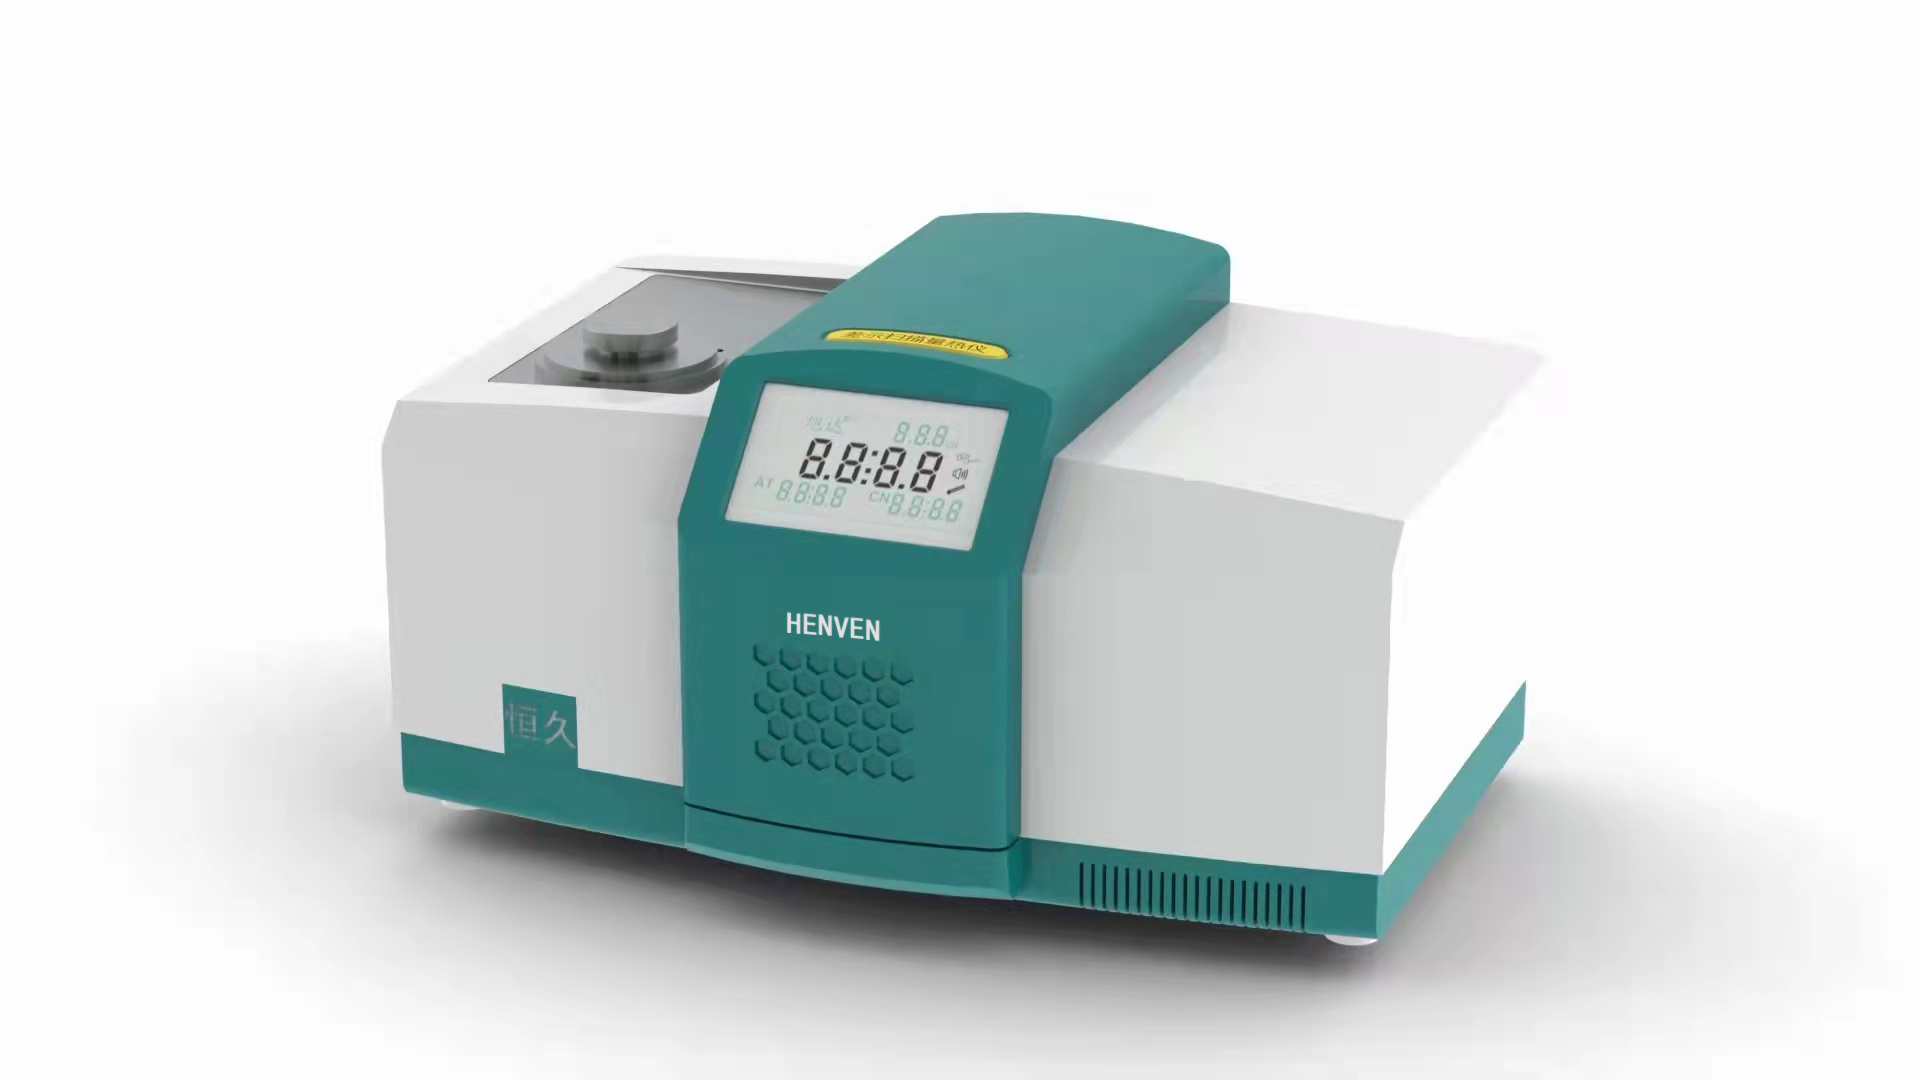
差示扫描量热仪(DSC/DTA)
更多相关方案




 咨询
咨询