

方案详情文
智能文字提取功能测试中
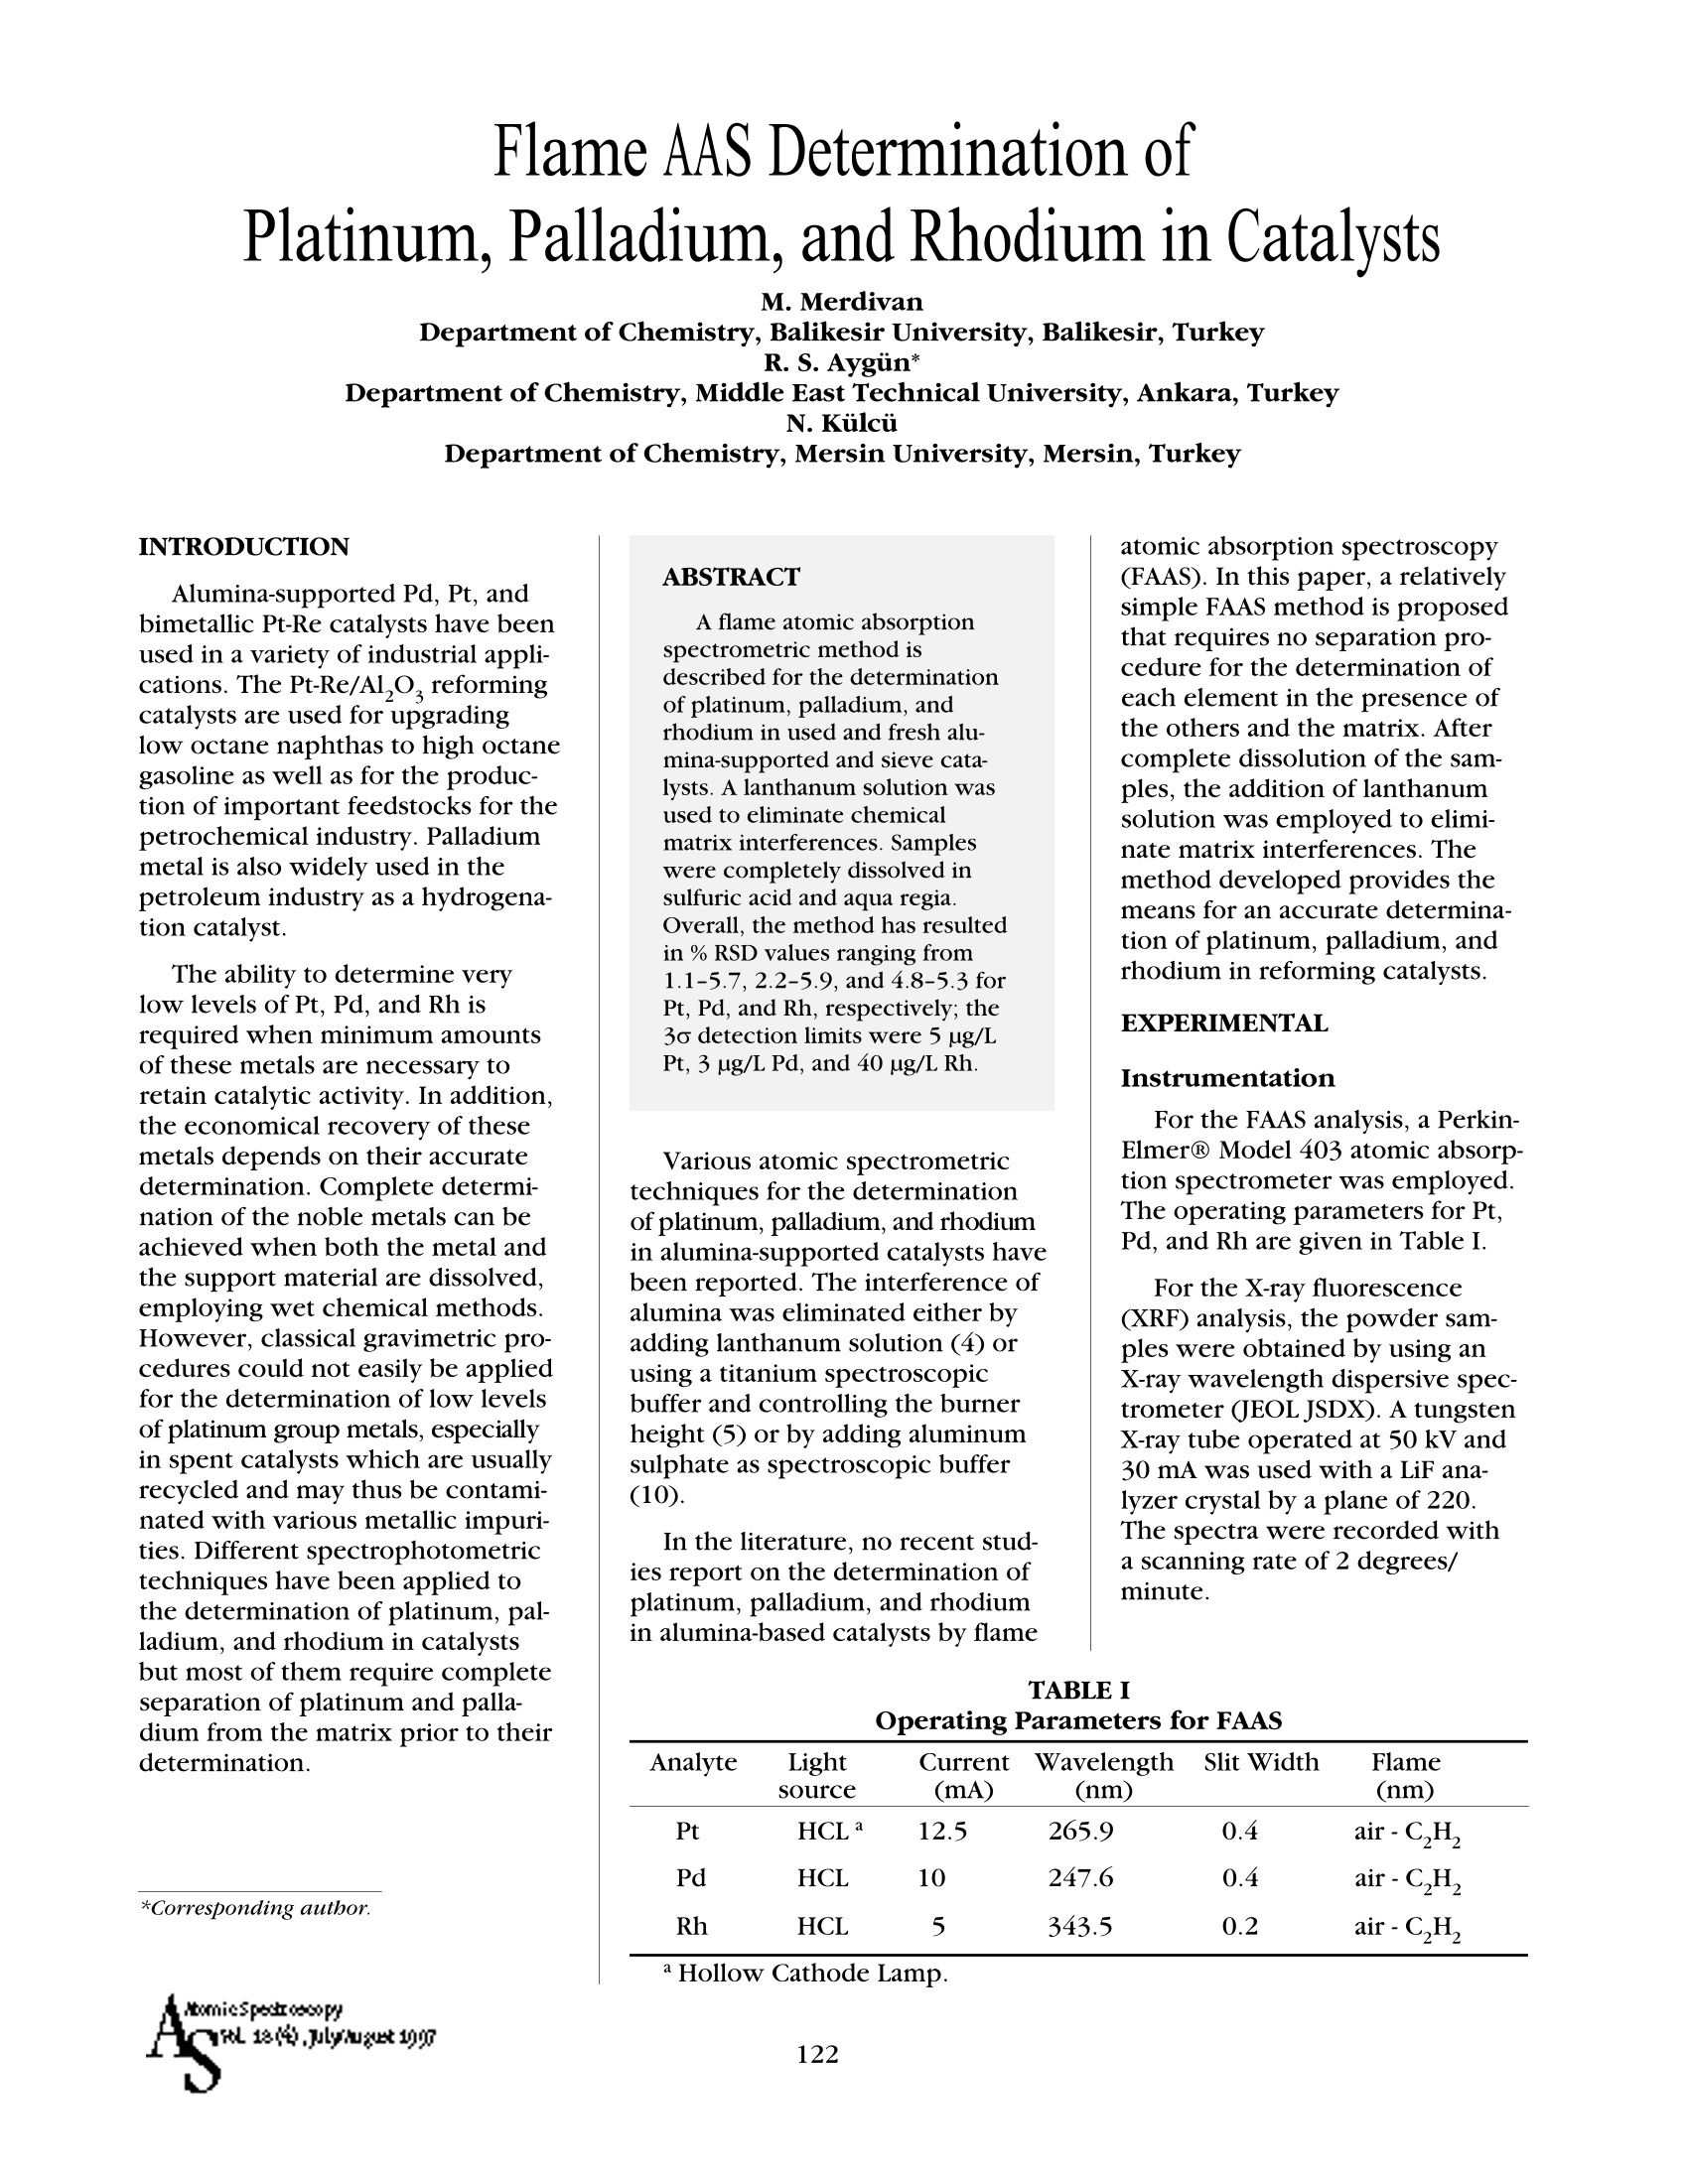
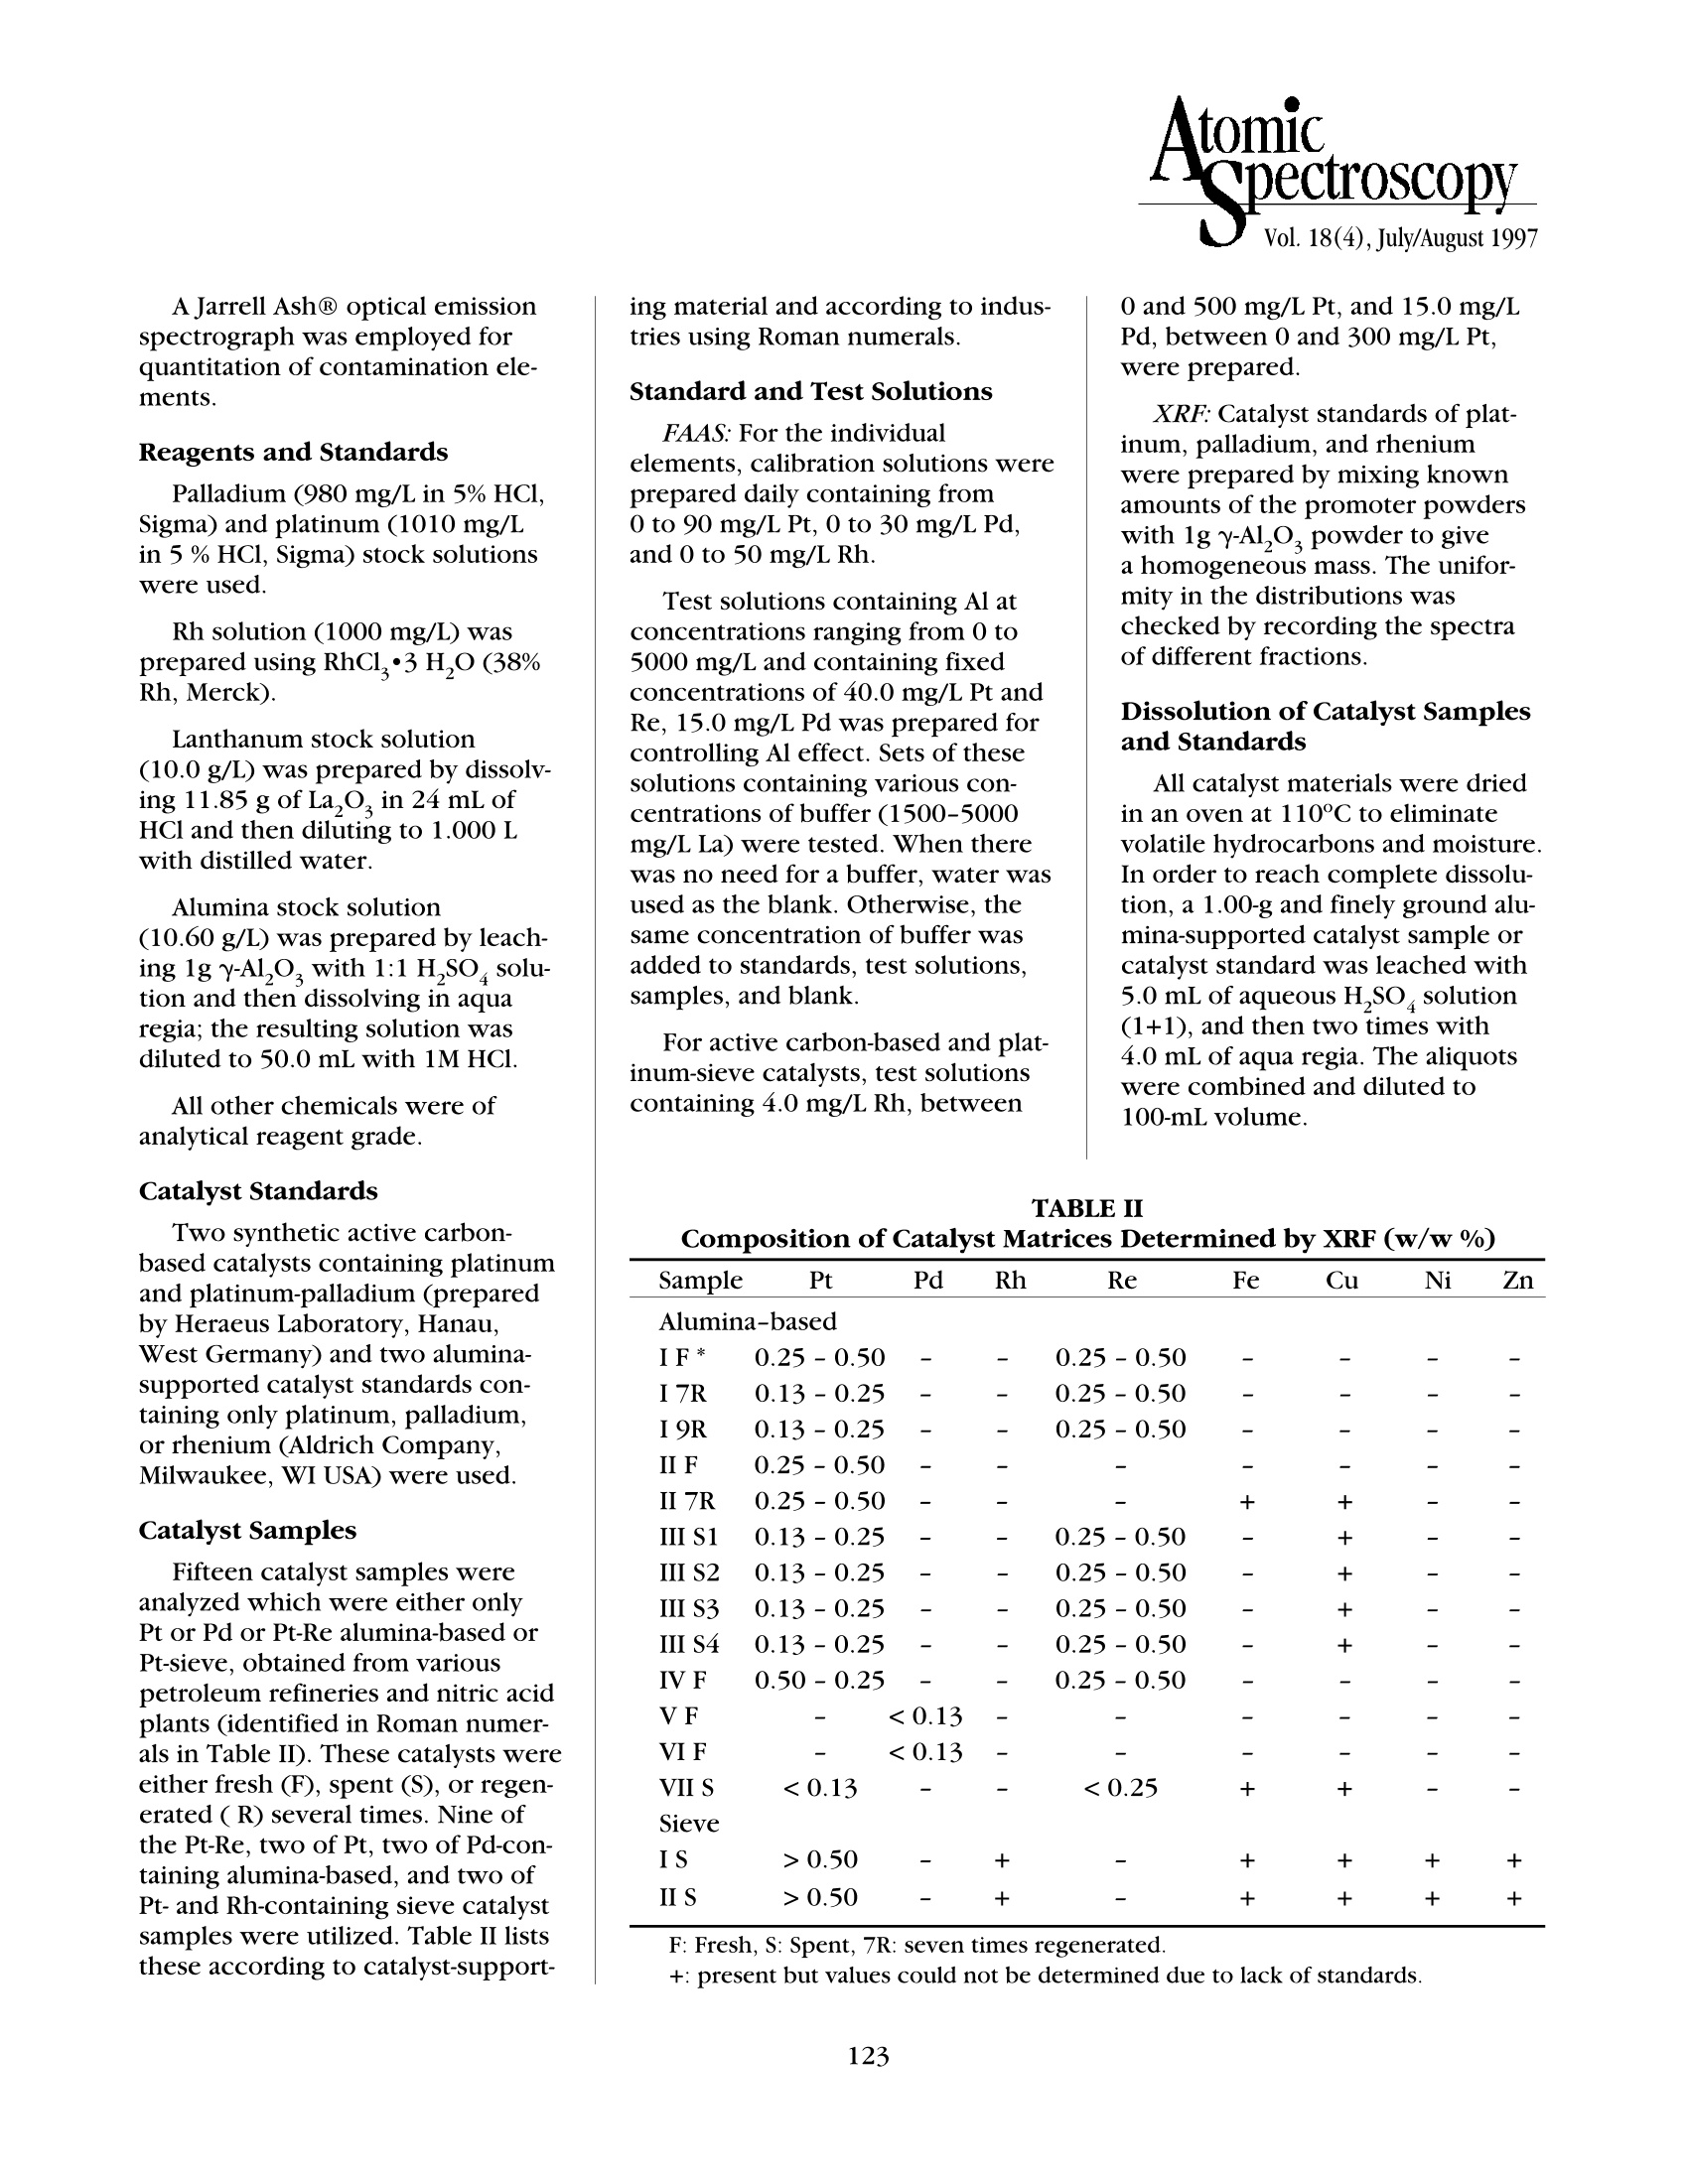
AtomicpectroscopyVol. 18(4), July/August 1997 Flame AAS Determination ofPlatinum, Palladium, and Rhodium in Catalysts M. Merdivan Department of Chemistry,Balikesir University, Balikesir, Turkey R. S. Aygun* Department of Chemistry, Middle East Technical University, Ankara, Turkey N. Kilcii Department of Chemistry, Mersin University, Mersin, Turkey Alumina-supported Pd, Pt, andbimetallic Pt-Re catalysts have beenused in a variety of industrial appli-cations. The Pt-Re/Al,O, reformingcatalysts are used for upgradinglow octane naphthas to high octanegasoline as well as for the produc-tion of important feedstocks for thepetrochemical industry. Palladiummetal is also widely used in thepetroleum industry as a hydrogena-tion catalyst. The ability to determine verylow levels of Pt, Pd, and Rh isrequired when minimum amountsof these metals are necessary toretain catalytic activity. In addition,the economical recovery of thesemetals depends on their accuratedetermination. Complete determi-nation of the noble metals can beachieved when both the metal andthe support material are dissolved,employing wet chemical methods.However, classical gravimetric pro-cedures could not easily be appliedfor the determination of low levelsof platinum group metals, especiallyin spent catalysts which are usuallyrecycled and may thus be contami-nated with various metallic impuri-ties. Different spectrophotometrictechniques have been applied tothe determination of platinum, pal-ladium, and rhodium in catalystsbut most of them require completeseparation of platinum and palla-dium from the matrix prior to theirdetermination. ( *Corresponding author. ) ABSTRACT atomic absorption spectroscopy(FAAS). In this paper, a relativelysimple FAAS method is proposedA flame atomic absorptiontshat requires no separation pro-pectrometric method isdescribed for the determinationcedure for the determination ofof platinum, palladium, andeach element in the presence ofrhodium in used and fresh alu-the others and the matrix. Aftermina-supported and sieve cata-complete dissolution of the sam-lysts. A lanthanum solution wasples, the addition of lanthanumused to eliminate chemicalsolution was employed to elimi-matrix interferences. Samplesnate matrix interferences. Thewere completely dissolved inmethod developed provides thesulfuric acid and aqua regia.means for an accurate determina-Overall, the method has resultedtiion of platinum,n % RSD valu palladium, andes ranging from1.1-5.7, 2.2-5.9, and 4.8-5.3 forrhodium in reforming catalysts.Pt, Pd, and Rh,respectively;the3o detection limits were 5 ug/LPt, 3 ug/L Pd, and 40 ug/L Rh.Various atomic spectrometrictechniques for the determinationof platinum,palladium, and rhodiumin alumina-supported catalysts havebeen reported. The interference ofalumina was eliminated either byadding lanthanum solution (4) orusing a titanium spectroscopicbuffer and controlling the burnerheight (5) or by adding aluminumsulphate as spectroscopic buffer(10). In the literature, no recent stud-ies report on the determination ofplatinum, palladium, and rhodiumin alumina-based catalysts by flame EXPERIMENTAL Instrumentation For the FAAS analysis, a Perkin-Elmer@ Model 403 atomic absorp-tion spectrometer was employed.The operating parameters for Pt,Pd,and Rh are given in Table I. For the X-ray fluorescence(XRF) analysis, the powder sam-ples were obtained by using anX-ray wavelength dispersive spec-trometer (JEOL JSDX). A tungstenX-ray tube operated at 50 kV and30 mA was used with a LiF ana-lyzer crystal by a plane of 220.The spectra were recorded witha scanning rate of 2 degrees/minute. TABLE IOperating Parameters for FAAS Analyte Light Current Wavelength Slit Width Flame source (mA) (nm) (nm) Pt HCL4 12.5 265.9 0.4 air-C,H, Pd HCL 10 247.6 0.4 air-C,H Rh HCL 5 343.5 0.2 air-C,H a Hollow Cathode Lamp. A Jarrell Ash@ optical emissionspectrograph was employed forquantitation of contamination ele-ments. Reagents and Standards Palladium (980 mg/L in 5% HCl,Sigma) and platinum (1010 mg/Lin 5 % HCl, Sigma) stock solutionswere used. Rh solution (1000 mg/L) wasprepared using RhCl,3 H,O (38%Rh,Merck). Lanthanum stock solution(10.0 g/L) was prepared by dissolv-ing 11.85 g of La,O, in 24 mL ofHCl and then diluting to 1.000 Lwith distilled water. Alumina stock solution(10.60 g/L) was prepared by leach-ing 1g y-Al,O, with 1:1 H,SO solu-tion and then dissolving in aquaregia; the resulting solution wasdiluted to 50.0 mL with 1M HC1. All other chemicals were ofanalytical reagent grade. Catalyst Standards Two synthetic active carbon-based catalysts containing platinumand platinum-palladium (preparedby Heraeus Laboratory, Hanau,West Germany) and two alumina-supported catalyst standards con-taining only platinum, palladium,or rhenium (Aldrich Company,Milwaukee, WI USA) were used. Catalyst Samples Fifteen catalyst samples wereanalyzed which were either onlyPt or Pd or Pt-Realumina-based orPt-sieve,obtained from variouspetroleum refineries and nitric acidplants (identified in Roman numer-als in Table II). These catalysts wereeither fresh (F), spent (S), or regen-erated (R) several times. Nine ofthe Pt-Re, two of Pt, two of Pd-con-taining alumina-based, and two ofPt- and Rh-containing sieve catalystsamples were utilized. Table II liststhese according to catalyst-support- ing material and according to indus-tries using Roman numerals. Standard and Test Solutions For active carbon-based and plat-inum-sieve catalysts, test solutionscontaining 4.0 mg/L Rh, between XRF: Catalyst standards of plat-FAAS: For the individualinum, palladium, and rheniumelements, calibration solutions werewere prepared by mixing knownprepared daily containing fromamounts of the promoter powders0 to 90 mg/L Pt, 0 to 30 mg/L Pd,with 1g y-Al,, powder to giveand 0 to 50 mg/L Rh.a homogeneous mass. The unifor-Test solutions containing Al atmity in the distributions wasconcentrations ranging from0 tochecked by recording the spectra5000 mg/L and containing fixedof different fractions.concentrations of 40.0 mg/L Pt andRe, 15.0 mg/L Pd was prepDissolution of Catalyst Samplesared forcaontrolling Al effect.nd Standards Sets of thesesolutions containing various con-centrations of buffer (1500-5000mg/L La) were tested. When therewas no need for a buffer, water wasused as the blank. Otherwise, thesame concentration of buffer wasadded to standards, test solutions,samples, and blank. 0 and 500 mg/L Pt, and 15.0 mg/LPd, between 0 and 300 mg/L Pt,were prepared. All catalyst materials were driedin an oven at 110°C to eliminatevolatile hydrocarbons and moisture.In order to reach complete dissolu-tion, a 1.00-g and finely ground alu-mina-supported catalyst sample orcatalyst standard was leached with5.0 mL of aqueous H,SO solution(1+1), and then two times with4.0 mL of aqua regia. The aliquotswere combined and diluted to100-mL volume. TABLE II Composition of Catalyst Matrices Determined by XRF (w/w%) Sample Pt Pd Rh Re Fe Cu Ni Zn Alumina-based IF* 0.25-0.50 0.25-0.50 I7R 0.13-0.25 0.25-0.50 I9R 0.13-0.25 - 0.25-0.50 II F 0.25-0.50 - 一 II 7R 0.25-0.50 十 - III S1 0.13-0.25 0.25-0.50 III S2 0.13-0.25 0.25-0.50 III S3 0.13-0.25 - - 0.25-0.50 + 一 III S4 0.13-0.25 0.25-0.50 + IVF 0.50-0.25 - 0.25-0.50 VF <0.13 VIF <0.13 VII S <0.13 <0.25 + Sieve IS >0.50 + 十 + + II S >0.50 + + F: Fresh, S: Spent, 7R: seven times regenerated. +: present but values could not be determined due to lack of standards. Accurately weighed 50.0-mgsieve-catalyst samples were leachedtwo or three times with 3.0-mL por-tions of aqua regia. The insolublecontaminants obtained after filtra-tion were dissolved by NaOHfusion. For this purpose, 10 mLof 30% NaOH solution was evapo-rated to near dryness in a nickelcrucible. The insoluble part of thesamples was added to the contentsof the crucible, which was thenheated in a muffle furnace at 800°Cfor one hour. The contents weredissolved in 100-mL water at70-80°C and 10-mL concentratedHCl was also added for completedissolution. The final solution wasevaporated down to 50 mL. Synthetic active carbon-basedcatalyst standards were heated ina muffle furnace at 600°C for twohours. Then, 3 mL of aqua regiawas added and the mixture heatedto near dryness. This step wasrepeated five times. The mixturewas filtered through a blue ribbonfilter paper, the residue washedthree times with 3-mL portions ofhot 1 M HCl solution, and the solu-tion diluted to 50 mL. Procedure Platinum, palladium, andrhodium were measured by flameatomic absorption spectrometryusing the sample solution directlyor with suitable amounts oflanthanum buffer solution. Eachcalibration solution and samplesolution was measured three times,water blanks were aspirated andmeasured after each reading. RESULTS AND DISCUSSION Sample Characterization In order to characterize thecatalyst matrices, XRF and OEStechniques were used. Platinumand palladium concentration in alltypes of samples was semiquantita-tively determined using XRF bycomparing the peak heights in thespectra to that of the calibration standards of platinum, palladium(0.5%, 0.25%, and 0.13%) and rhe-nium (0.5%, and 0.25%) catalysts(Table ID. Since the sole aim wasmatrix characterization, only thebase metals and some contamina-tion elements were determined inthe catalyst samples. Platinum andrhenium levels in spent catalystswere found to be lower than thefresh catalysts. Besides platinum group metals,the contamination level of the ele-ments found in spent catalysts,especially in Pt-sieve catalysts, werealso determined by OES (Table III.The contamination level was higherin spent catalysts as compared tothe regenerated catalysts. The alu-minium and silicon values werehigh because they are constituentsof the supporting materials. Interferences In the presence of large amountsof Al and Pt, the suppression of theanalyte signal for Pt, Pd, and Rh wascontrolled by adding lanthanum tothe sample and the calibration solu-tions. The interference effect of Al TABLE IIIContamination of Elements(% w/w) in Spent CatalystsDetermined by OES Al 396.2 Wavelength Sieve Alumina-based(nm) II S II7R I7R Ca4422.7 0.1 - - Co3345.4 0.02 一 0.15 0.07 Cu 3327.4 0.04 - 0.150.2 0.03 on the platinum or palladium signalin the alumina-based catalysts, Pt onthe rhodium signal in the platinum-sieve, and Pt on the palladium sig-nal in the active carbon-basedcatalyst, was determined with thetest solutions. The relative enhancement isdefined as the valueobserved,divided by the true value of the ana-lyte signal. Thus, a relative enhance-ment of 1.0 shows no enhancement,1.2 shows a 20 % enhancement,and 0.8 indicates a 20 % suppres-sion of the analyte signal. When no lanthanum buffer solu-tion was added, the analyte signaldecreased with increasing concen-tration of the matrix element.When the Al concentration reachedits maximum value of 5000 mg/L(the amount supposed to be pre-sent in catalyst samples), the rela-tive analyte signal was reduced to0.89 and 0.85 for platinum and pal-ladium, respectively (Figures 1 and2). To prevent the depression inthe analyte signal, 1500 mg/L Lafor Pt and 5000 mg/L La for Pdwere used in all alumina-based sam-ple solutions. In platinum-sieve cat-alysts, the platinum concentrationsvarying between 40-300 mg/L cre-ated an interference effect in thedetermination of rhodium. The useof 1500 mg/L La overcame the sup-pression (Figure 3). For the deter-mination of platinum,there wasno need to add a buffer solutionbecause of the relatively low con-tent of Rh compared to Pt inthe sieve catalysts. For the determination of palla-dium in active carbon-supportedcatalyst standards, the analyte signalbecame independent of the matrixcontaining large amounts of plat-inum when 1500 mg/L of La wasused(Figure 4). Evaluation Using the established optimumconditions, the calibration curvesof Pt, Pd, and Rh in the presence Fig. 1. Effect of Al on the determination ofPt (50.0 mg/L).1=2500 mg/L La; 2=1500 mg/L La; 3=no buffer. Fig. 2. Effect of Al on the determination ofPd (15.0mg/L).1=5000 mg/L La; 2=2500 mg/L La; 3=no buffer. Fig.3. Effect of Pt on the determination of Rb (4.0mg/L).1=2500 mg/L La; 2=1500 mg/L La;3=no buffer. Fig. 4. Effect of Pt on the determination of Pd (15.0mg/L).1=2500 mg/L La; 2=1500 mg/L La; 3=no buffer. and absence of a buffer were stud-ied. The range of correlation coeffi-cients for the curves of Pt, Pd andRh were 0.993-0.997, 0.997-0.998,and 0.993-0.997,respectively(n=7). The precision of the measure-ment for each metal was evaluatedby 10 replicate measurements ofthe sample solution prepared byrandomly mixing 10 different sam-ple solutions in which all of the ana-lyte metal concentrations were inthe linear range of the calibrationcurves. The precision data calcu-lated as % RSD and the detectionlimits (DL) for Pt, Pd, and Rh aregiven in Table IV. The detectionlimit of each metal was calculated by taking 10 replicate measure-ments of the blank and findingthe corresponding 3 o values forconcentration. TABLE IV Precision and Detection Limitsof Pt, Pd, andRh for theSample Pool Solution Element %RSD DL (3 o) (n=10) (ug/L) Pt 1.4 5 Pd 1.6 3 Rh 1.9 40 The percent concentration ofpalladium, platinum, and rhodiumin all catalyst samples are reportedin Table V. The precision of theFAAS method for the analysis ofcatalysts calculated as %RSD rangedfrom 1.1-5.7% for Pt, 2.2-5.9% forPd, and 4.8-5.3% for Rh. These fig-ures reflect the overall precisionof the method employed. Theaccuracy of the method given inTable VI was tested with catalyststandards having two different sup-porting materials. Comparison ofthe precision of the experimentalvalues with the standard values ofthe reference materials was per-formed by applying the t-test at the95% confidence level. The resultsshowed no significant difference. TABLE VPt, Pd,and Rh Concentrations in CatalystsDetermined by FAAS Pt Pd Rh Alumina-based IF 0.318±0.005 I7R 0.26±0.01 I9R 0.248±0.005 IIF 0.346±0.006 II 7R 0.22±0.01 III S1 0.203±0.006 III S2 0.196±0.006 III S3 0.207±0.006 II S4 0.214±0.003 IF 0.393±0.006 VF - 0.093±0.002 VIF - 0.034±0.002 VII S 0.105±0.006 Sieve IS 19.4±0.2 0.019±0.001 II S 4.65±0.05 0.063±0.003 TABLE VIResults for the Standard Samples Pt (%,w/w) Pd (%, w/w) Reported FExp. Reported Exp. Alumina-based 0.5 0.54±0.01 1 0.96±0.04 Active carbon ACI 32.73 32.6±0.2 ACII 58.16557.7±0.5 3.39 3.38±0.03 Active carbon-(AC) based standards were prepared by HeraeusLaboratory PExperimental results are given as mean ± standard deviation, n=3.Alumina-based standards were purchased from Aldrich Company CONCLUSION Contrary to earlier reports (1-4), the FAASmethod described is relatively simple and requiresno preseparation procedure. The addition of lan-thanum makes the determination of Pt, Pd, andRh nearly independent of matrix interferences.The precision of the method at the given % levelsof Pt, Pd, and Rh in catalyst samples are compara-ble to the limited data available (1-4). Lowerdetection limits were obtained for Pd (3 mg/L)than reported in previous studies (45 and 20mg/L)(7,9). The method is applicable to different typesof catalysts such as alumina-based, active carbon-based or sieve, which may be either spent orregenerated. ACKNOWLEDGMENT We acknowledge helpful discussions withProfessor Dr. O.Y. Ataman (METU) and financialsupport from the Middle East Technical Univer-sity through Research Fund Projects, AFP 93-01-03-03 and 94-01-03-07, and from the TurkishScientific and Technical Research Council,TUBITAK through TBAG-DPT/12. Received January 15, 1997. REFERENCES 1. I. B. Sierra,J. A. Perez-Bostamante and F. Burriel-Monti, Anal. Cbim. Acta 59, 249 (1972). 2. S. Kallmann, Talanta 23, 59 (1976). 3. A.N. Grinberg, N.P. Kirichenko, I.G. Kostenko,and L.V. Mikkailova, Zavodskaya Lab.50(1),10 (1983). ( 4. N.M. Potter, Anal. Cbem. 48 (3),531(1976). ) 5. E. Motonori, Bunseki Kagaku 37 (1),T11(1988). 6. W.R. Bramstedt and D.E. Harrington, Talanta 24,665 (1977). 7. E.H. Igoshina, B.M. Talalaev, and S.B. Sorokina,Zb. Anal. Kbim. 40(6), 1130(1985). 8. I.A. Ryzhak, Z.I. Sukkareva, A.P. Zolotareva, andB.M. Talalaev, Zauodskaya Lab. 48 (8), 35(1982). 9.B.M. Talalaev, E..V. Igoshina, D.B. Kazarnovskaya,and R.M. Atamanovskaya, Zb. Anal. Kbim.37 (5)868(1982). 10. B. Rozanska and Z. Skorko-Trybula,Chem. Anal.(Warsaw) 25(2),295(1980).
关闭-
1/5
-
2/5
还剩3页未读,是否继续阅读?
继续免费阅读全文产品配置单
珀金埃尔默企业管理(上海)有限公司为您提供《催化剂中贵金属的AAS分析》,该方案主要用于其他中null检测,参考标准《暂无》,《催化剂中贵金属的AAS分析》用到的仪器有null。
我要纠错
相关方案
 咨询
咨询