方案详情文
智能文字提取功能测试中
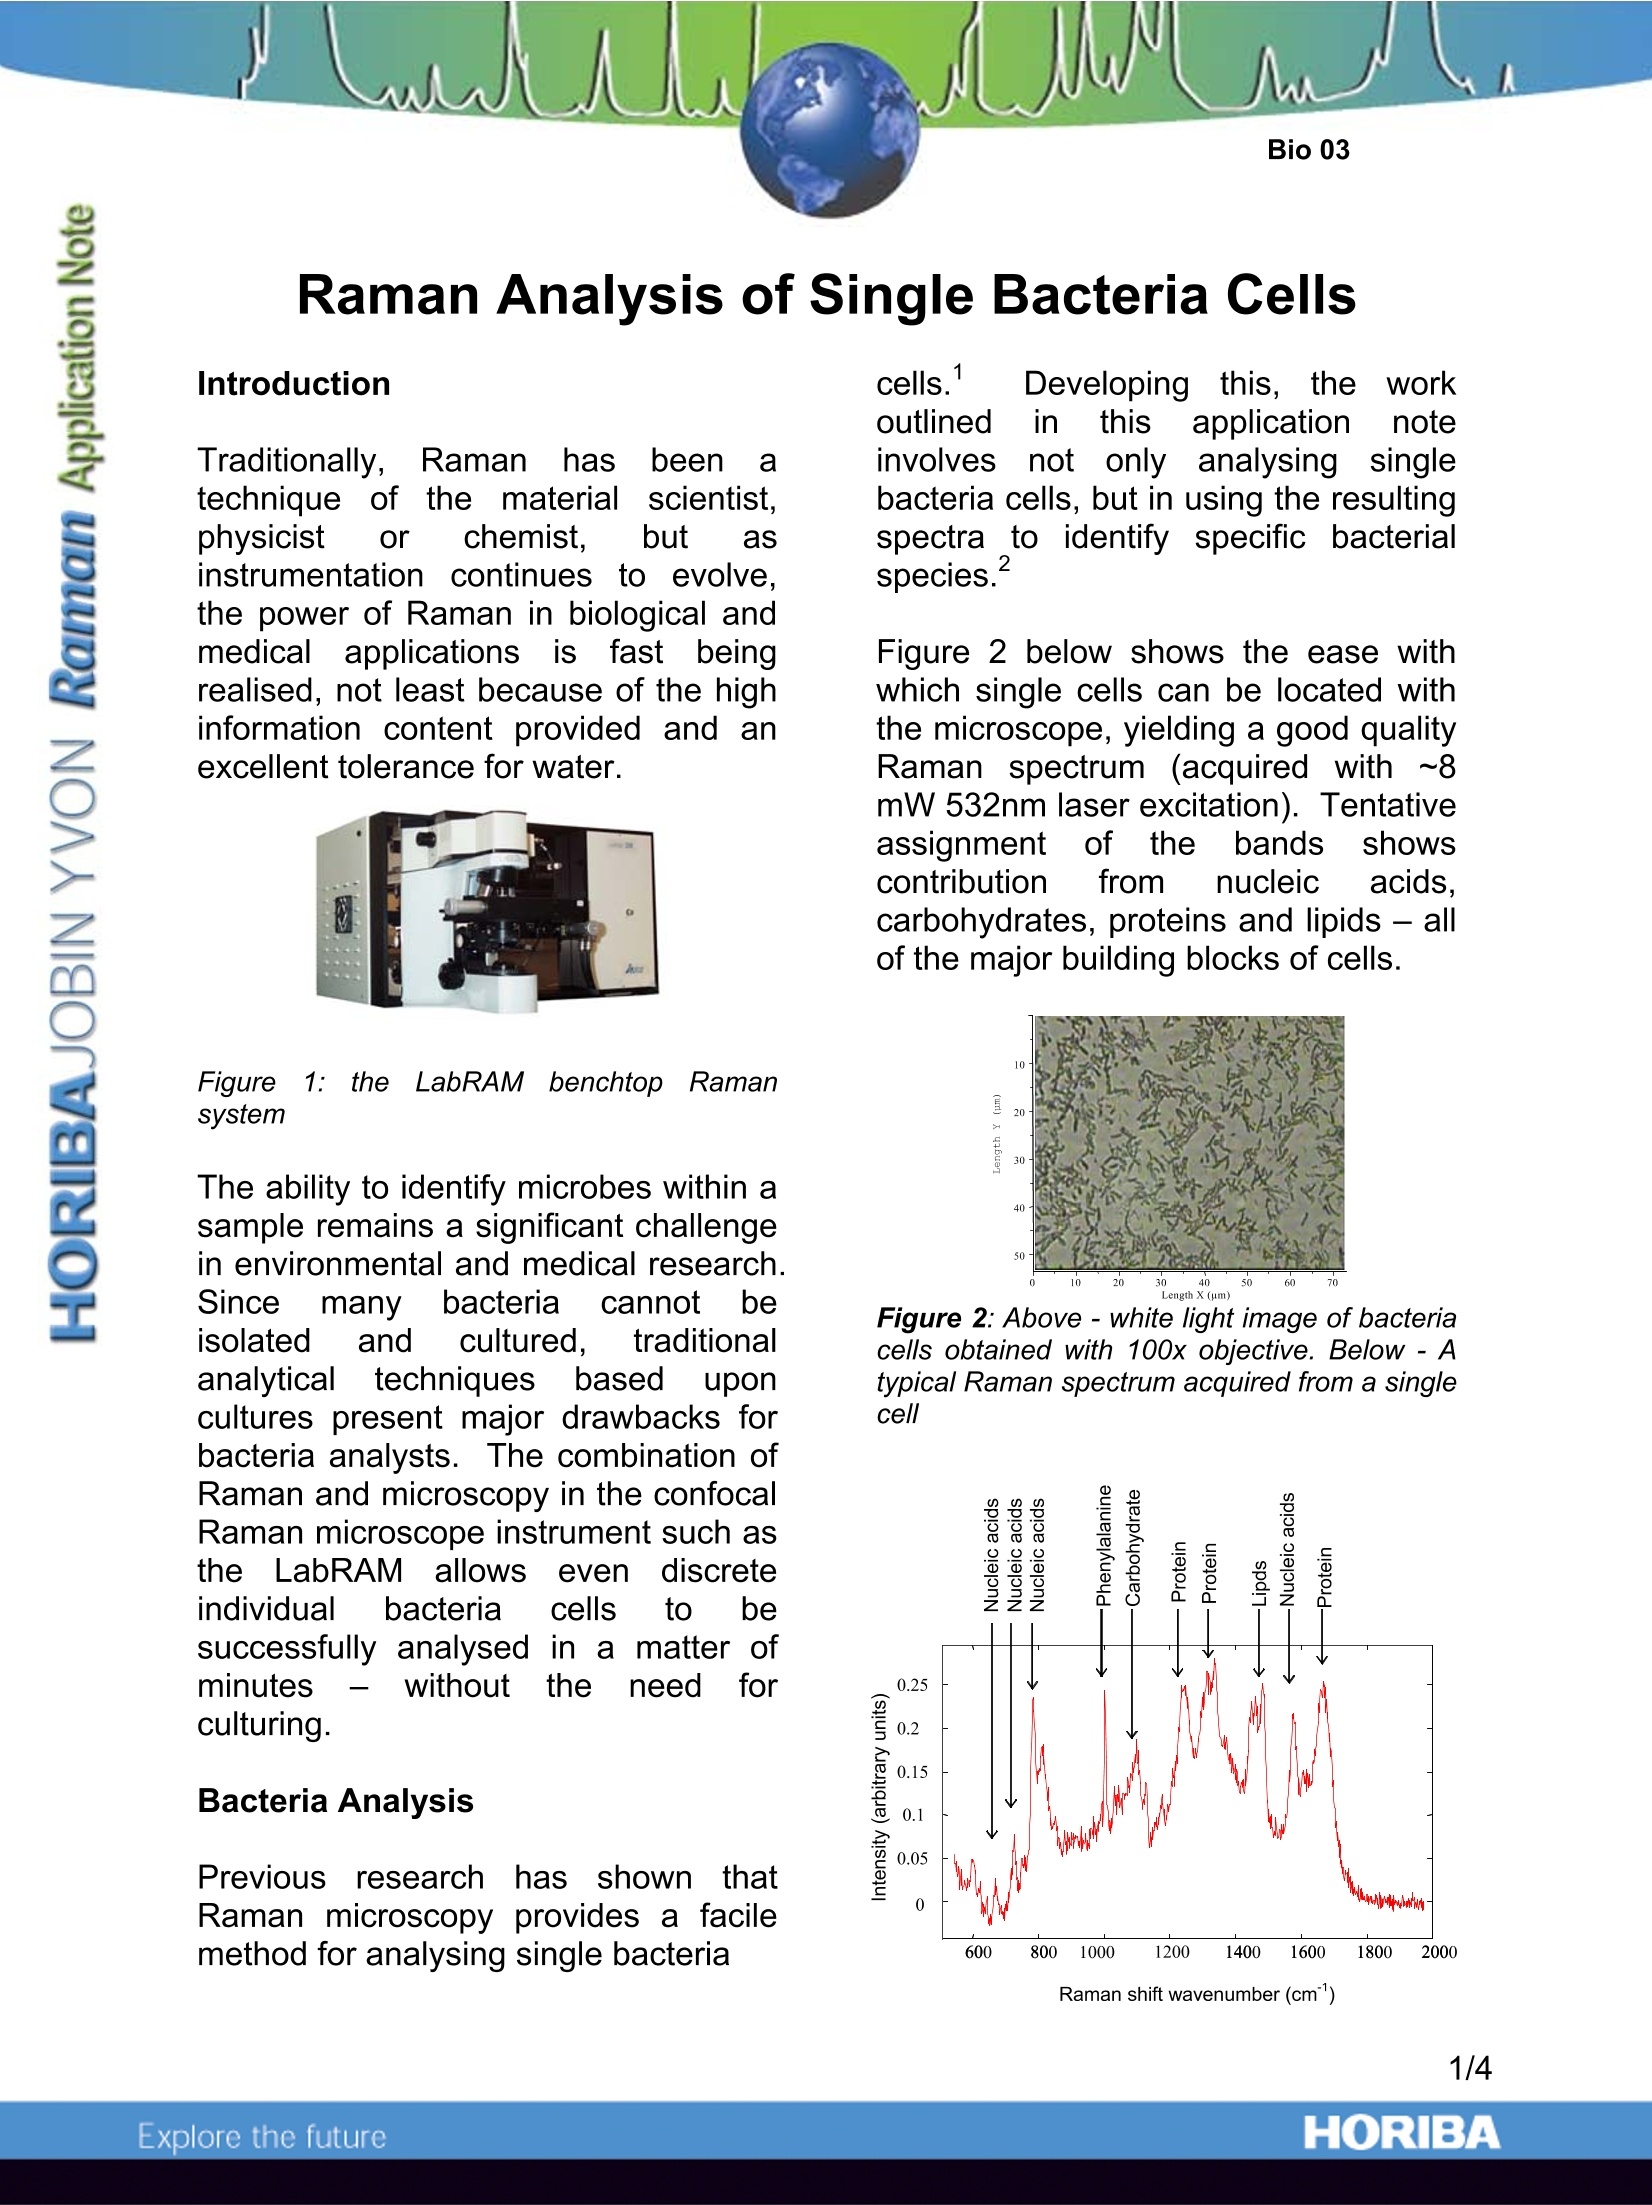
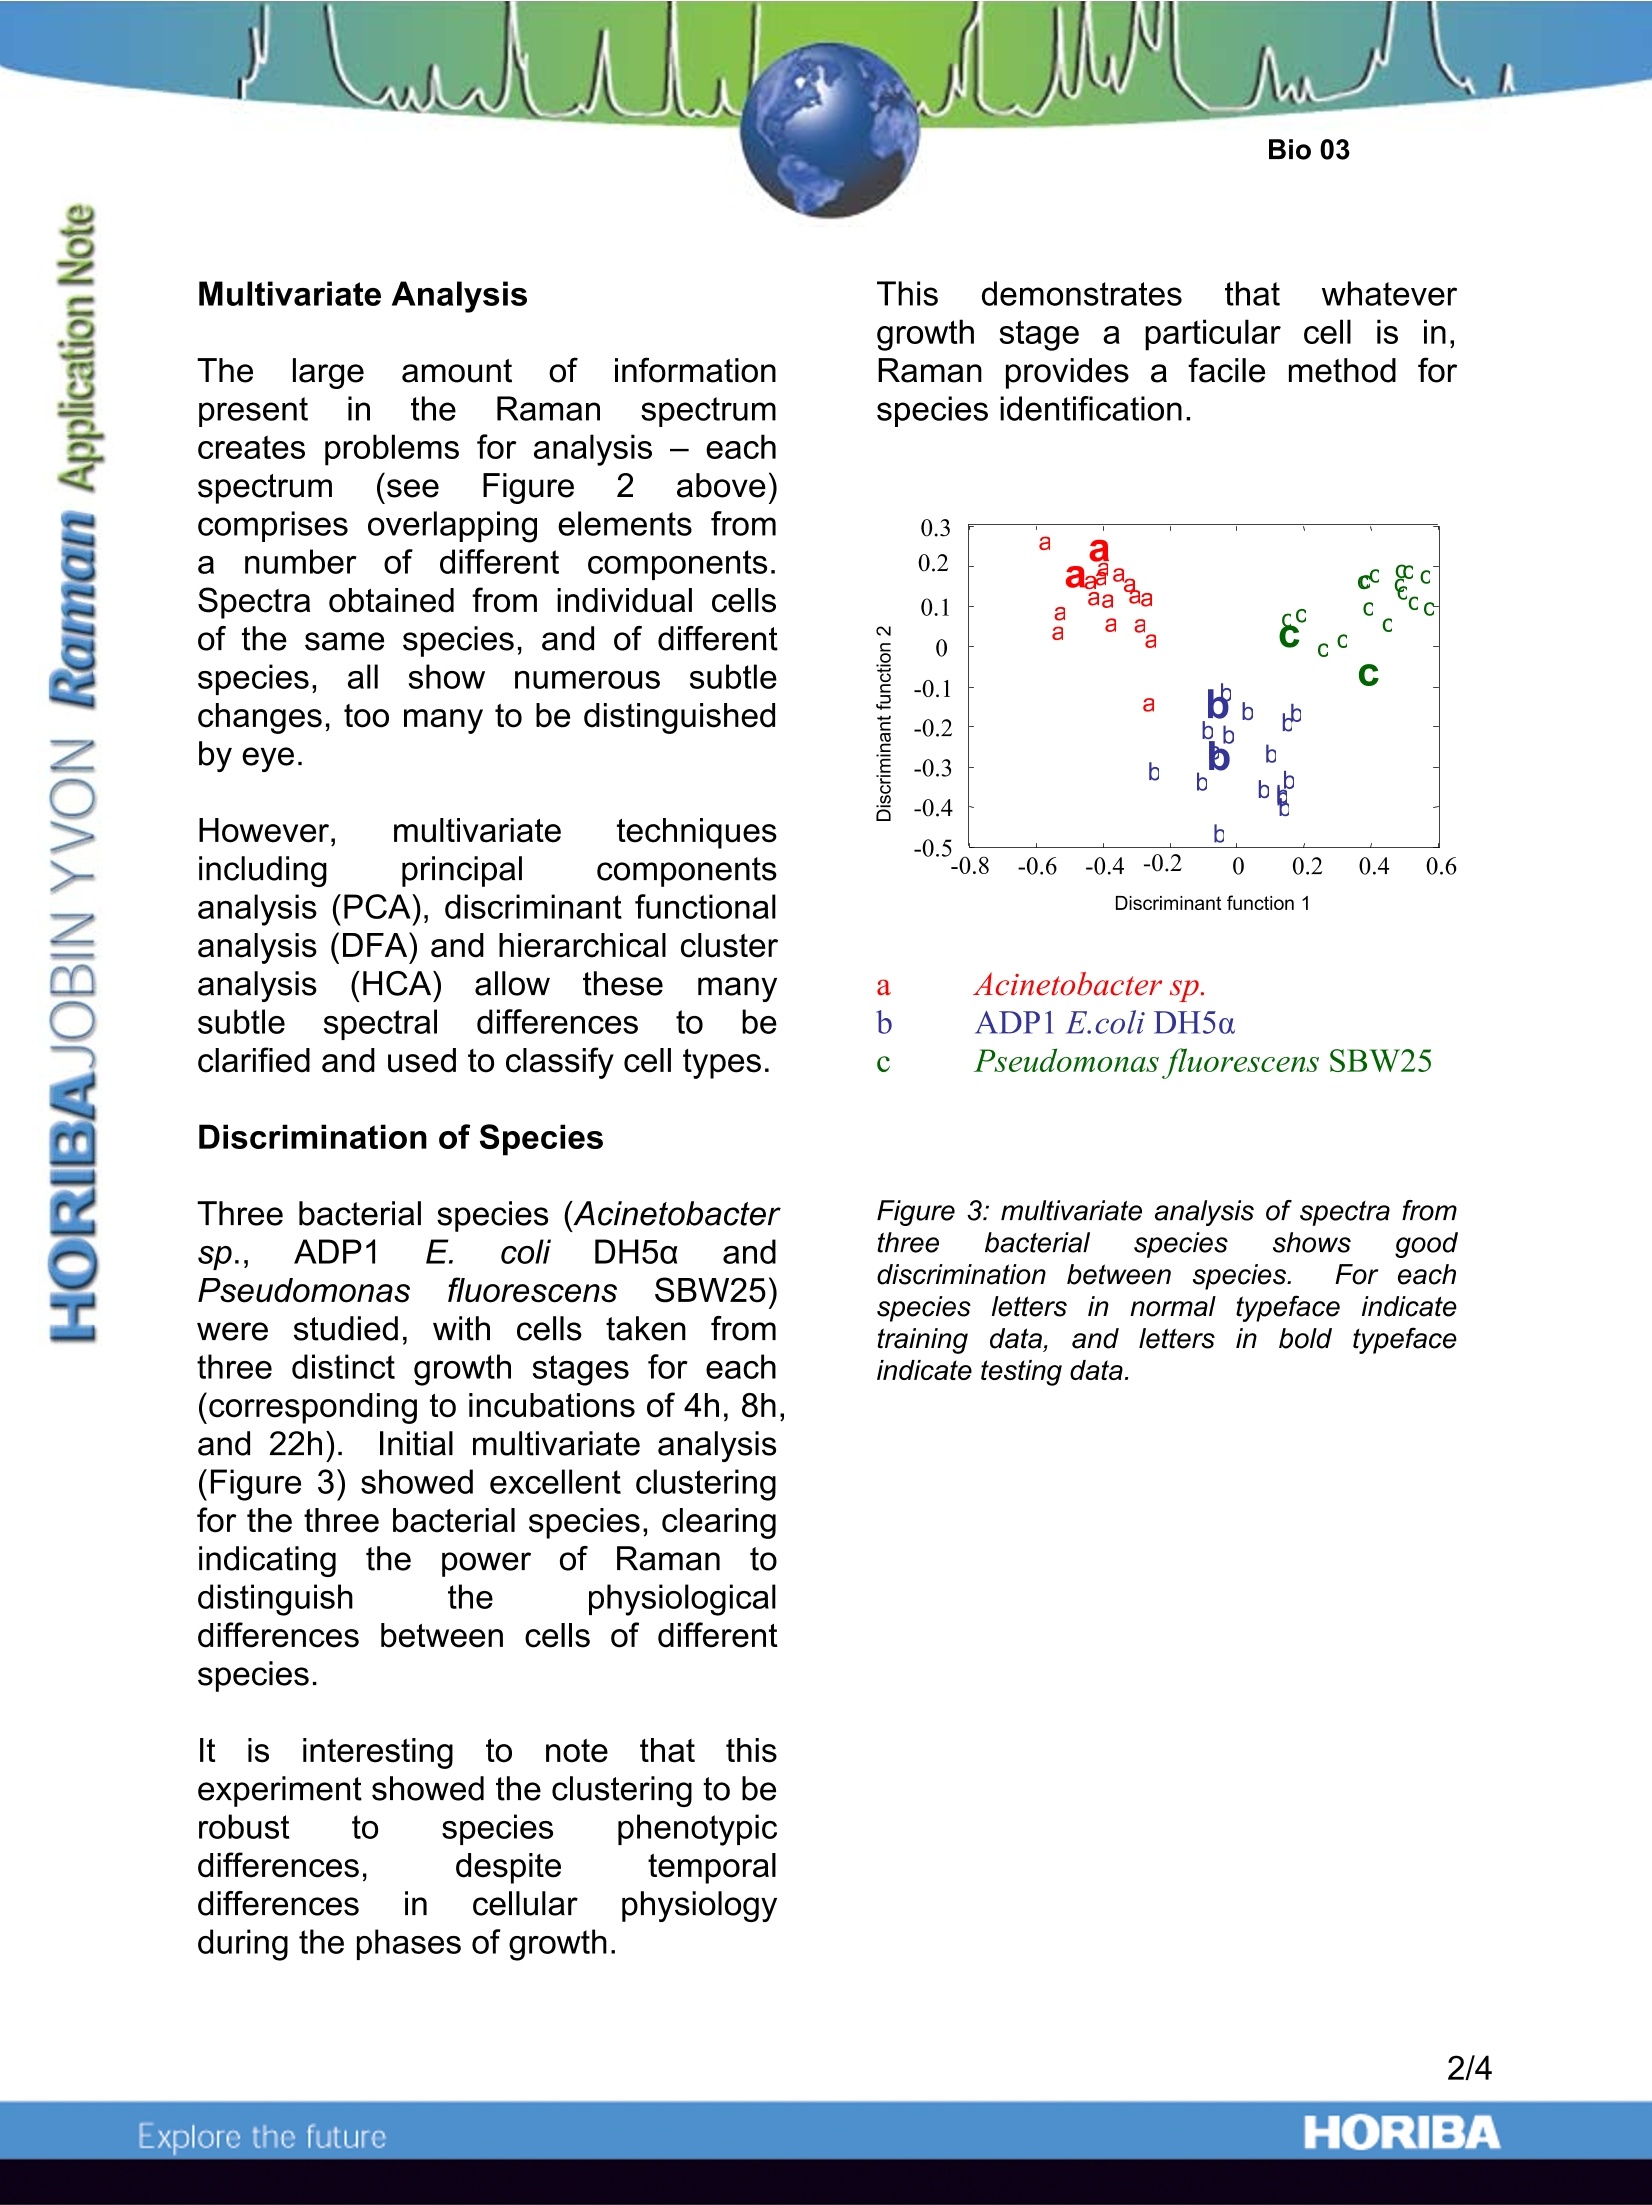
Raman Analysis of Single Bacteria Cells Introduction Traditionally,Ramanhasbeen atechnique of the materialscientist.physicist or chemist. but asinstrumentation continues to evolve,the power of Raman in biological andmedical applicationss iIsfastbeingrealised, not least because of the highinformation content provided and anexcellent tolerance for water. Figurei1: the LLabRAM benchtopp fRamansystem The ability to identify microbes within asample remains a significant challengein environmental and medical research.Sincemany bacteriacannot beisolated and cultured. traditionaanalyticaltechniquesbased uuponcultures present major drawbacks forbacteria analysts.The combination ofRaman and microscopy in the confocalRaman microscope instrument such asthe LabRAM allowsevendiscreteindividual bacteria cells to besuccessfully analysed in a matter ofminutes without theeneed fforculturing. Bacteria Analysis Previous researchh has shown thatRaman microscopy provides a facilemethod for analysing single bacteria cells. Developing this, ttheworkoutlined in thisapplicationnoteinvolves not only analysing singlebacteria cells, but in using the resultingspectra to identify specific bacterialspecies. Figure 2 below shows the ease withwhich single cells can be located withthe microscope, yielding a good qualityRaman spectrum (acquired with ·l~8mW 532nm laser excitation). Tentativeassignment of the bands showscontribution trom nucleic acids,carbohydrates, proteins and lipids - allof the major building blocks of cells. Figure 2:Above-white light image of bacteriacells obtained with 100x objective. Below - Atypical Raman spectrum acquired from a singlecell Raman shift wavenumber (cm) Multivariate Analysis ThelargeamountCofinformationpresentintthe Raman1Sspectrumcreates problems for analysis - eachspectrum (seeFigure2! above)comprises overlapping elements fromarnumber of different components.Spectra obtained from individual cellsof the same species, and of differentspecies,allshow numerous subtlechanges, too many to be distinguishedby eye. However. multivariate techniquesincluding principal componentsanalysis (PCA), discriminant functionalanalysis (DFA) and hierarchical clusteranalysis(HCA)allow these manysubtlespectral differencesto beclarified and used to classify cell types. Discrimination of Species Three bacterial species (Acinetobactersp.,ADP1 :. c(oliDH5a andPE.seudomonasfluorescens; SBW25)were studied,with cells taken fromthree distinct growth stages for each(corresponding to incubations of 4h, 8h,and 22h). Initial multivariate analysis(Figure 3) showed excellent clusteringfor the three bacterial species, clearingindicating the power of Raman todistinguish the physiologicaldifferences between cells of differentspecies. tis; interesting to note thatthisexperiment showed the clustering to berobust to species phenotypicdifferences. despite temporaldifferences in cellular physiologyduring the phases of growth. This demonstratesthat whatevergrowth stage a particular cell is in,Raman provides a facile method forspecies identification. a Acinetobacter sp. b ADP1 E.coli DH5a c Pseudomonas fluorescens SBW25 Figure 3: multivariate analysis of spectra fromthree bacterial species showsis gooddiscrimination between species. For eachspecies letters in normal typeface indicatetraining data, and letters inbold typefaceindicate testing data. Figure 4: PCA analysis of exponential (8h) and stationary phases (22h) of Acinetobacter sp. ADP1(A), E.coli DH5a (B) and Pseudomonas fluorescens SBW25 (C). Discrimination of Growth Phases Separate PCA analysis of spectra fromone species highlighted changes in therelative(concentrations(ofcellulaicomponents in the different growtrphases (4h, 8h and 22h incubations).As illustrated in Figure 4, for all threestrains there was some degree ofseparation between tthe exponential(8h)andstationar(y22h)growthphases. Analysis into the cause of thedifferentiation revealed that the ratio ofRNA to protein, lipid and carbohydratewas higher in the exponential phasethan in the stationary phase. Raman shift caused by 1c addition Ramanspectra of P.,FluorescensSBW25 grown in 100% 1C6 glucoserevealed a number of peaks shifted tolowerr wavenumber comparedwithsamples grown in 100% 2C (Figure5).PCA analysis revealed a trend fromlow to high percentage of 13c-glucoseon the second principal componentaxis. Further analysis showed that themajor contributor;s to the observedspectral differentiation were the proteinand nucleic acid signals - more than likely to be due to the fact that thesetwo constituents represent~75% of thetotal cellular biomass. Figure 5:(A) Wavenumber shifts apparentwith increasing percentages of 13c (B) PCAanalysis of spectra of P. Fluorescens SBW25incubated with different percentages of 1Ce-glucose The true confocal operation of theLabRAMRaman microscope allowsexcellent spatial discrimination to beachieved - an important considerationwhen analysing single bacteria cells inthe order of 1-2pm in size. Mappingexperiments (Figure6demonstrate that even single bacteriacells can be clearly imaged despitetheir small size. Figure 6:FRaman mapped image of bacteriacells. Raman microscopy has been used tointerrogate single bacteria cells - withmultivariate analysis it has been shownthatdifferent sspecies and growthphases can be quickly distinguished.Cells grown with differing amounts of13C enriched nutrients showed Ramanbands shifted to lower wavenumberdue to the heavy isotope. With furthermultivariate analysis the cells can beclassified according to the percentageuptake of 13C. Acknowledgements Dr Wei Huang (Centre for Ecology andHydrology, Mansfield Road, Oxford) iskindly thanked for providing the dataused within this application note. Key References 1. K. Christian Schuster, Ingo Reese,EvaUrlaub, J. Richard Gapes, and Bernhard Lendl,Multidimensional Information on the ChemicalComposition of Single Bacterial Cellss byConfocalRamanMicrospectroscopy,,Anal.Chem., 2000, 72, 5529 2. Wei E. Huang, Robert I. Griffiths, lanP.Thompson, Mark J. Bailey, and Andrew S.Whiteley,Ramann Microscopic Analysis;ofSingle Microbial Cells, Anal. Chem., 2004, 76,4452 ( Fax : +33 (0)3 20 59 18 08. Email : raman@jobinyvon.fr www.jobinyvon.fr ) ( USA: HORIBA Jobin Yvon Inc., 3880 Park Avenue, Edison, NJ 08820-3012. Te l :+1-732-494-8660,Fax: +1-732-549-2571. Email :raman@jobinyvon.com w w w.jobinyvon.com Japan: HORIBA Ltd., J Y Optical Sales Dept., 1-7-8 Higashi-kanda, Chiyoda-ku, T o kyo 101-0031. T el: + 81 (0)3 3861 8231, Fax: +81 (0)3 3861 8259. E mail: raman@horiba.com ) ( Germany: +49(0)6251 84 75-0 I taly: +39 02 57603050 U K : +44 (0)20 8 2 04 8142 4/4 ) ORIBAExplore the future Raman microscopy has been used to interrogate single bacteria cells – with multivariate analysis it has been shown that different species and growth phases can be quickly distinguished. Cells grown with differing amounts of 13C enriched nutrients showed Raman bands shifted to lower wavenumber due to the heavy isotope. With further multivariate analysis the cells can be classified according to the percentage uptake of 13C.
关闭-
1/4
-
2/4
还剩2页未读,是否继续阅读?
继续免费阅读全文产品配置单
HORIBA(中国)为您提供《单细菌细胞中化学组成检测方案(激光拉曼光谱)》,该方案主要用于其他中化学组成检测,参考标准《暂无》,《单细菌细胞中化学组成检测方案(激光拉曼光谱)》用到的仪器有HORIBA XploRA INV多功能拉曼及成像光谱仪。
我要纠错
推荐专场


相关方案
 咨询
咨询