方案详情文
智能文字提取功能测试中
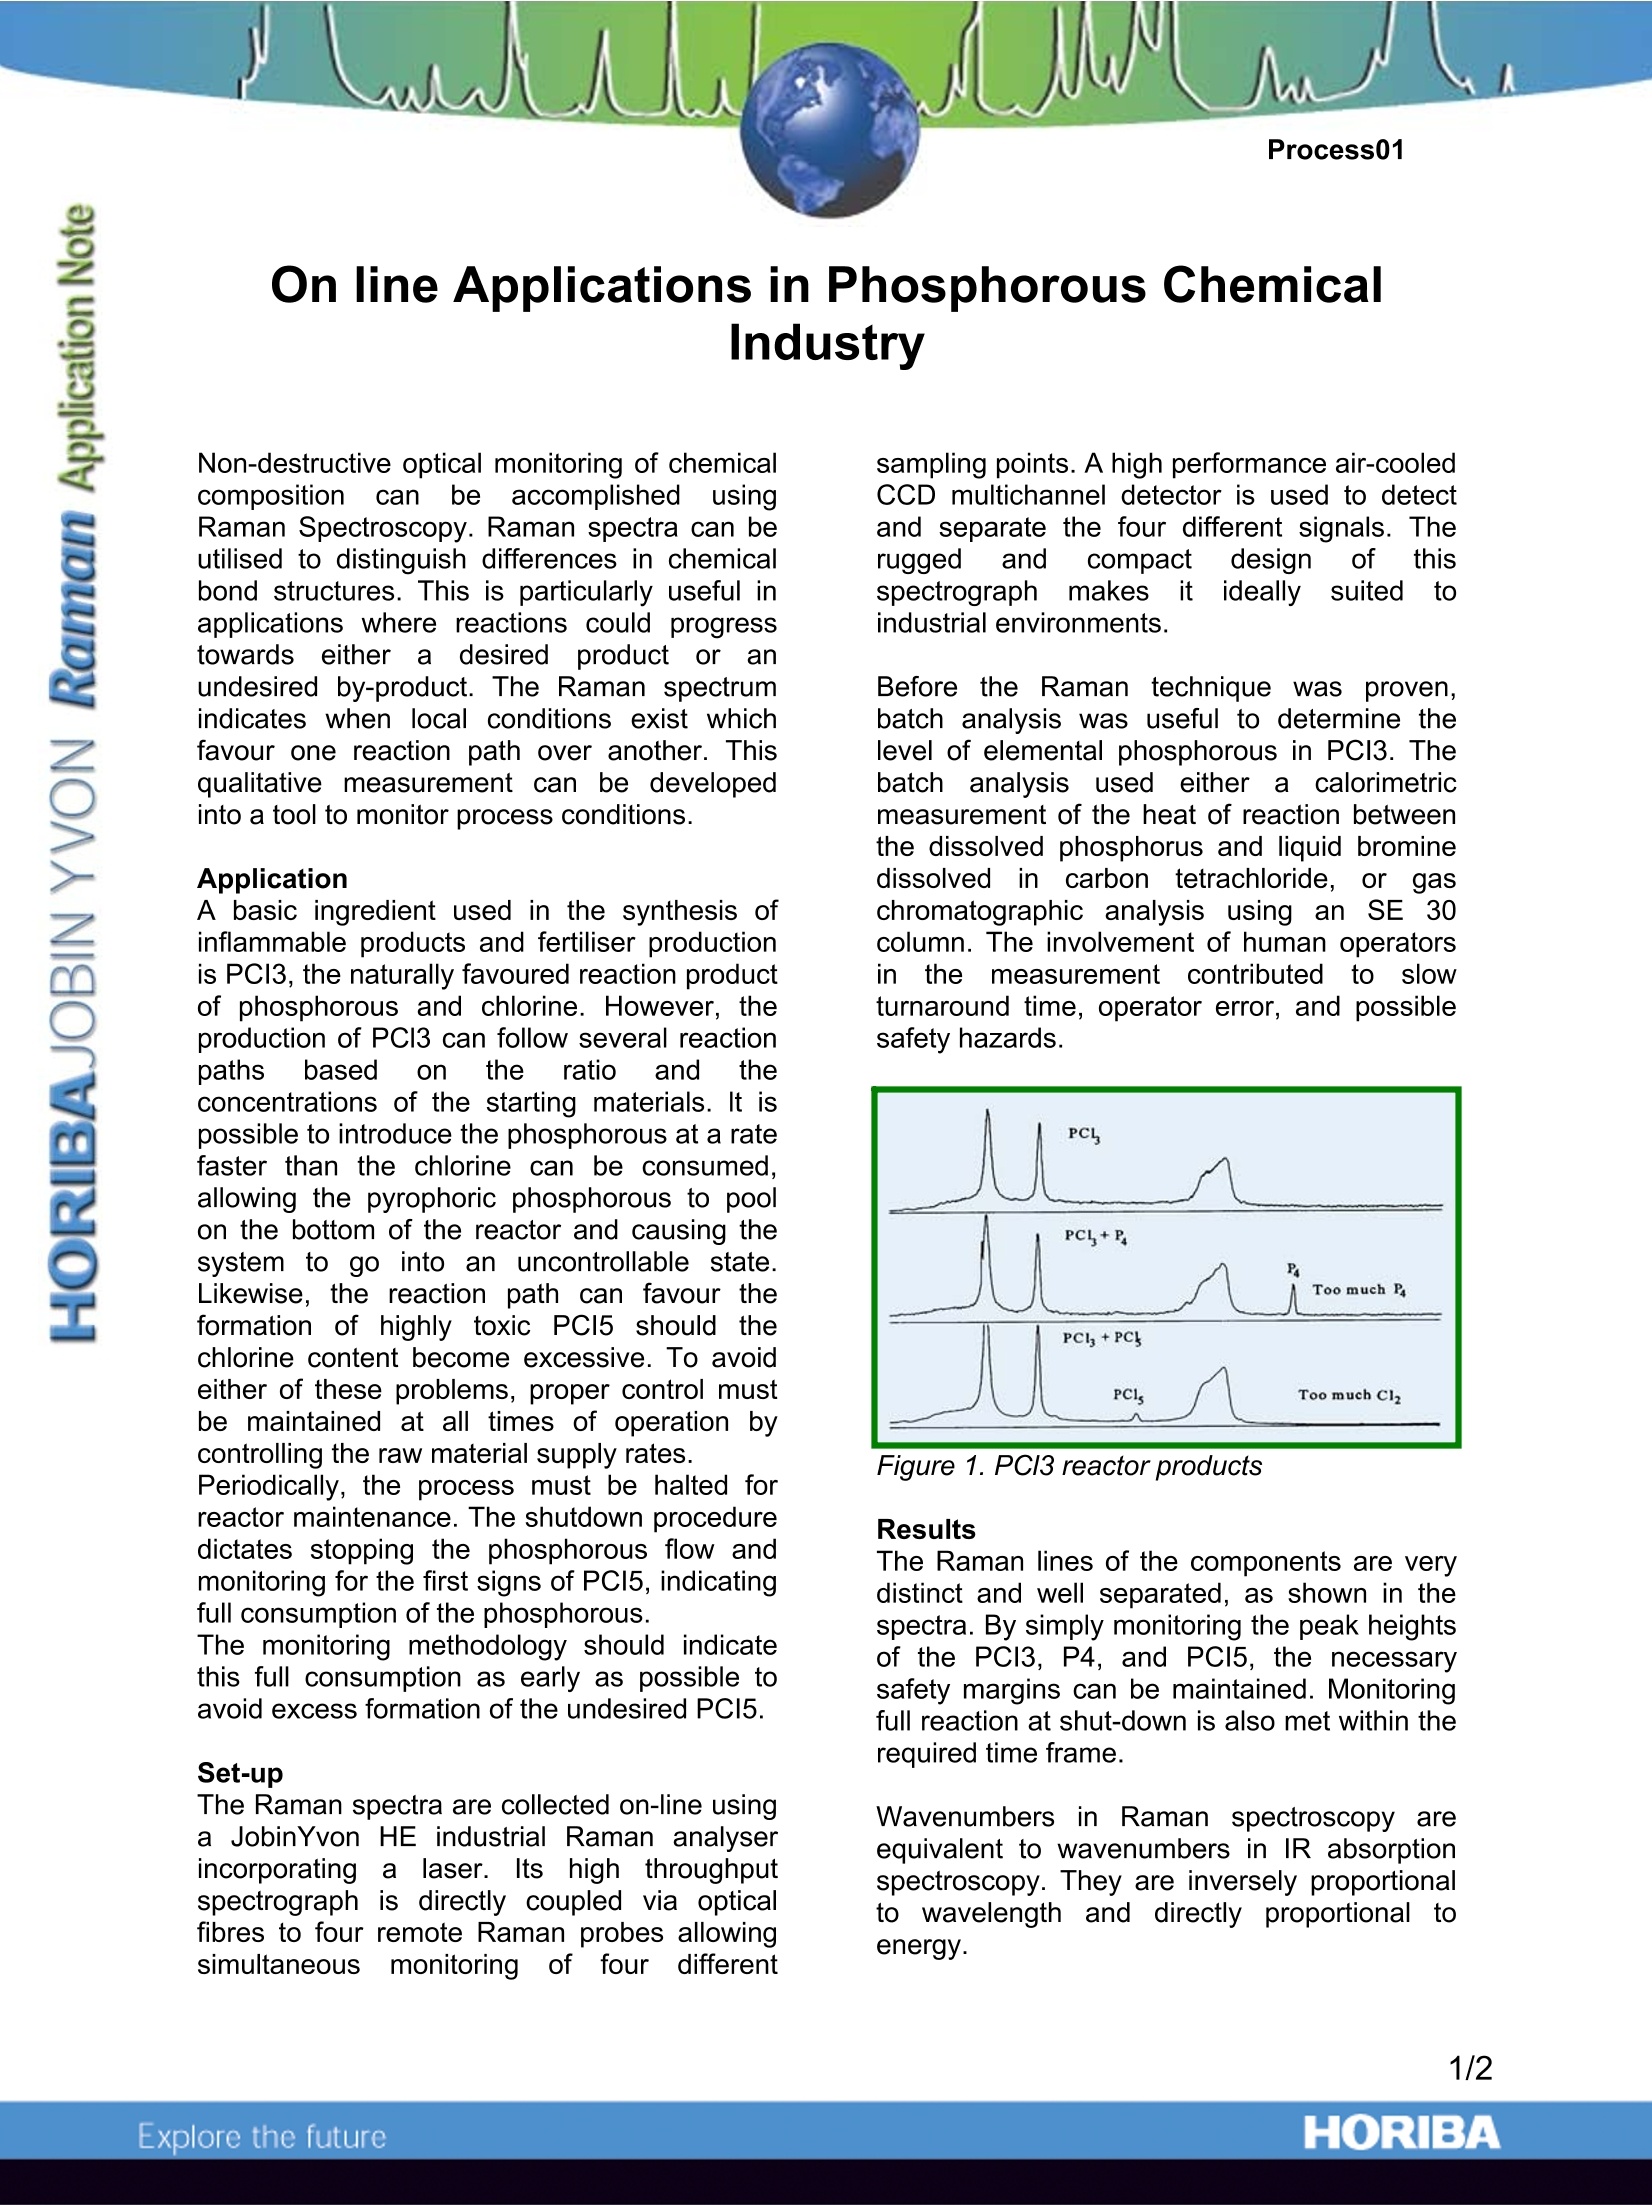
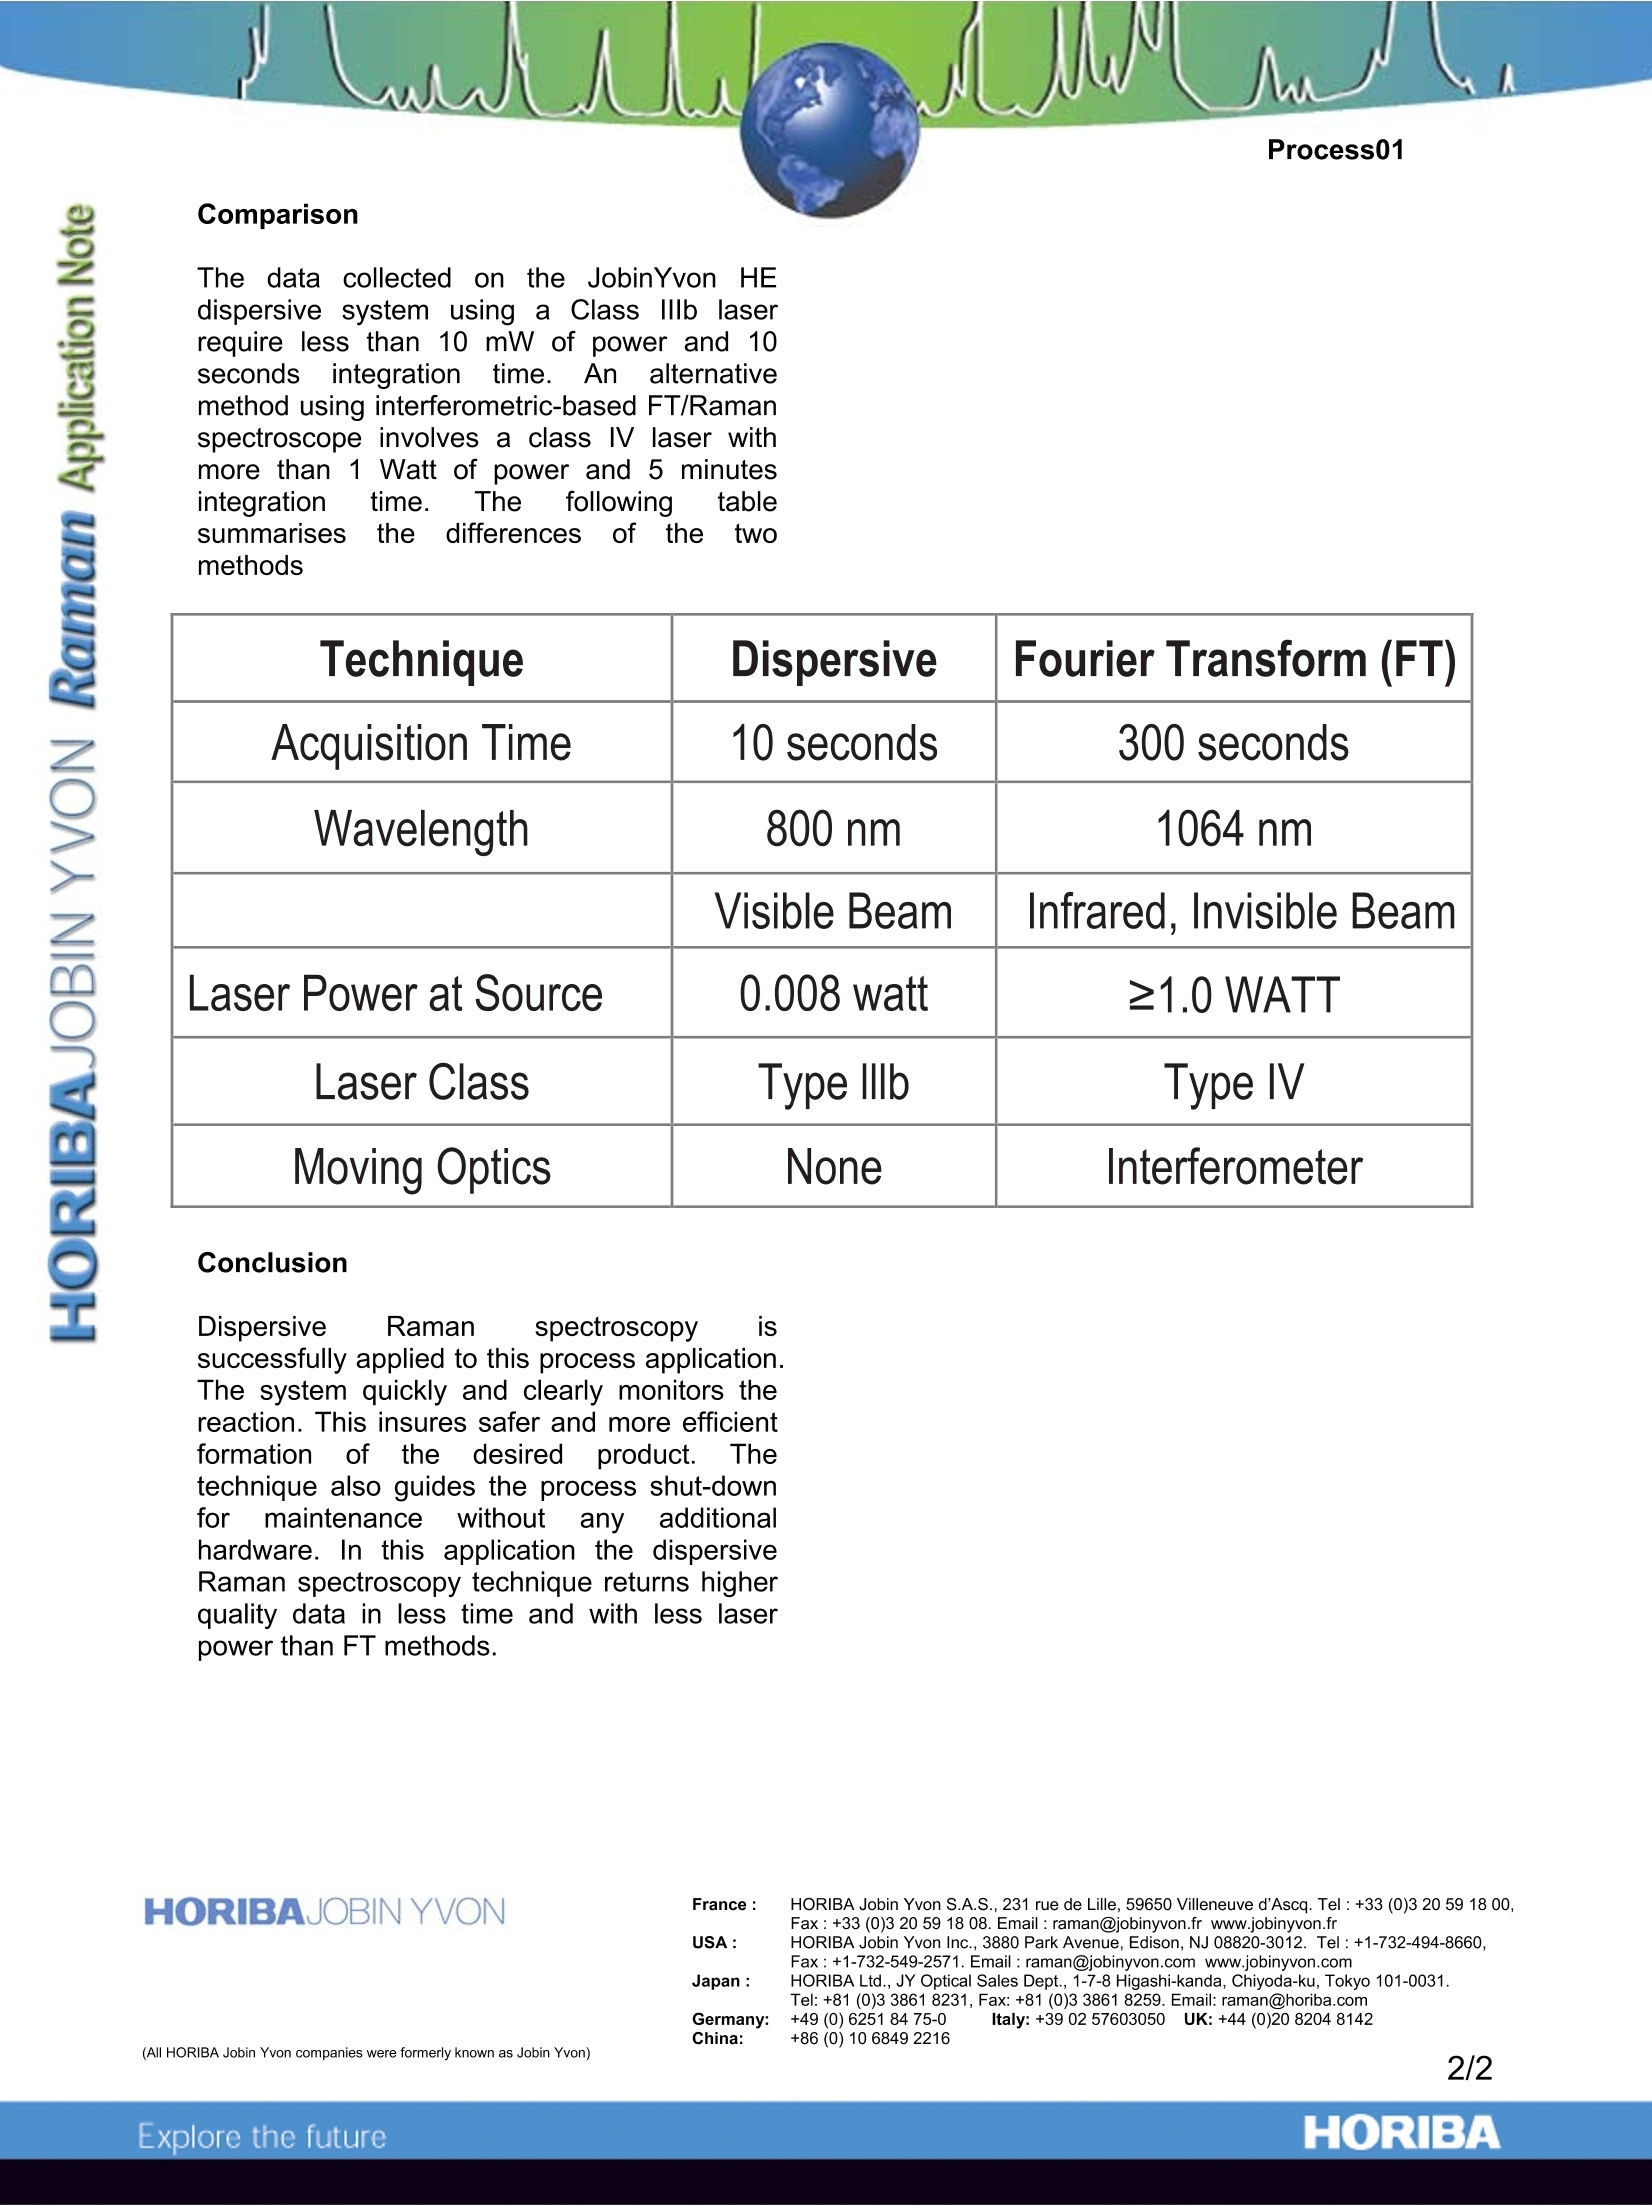
On line Applications in Phosphorous ChemicalIndustry Non-destructive optical monitoring of chemicalcomposition can tbeaccomplishediusingRaman Spectroscopy. Raman spectra can beutilised to distinguish differences in chemicalbond structures. This is particularly useful inapplications where reactions could progresstowards either a desired producttor anundesired by-product. The Raman spectrumindicates when local conditions exist whichfavour one reaction path over another. Thisqualitative measurement can be developedinto a tool to monitor process conditions. Application A basic ingredient used in the synthesis ofinflammable products and fertiliser productionis PCI3, the naturally favoured reaction productof phosphorous and chlorine. However, theproduction of PCI3 can follow several reactionpaths based on thee ratio and theconcentrations of the starting materials. It ispossible to introduce the phosphorous at a ratefaster than the chlorine can be consumed,allowing9 1the pyrophoric phosphorous to poolon the bottom of the reactor and causing thesystem to go into an uncontrollable state.Likewise, the reaction path can favour theformation of highly toxic PCl5 should thechlorine content become excessive. To avoideither of these problems, proper control mustbe maintained at all times of operation bycontrolling the raw material supply rates. Periodically, the process must be halted forreactor maintenance.The shutdown proceduredictates stopping the phosphorous flow andmonitoring for the first signs of pPCcI5i, indicatingfull consumption of the phosphorous. The monitoring methodology should indicatethis full consumption as early as possible toavoid excess formation of the undesired PCI5. Set-up The Raman spectra are collected on-line usinga JobinYvon HE industrial Raman analyserincorporatingalaser. Its highthroughputspectrograph is directly coupled via opticalfibres to four remote Raman probes allowingsimultaneousmonitoringa of four different sampling points. A high performance air-cooledCCD multichannel detector is used to detectand separate the four different signals. Therugged and compact design of(tthisspectrographrmakes it ideallyysuited toindustrial environments. Before the Raman ttechnique wasproven,batch analysis was useful to determine thelevel of elemental phosphorous in PCI3. Thebatch analysisused either a calorimetricmeasurement of the heat of reaction betweenthe dissolved phosphorus and liquid brominedissolved in carbon tetrachloride, or gaschromatographic analysis using an SE 30column. The involvement of human operatorsinthemeasurement contributedtoslowturnaround time, operator error, and possiblesafety hazards. Figure 1. PC/3 reactor products Results The Raman lines of the components are verydistinct and well separated, as shown in thespectra. By simply monitoring the peak heightsof the PCI3, P4, and PCI5, the necessarysafety margins can be maintained. Monitoringfull reaction at shut-down is also met within therequired time frame. Wavenumbers in Raman spectroscopy areequivalent to wavenumbers in IR absorptionspectroscopy. They are inversely proportionaltoo wavelength and directlyy proportional1 toenergy. Comparison The data collected on the JobinYvon HEdispersive system using a Class lllb laserrequire less than 10 mW of power and 10secondsintegrationtime.. An alternativemethod using interferometric-based FT/Ramanspectroscope involves a class IV laser withmore than 1 Watt of power and 5 minutesintegration time. The following tablesummarises thedifferencesof the twomethods Technique Dispersive Fourier Transform (FT) Acquisition Time 10 seconds 300 seconds Wavelength 800 nm 1064 nm Visible Beam Infrared, Invisible Beam Laser Power at Source 0.008 watt ≥1.0 WATT Laser Class Type lllb Type l Moving Optics None nterferometer Conclusion Dispersive Raman spectroscopy issuccessfully applied to this process application.The system quickly and clearly monitors thereaction. This insures safer and more efficientformationn ofthedesiredproduct.L.Thetechnique also guides the process shut-downforrmaintenancewithoutanyyadditionalhardware. In this application the dispersiveRaman spectroscopy technique returns higherquality data in less time and with less laserpower than FT methods. HORIBAJOBIN YVON Fax : +33 (0)3 20 59 18 08. Email : raman@jobinyvon.fr www.jobinyvon.fr ( USA: HORIBA Jobin Yvon In c ., 3880 P a rk Avenue, Edison, NJ 08820-3012. Tel:+1-732-494-8660, Fax:+1-732-549-2571. Email : raman@jobinyvon.com w w w.jobinyvon.com Japan : HORIBA Ltd., JY Optical Sales Dept., 1-7-8 Higashi-kanda, Ch i yoda-ku, Tok y o 101-0031. ) Tel: +81 (0)33861 8231, Fax: +81 (0)3 3861 8259. Email: raman@horiba.com iGermany: +49 (0)62518475-0 Italy: +39 02 5760305D0 UK:+44 (0)20 82048142 ORIBAExplore the future France: HORIBA Jobin Yvon S.A.S., rue de Lille, Villeneuve d'Ascq. Tel:+China: +()All HORIBA Jobin Yvon companies were formerly known as Jobin Yvon)/HORIBAExplore the future Dispersive Raman spectroscopy is successfully applied to this process application. The system quickly and clearly monitors the reaction. This insures safer and more efficient formation of the desired product. The technique also guides the process shut-down for maintenance without any additional hardware. In this application the dispersive Raman spectroscopy technique returns higher quality data in less time and with less laser power than FT methods.
关闭-
1/2
-
2/2
产品配置单
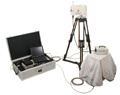
HORIBA(中国)为您提供《PCI3, PCI5中反应监控检测方案(激光拉曼光谱)》,该方案主要用于无机酸中反应监控检测,参考标准《暂无》,《PCI3, PCI5中反应监控检测方案(激光拉曼光谱)》用到的仪器有HORIBA HE科研级便携拉曼光谱仪。
我要纠错
推荐专场


相关方案
 咨询
咨询