方案详情文
智能文字提取功能测试中
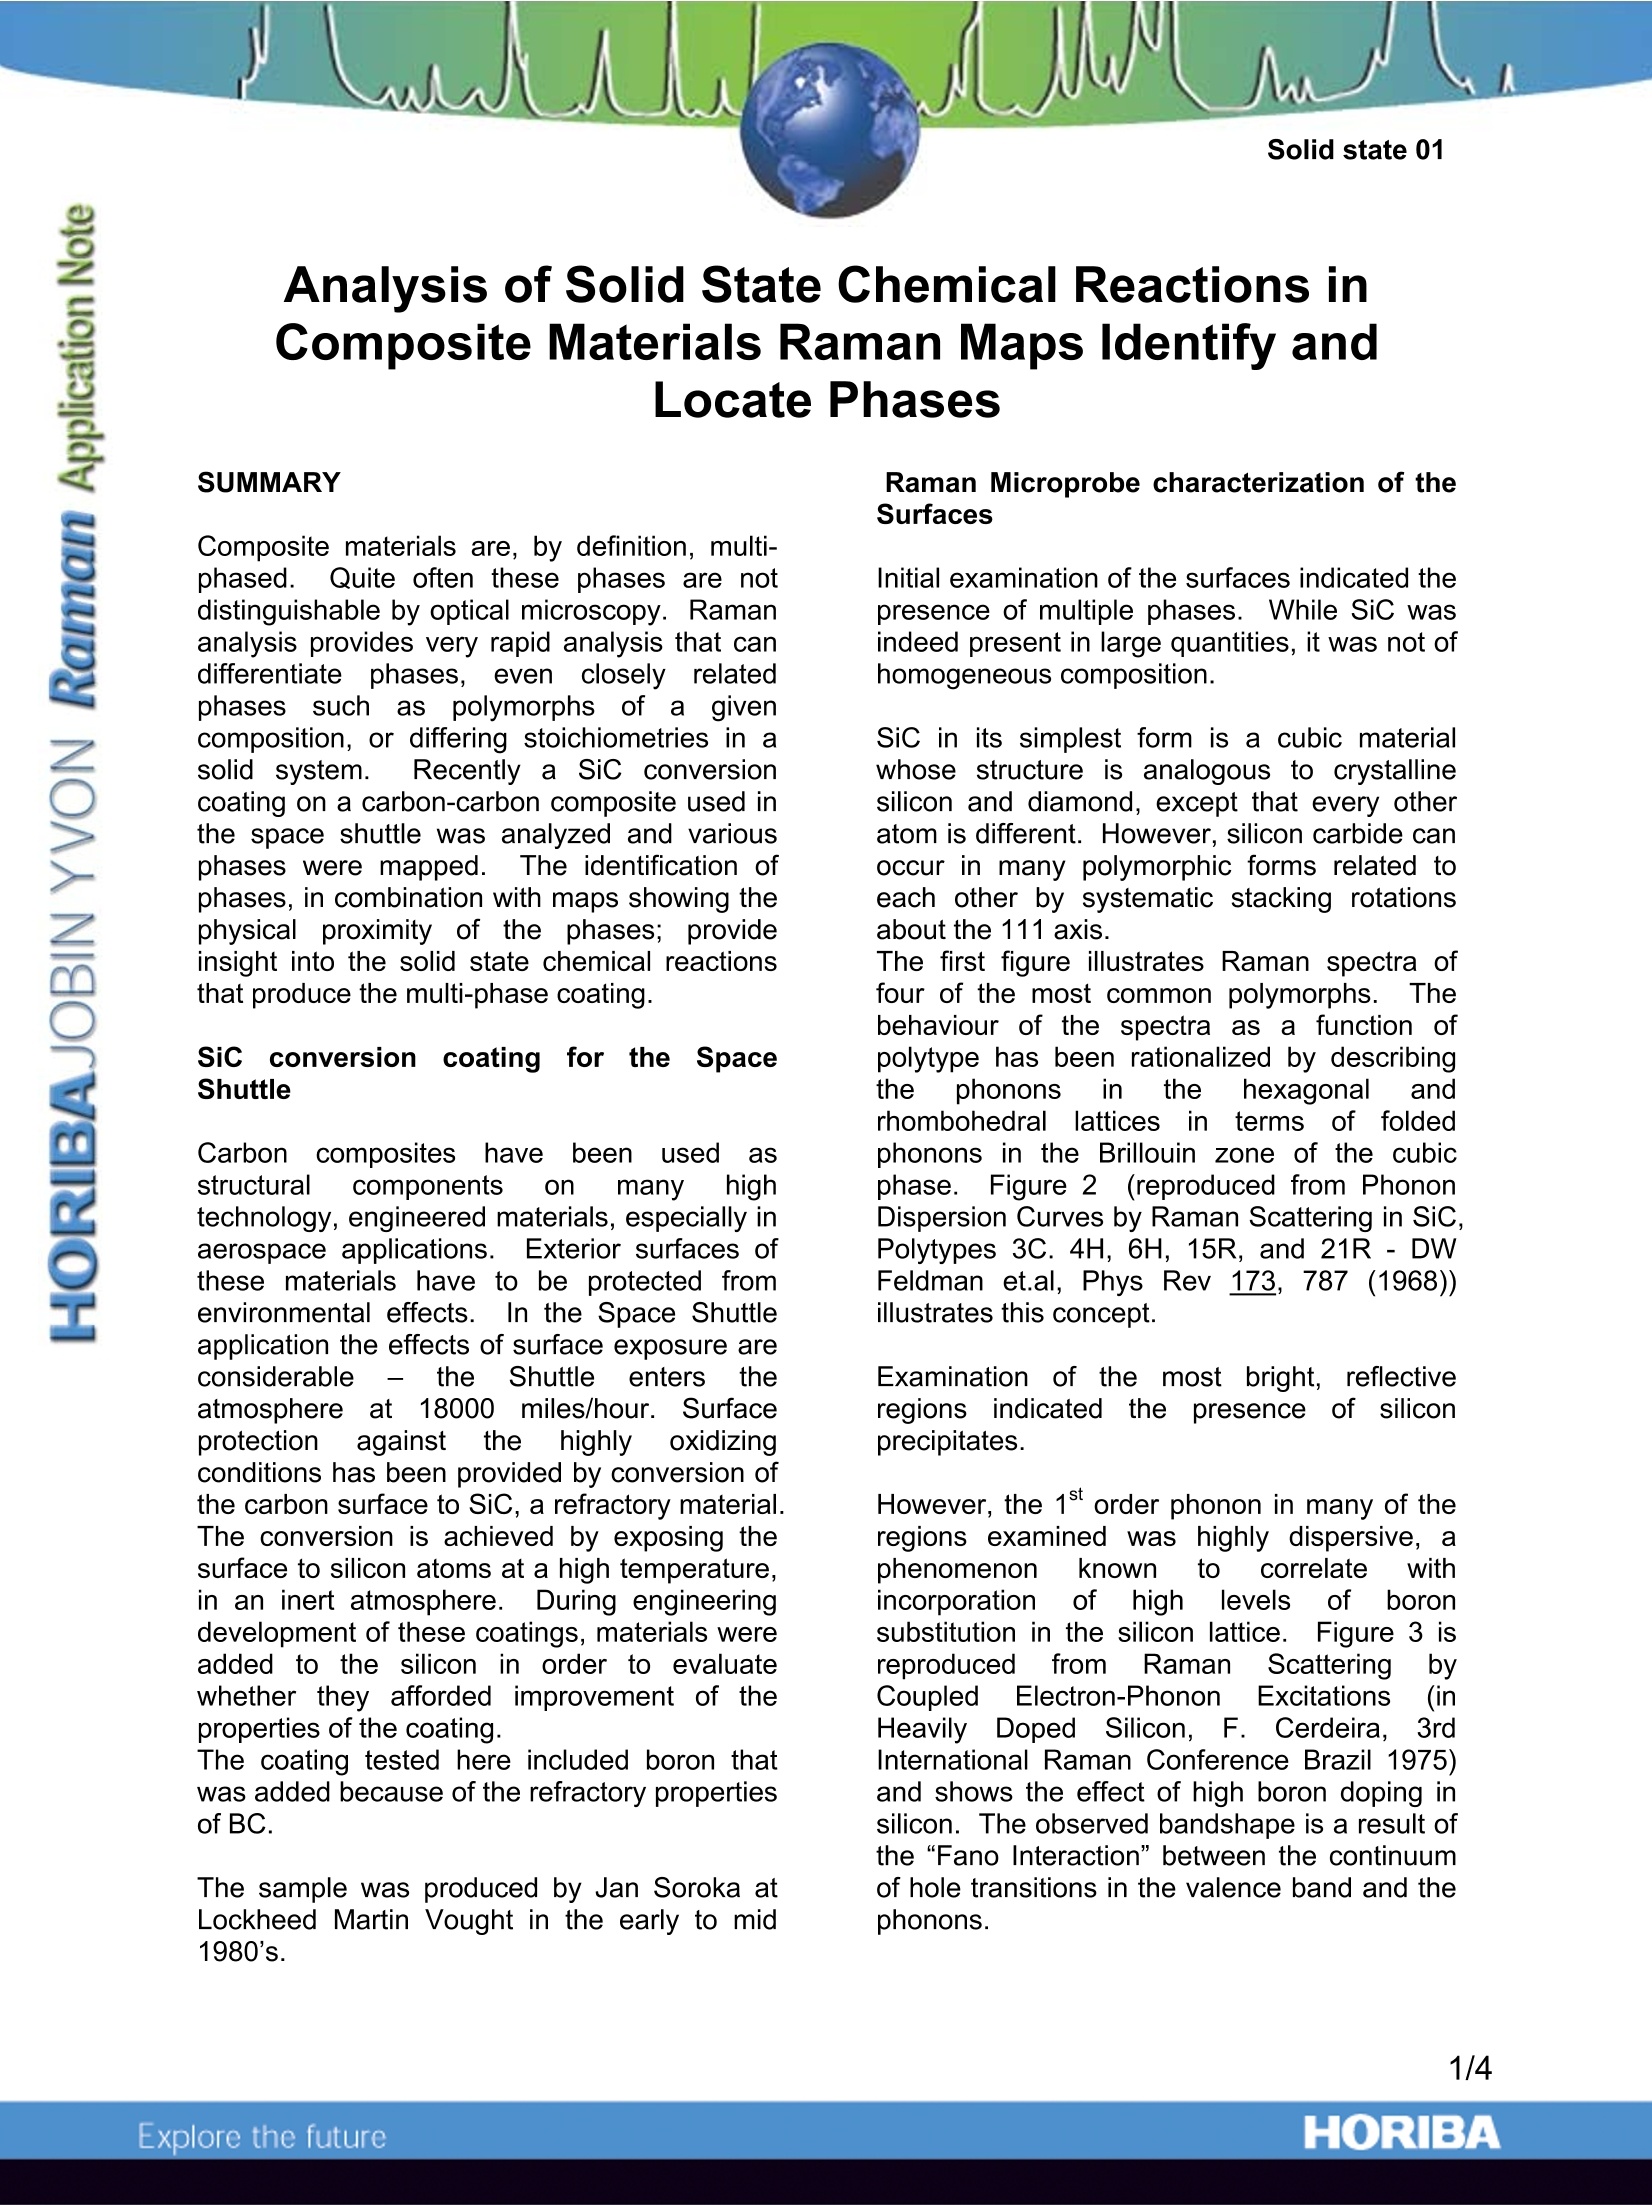
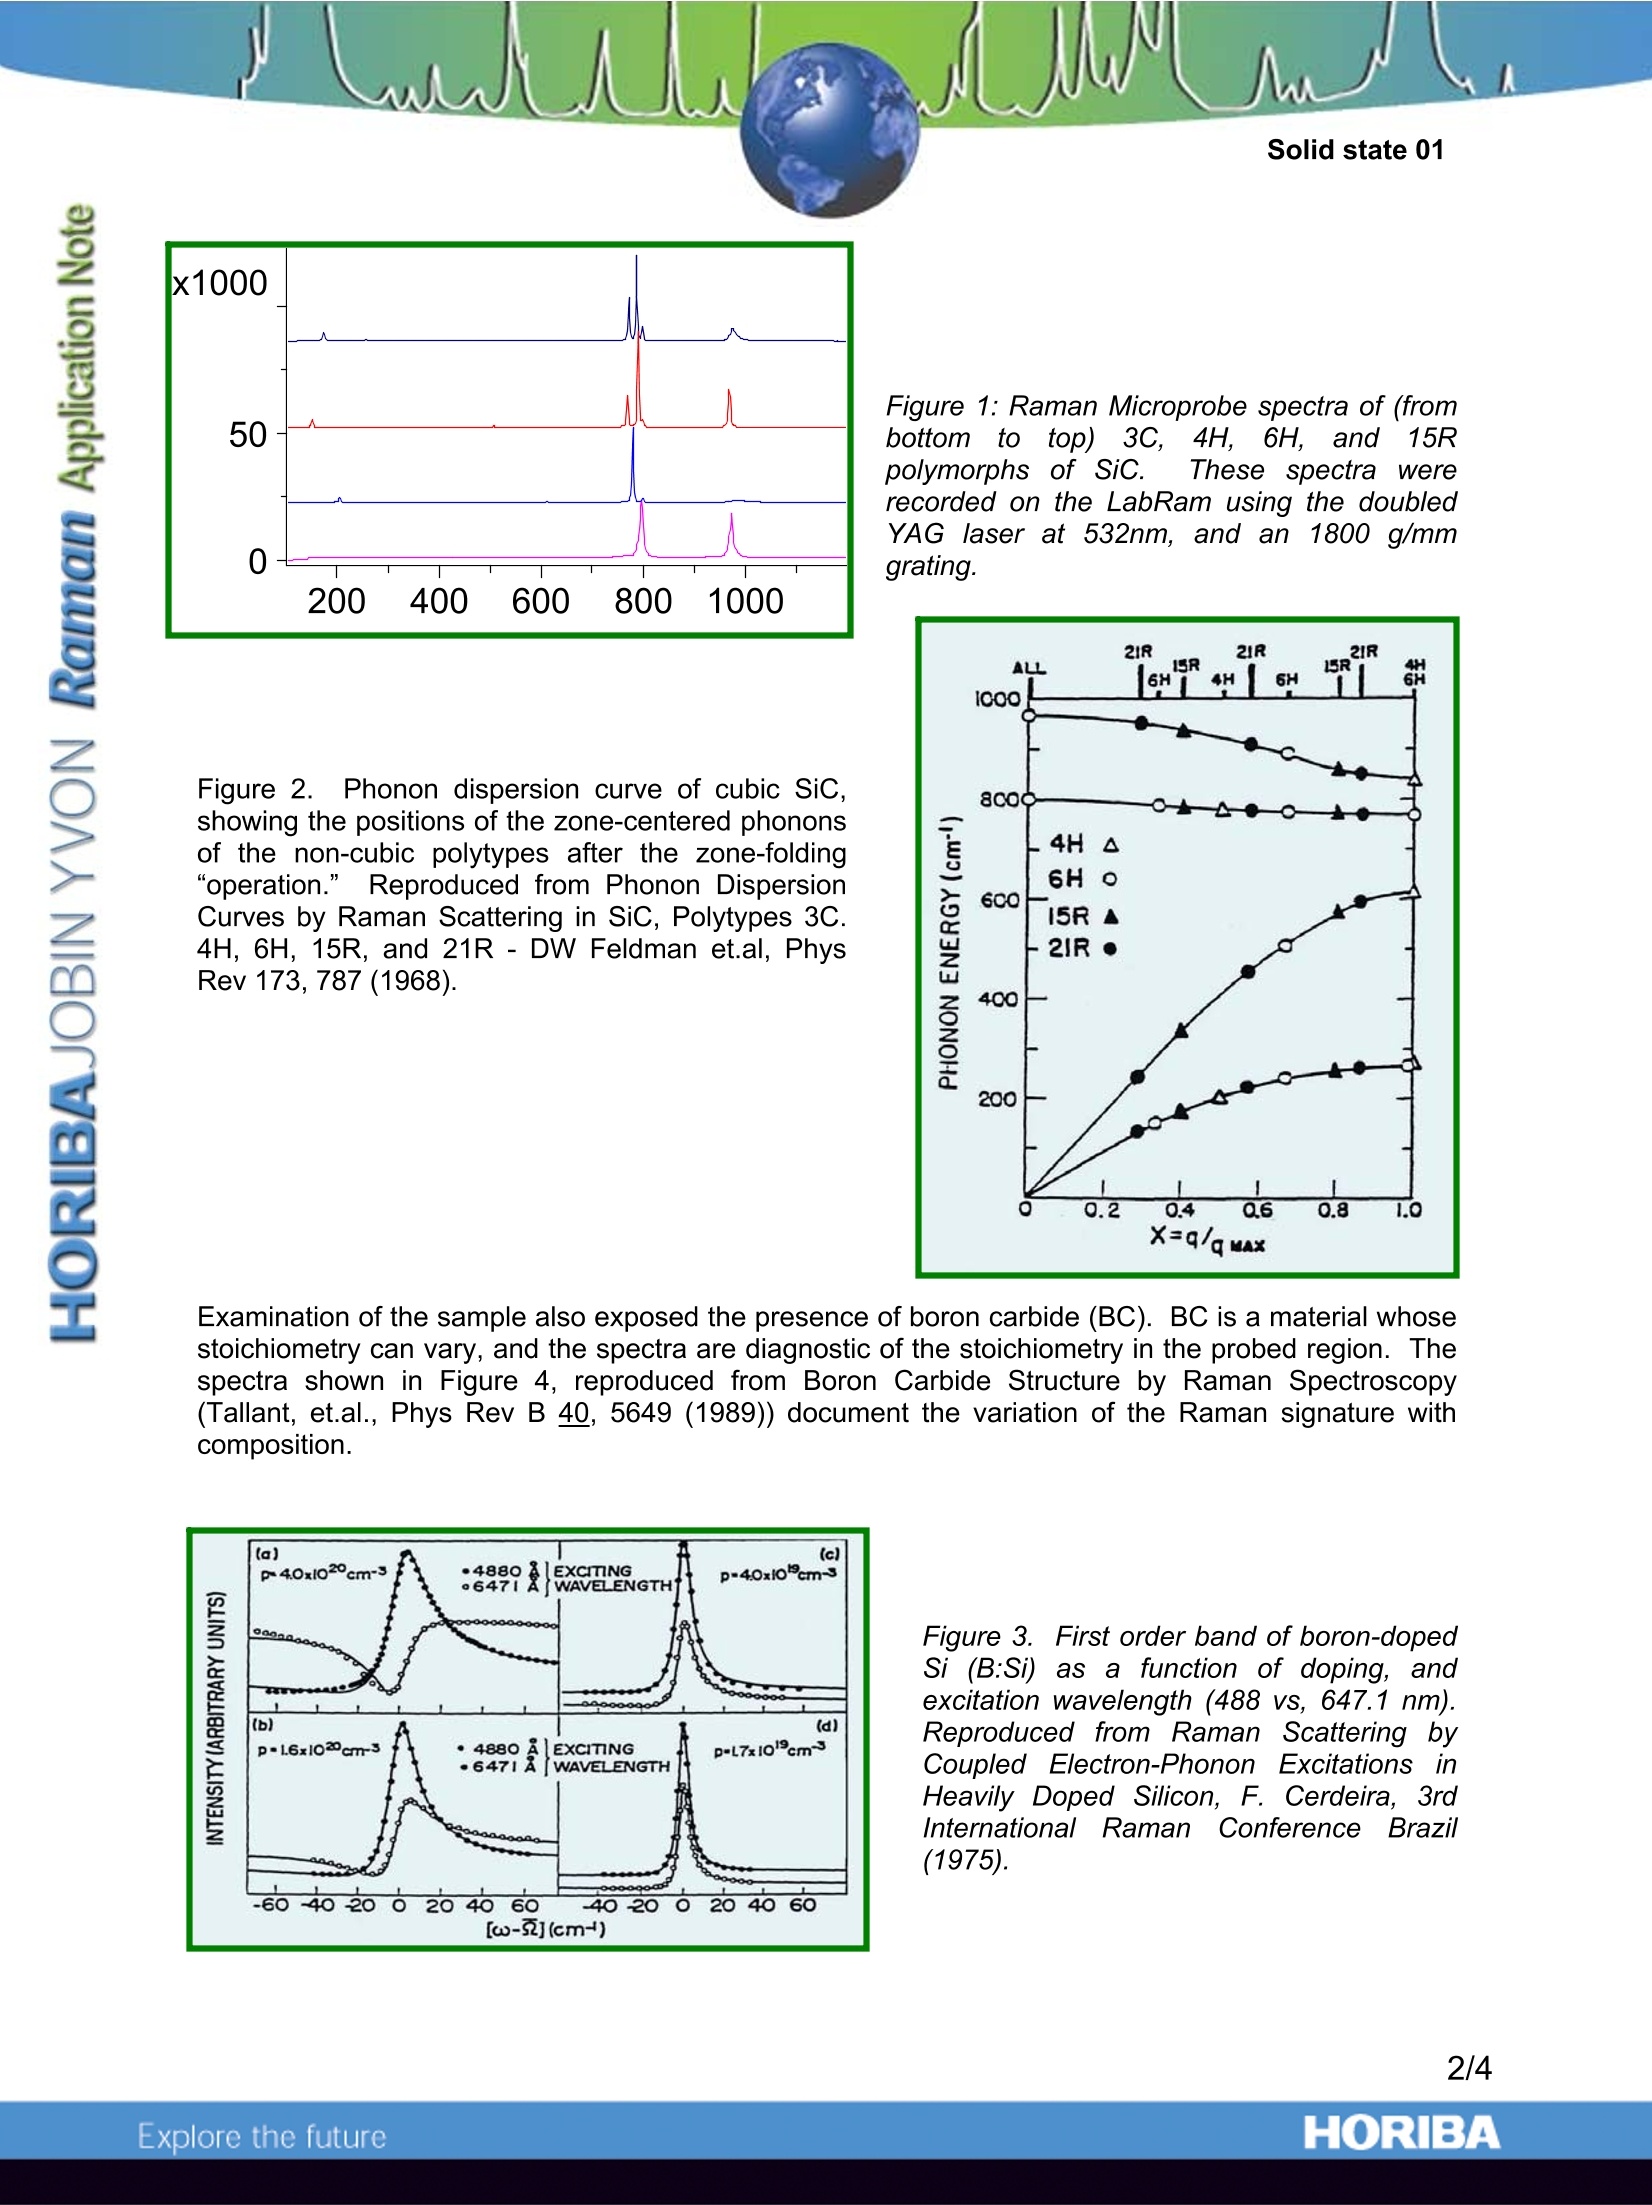
Solid state 01 Analysis of Solid State Chemical Reactions inComposite Materials Raman Maps Identify andLocate Phases Composite materials are, by definition, multi-phased.l. Quite often these phases are notdistinguishable by optical microscopy. Ramananalysis provides very rapid analysis that candifferentiate phases, even closely relatedphases ssuch2aspolymorphs of a givencomposition, or differing stoichiometries in asolid system. Recently a SiC conversioncoating on a carbon-carbon composite used inthe space shuttle was analyzed and variousphases were mapped.The identification ofphases, in combination with maps showing thephysical proximity of the phases;provideinsight into the solid state chemical reactionsthat produce the multi-phase coating. SiC conversionn coatinggtfor theSpaceShuttle Carbon composites hhave tbeen usedasstructurallcomponentson manyhightechnology, engineered materials, especially inaerospace applications.Exterior surfaces ofthese materials have to be protected fromenvironmental effectsIn. the Space Shuttleapplication the effects of surface exposure areconsiderable the Shuttle enters theatmosphereat18000miles/hour. Surfaceprotection against the highlyoxidizingconditions has been provided by conversion ofthe carbon surface to SiC, a refractory material.The conversion is achieved by exposing thesurface to silicon atoms at a high temperature,in an inert atmosphere. During engineeringdevelopment of these coatings, materials wereadded to the silicon in order to evaluatewhether they afforded improvement of theproperties of the coating. The coating tested here included boron thatwas added because of the refractory propertiesof BC. The sample was produced by Jan Soroka atLockheed Martin Vought in the early to mid1980's. Raman Microprobe characterization of theSurfaces Initial examination of the surfaces indicated thepresence of multiple phases.While SiC wasindeed present in large quantities, it was not ofhomogeneous composition. SiC in its simplest form is a cubic materialwhose structure is analogous to crystallinesilicon and diamond, except that every otheratom is different. However, silicon carbide canoccur in many polymorphic forms related toeach other by systematic stacking rotationsabout the 111 axis. The first figure illustrates Raman spectra offour of the most common polymorphs.. Thebehaviour of the spectra as a function ofpolytype has been rationalized by describingthe phonons in the hexagonalandrhombohedrallatticesinterms of foldedphonons in the Brillouin zone of the cubicphase. Figure 2 (reproduced from PhononDispersion Curves by Raman Scattering in SiC,Polytypes 3C. 4H, 6H, 15R, and 21R - DWFeldman et.al, Phys Rev 173, 787 (1968))illustrates this concept. Examination of the mostt1bright, reflectiveregions indicatedthepresence of siliconprecipitates. However, the 1st order phonon in many of theregions examined was highly dispersive, aphenomenon known tocorrelatewithincorporation of highlevels fboronsubstitution in the silicon lattice. Figure 3 isreproduced fromnRaman ScatteringCoupledElectron-Phonon ExcitationsHeavily Doped Silicon, F. Cerdeira, 3rdInternational Raman Conference Brazil 1975)and shows the effect of high boron doping insilicon. The observed bandshape is a result ofthe “Fano Interaction”between the continuumof hole transitions in the valence band and thephonons. x1000 50 0 Figure 2. Phonon dispersion curve of cubic SiC,showing the positions of the zone-centered phononsof the non-cubic polytypes after the zone-folding66operation.”Reproduced from Phonon DispersionCurves by Raman Scattering in SiC, Polytypes 3C.4H, 6H, 15R, and 21R - DW Feldman et.al, PhysRev 173, 787 (1968). Figure 1: Raman Microprobe spectra of (frombottom to top)3C,4H, 6H,and 15Rpolymorphs of SiC. These spectra wererecorded on the LabRam using the doubledYAG laser at 532nm, and an 1800 g/mmgrating. Figure 3. First order band of boron-dopedSi (B:Si)as a function of doping, andexcitation wavelength (488 vs, 647.1 nm).Reproduced from RamanScatteringCoupled Electron-PhononExcitationsinHeavily Doped Silicon, F. Cerdeira, 3rdInternational Raman? Conference Brazil(1975). Figure 4. Raman spectra of BC, of variousstoichiometries (B4C, B13C2, and B11C frombottom to top), reproduced from Boron CarbideStructure by Raman Spectroscopy-Tallant, etal., Phys Rev B 40, 5649 (1989). Raman maps of SiC conversion coatings onCarbon-Carbon composites RamanmapsSindicateddtthe rrichness ofvariability of the composition of the phases inthis coating. It was, of course, anticipated thatthere would be SiC over most of the surface,as well as some BC..We observed multiplephases of SiC as well as BC.However, themost interesting observation was that of thepresence(of smallcrystals;of :silicon.According to the Lockheed Martin engineer,silicon precipitates were present only whenboron was added to the coating mix. It can beinferred that the presence of the B stabilisedthe silicon lattice enough to allowtheseprecipitates to form at the expense of someSiC. Apparently the high solubility of boron inthesilicon1Ilattice (ca.0.8% atroomtemperature which is about 4 times higher thanstated dopant values of 1020 carriers/cc)stabilised the B:Si (boron-doped silicon) lattice,preventing some of the silicon from reactingwith the carbon composite. Figure 5 shows spectra acquired from a regionthat was subsequently mapped. The bottomspectrum plotted in blue shows the siliconcarbide. The middle spectrum, shown in red,is that of B:Si, and the top figure is that of BC(the B4C phase). Figure 5. Raman microprobe spectra of SiC(bottom, in blue), boron-doped Si (middle, inred) and B4C (top, in green). The LabSpec software was used to map thevarious phases.The final map was colour-coded, using the colours in Figure 5, for easycorrelation between phases. The mostfundamental function of LabSpec was used to create the map. Cursors are set to span thewavenumber-shift region of interest, and theintensity between the cursors is used in theRaman map.LUp to three phases can bemapped simultaneously using the colours red,blue and green. The results of such a map areillustrated in Figure 6, side-by-side with the TVimage. Figure 6. TV image (left) and RRaamman map(right) of SiC (blue), B:Si (red) and B4C (green)in a region of the SiC conversion coating. [A more sophisticated method of mapping, notimplemented in this note, uses models in which“pure”spectra would be used to calculateamount of each species at each point in theimage.]Th eT hblue part of the image showshorizontal linear texture which is most certainlya “ghost" image of the original fibers. The finalfigure shows a map created by bracketing linesof 2 different phases of SiC. The map shows acoherent change of phase along a horizontalline near the bottom of the figure. This type ofinformation can certainly by relevant to theprocessengineer ttrying to control theprocess, because the phase formed mustbe related to the physical conditions of thesample during the process. Figure 7.’ Color coded map (right) of sameregion of composite as shown in Figure 6. /thiscasethegreennandbblue representdifferent phases of SiC, as shownintthespectra Conclusion The LabRam Raman Microprobe has beensuccessfully used to determine compositionand phase of areas that appear in varyingshades of grey in TV-captured images.i. IInaddition, confocal maps enable correlation ofspatial features with composition. Because ofthe subtle differences in phase, composition,and doping, that are observed in this sample, itis clear that a Raman microprobe with confocalimaging capabilities can provide informationdifficult to acquire with other techniques. ORIBAExplore the future ORIBAExplore the future The LabRam Raman Microprobe has been successfully used to determine composition and phase of areas that appear in varying shades of grey in TV-captured images. In addition, confocal maps enable correlation of spatial features with composition. Because of the subtle differences in phase, composition, and doping, that are observed in this sample, it is clear that a Raman microprobe with confocal imaging capabilities can provide information difficult to acquire with other techniques.
关闭-
1/4
-
2/4
还剩2页未读,是否继续阅读?
继续免费阅读全文产品配置单
HORIBA(中国)为您提供《SiC涂层中相的鉴定和定位检测方案(激光拉曼光谱)》,该方案主要用于涂料中相的鉴定和定位检测,参考标准《暂无》,《SiC涂层中相的鉴定和定位检测方案(激光拉曼光谱)》用到的仪器有null。
我要纠错
相关方案
 咨询
咨询