方案详情文
智能文字提取功能测试中
Harmful Rlgal BloomSpecieS FLSS-36Identification Strategiesulag ELEMENTAL ANALYSIS FLUORESCENCEGRATINGS & OEM SPECTROMETERSOPTICAL COMPONENTSFORENSICSPARTICLE CHARACTERIZATIONRAMANSPECTROSCOPIC ELLIPSOMETRY SPR IMAGING with the AqualogR andEigenvector, Inc. SoloSoftware Summary This study describes the application of simultaneousabsorbance and fluorescence excitation-emission matrix(EEM) analysis for the purpose of identification andclassification of freshwater planktonic algal species. Themain foci were two major potentially toxic cyanobacterialspecies associated with algal bloom events in the GreatLakes region of the United States. The survey alsoincluded two genera and species of diatoms and onespecies of green algae. The study analyzed the precisionand accuracy of the technique's ability to identify algalcultures as well as resolve and quantify mixtures of thedifferent cultures.Described and compared are the resultsfrom both 2-way and 3-way multivariate EEM analysistechniques using the Eigenvector, Inc. Solo program. It is shown that the 3-way Parallel Factor Analysis(PARAFAC) method can differentiate the major algaldivisions and even provide limited culture level recognitionbased on component scores and ratios. Importantly,however, PARAFAC could not be effectively calibratedwith pure algal cultures to yield unique culture-dependentspectral component loadings. In contrast, the 2-wayClassical Least Squares (CLS) methodology can becalibrated with pure algal culture spectra and taxonomicenumeration data to yield concentrations, cell densities andbiovolume estimates, thus providing the potential capacityfor rapid and precise algal recognition and quantification.In fact, the CLS method can effectively separate differentcyanobacterial mixtures with over 2 orders of magnitudevariation in relative cell density and biovolume with practicalpredicted limits of detection in a few hundreds of cells/ml. Introduction Cyanobacterial species associated with algal bloomscan create health and safety issues, as well as a financialimpact for drinking water treatment plants. These bloomsare a particular issue in the Great Lakes region of theUnited States in the late summer months. Several speciesof cyanobacteria (also known as blue-green algae) canproduce a variety of toxins including hepatotoxins andneurotoxins. In addition, some species can produceso-called taste and odor compounds that, though nottoxic, can lead to drinking water customer complaints,and thus represent a considerable treatment objectiveThe two major cyano species in this study, Microcystisaeruginosa and Anabaena flos-aquae, are commonlyassociated with such notorious bloom events in Lake Erie.The bloom events can be triggered by warm weather andare believed to be exacerbated by agricultural runoff offertilizers, particularly dissolved reactive phosphorous, andwastewater discharge. The traditional methods involved in monitoring andprediction of bloom events center on time- and labor-intensive laboratory procedures. These primarily include:1) Microscopy for species identification and quantification(taxonomic enumeration), 2) Enzyme Linked Immunoassay(ELISA) for quantification of the toxins, and 3) GC-MS fortaste and odor compounds. Hence the main purposeof this study was to investigate the potential for rapid,reagent-free identification and quantification with theAqualog's patented simultaneous absorbance and EEM. data acquisition coupled with multi-way analysis usingEigenvector, Inc.'s Solo package. Simultaneous absorption and EEM data collection affordsan opportunity for either2-wayand or 3-way multivariateanalyses. Two-way analysis involves the unfolding ofthe 3-way EEM data into individual excitation-emission-intensity pairs to generate a 2-dimensional spectralfingerprint. For this study, the 2-way model type employedthe Classical Least Squares (CLS) method which iscalibrated with pure component spectra and concentrationdata to form a library. CLS functions to evaluate byleast squares fitting the linear contributions of the librarycomponents in unknown samples. Parallel Factor Analysis(PARAFAC) method is the 3-way analysis which can becalibrated with a set of sample EEMs to generate a tri-linear model of correlated excitation and emission spectralloading and concentration dependent scores based onan assumed number of components in the calibrationEEM set. PARAFAC calibration cannot constrain modelcomponents to individual EEM samples or files but insteadtreats the calibration EEM set as a whole.PARAFAC isarguably most useful for extracting spectral componentinformation without prior knowledge of the calibrationsystem's components especially when individual EEMsamples in the calibration set contain multiple excitation-emission spectral components. The models were tested using two Cyanophytes, M.aeruginosa, A. Flos-aquae, two Chrysophyte diatomspecies (Nitzschia sp. and Mayamaea sp.) and oneChlorophyte algal species (Selanastrum sp.). The reportbelow describes the significance of results obtained byattempting to calibrate the 2- and 3-way models usingthe same pure algal culture data followed by attempts tovalidate the models with test culture samples and mixturesin comparison to independent taxonomic enumeration. Materials and Methods Pure algal cultures were provided in log-growth phase bythe USEPA (Cincinnati, OH). Suspensions of each specieswere diluted with high-quality water (QW:> 18 MQ,TOC< 0.1 ppm) such that the desired peak chlorophyllabsorbance (1 cm path length) at 680 nm (versus a blankof QW) was obtained. Diluted suspensions were constantlystirred in a 1-cm path quartz fluorescence cell (at 25°C). Table 1. Taxonomic Description of the Five Algal Cultures Analyzed The algal taxonomic enumeration was determined using400X magnification according to the 2012 APHA Utermohlmethod (APHA, 2012. Standard Methods for Examinationof Water and Wastewater, 22 ed.American Public HealthAssociation (APHA), American Water Works Association(AWWA), Water Environment Federation (WEF), USA.). The Aqualog conditions included a 5 nm excitationinterval, CCD binning of 2 pixels (approximately 1 nm),and medium gain with an integration time range between0.5 and 1 second. All EEMs were normalized based onthe instrument settings to a 1 um NIST SRM936 quininesulfate unit (QSU) in perchloric acid. For model calibrationEEMs, collected in replicates of 5 per pure algal culturesample, were corrected for instrument spectral bias,Rayleigh scatter, and inner-filter effects using the Aqualogsoftware. To maximize the signalto noise ratio for themodel calibrations, the five replicate EEMs for each culturewere averaged. EEMs were analyzed using Eigenvector,Inc. Solo as described below. Table 1 describes the taxonomy of the five algal speciesanalyzed identified using the taxonomic enumerationmethod. Figure 1 shows the algal EEMs used for modelcalibrations organized to compare the three main types ofalgae including: the two (Fig. 1 A and B) different orders ofCyanophytes (M. aeruginosa and A. flos-aquae), the two(Fig. 1C and D) diatoms (Mayamaea sp. and Nitzschia sp.),representing two different families of Chrysophytes, andthe (Fig. 1E) Chlorophyte (Selenastrum sp.). What is clearfrom these EEMs is the striking similarity of the CyanophyteEEMs signified by the major strong excitation/emissionfeature around 615 nm/655 nm attributed to the phycobilinchromophores. Likewise the two diatoms also exhibitedvery similar EEM features with excitation bands in the blueregion attributed to the fucoxantin based light-harvestingcomplexes and the chlorophyll emission bands in the redregion (around 680 nm). Lastly the green algal specimenexhibited typical chlorophyll-carotenoid based lightharvesting excitation in the blue and chlorophyll emissionband in the red (around 685nm). Genus Family Order Class Division Taxon Anabaena Nostocaceae Nostocales Myxophyceae Cyanophyta bluegreen Microcystis Microcystaceae Chroococcales Myxophyceae Cyanophyta bluegreen Selenastrum Oocystaceae Chlorococcales Chlorophyceae Chlorophyta green Nitzschia Bacillariaceae Pennales Bacillariophyceae Chrysophyta diatom Mayamaea Naviculaceae Pennales Bacillariophyceae Chrysophyta diatom The PARAFAC calibration model (Fig.1) included thefive separate cultures, each measured as the sum of fivereplicates. The calibration resolved a maximum of threespectral loadings based on the core-consistency (93%)and model redundancy notifications and accounted for>95% of the variance. The EEM contours of the spectralcomponent loadings are shown in Figure 2. Component1 (C1) in Fig.2A shows one major contour mode closelyresembling the cyanophyte emission in Figs. 1A andB with a major excitation/emission (Ex/Em) coordinatepeak around 615 nm/655 nm. Component 2 (C2) in Fig.2B shows several contour modes closely resemblingthe Chrysophyte emission overall in Figs. 1C and D withbroad excitation/emission coordinate peaks around 460nm/680 nm and minor Ex/Em peaks around 640/680nm. Component 3 (C3)in Fig. 2C shows several contourmodes closely resembling the Chlorophyte emission overallin Fig. 1E with broad excitation/emission coordinate peaksaround 440 nm/680 nm and minor Ex/Em peaks around650/680 nm. Figure 3 shows the PARAFAC component scorescorresponding to the spectral loading contours in Fig. 2. 800. 800 750- 750- 700 700- 450- 0.8750 Selenastrum 400 10 1.000 400 450 500 550 600 650 700 Excitation wavelength, nm Figure 1. Excitation emission matrices representing the sum of fiveindividual sample measurements of each species used for the 2-wayand 3-way model calibrations.(A) M. aeruginosa; (B) A. flos-aquae; (C)Mayamaea sp.; (D) Nitzschia sp.; (E) Selenastrum sp. Component 1 had the highest score in both Cyanophytes,M. aeruginosa (MC) and A. Flos-aquae (A). Component2 dominated both the Chrysophytes, Myamaea (MD) andNitzschia (N). Component 3 dominated the ChlorophyteSelenastrum(S). Importantly, the results indicated that thePARAFAC model, when calibrated with five pure uniquealgal cultures under these conditions, did not yield fiveunique species-specific spectral component loadings.Clearly, however, the component scores especially thedominant ones did distinguish each of the three majoralgal Orders, namely, Cyanophyta, Chrysophyta, andChlorophyta, respectively. Themean±SD componentscores were graphically different comparing A and MC,with relatively higher scores for component 3 and lowerscores for component 1 in A. A student’s T-test confirmedthat the means of both C1 and C3 for A and MC weresignificantly different with less than a 2x10⁴ probability ofeither of them coming from the same mean and population.However, as indicated graphically by the overlappingmean±SD values the PARAFAC scores C2 and C3 couldnot be used to significantly distinguish the two diatoms MDand N; the student’s t-test indicated >39% probability theyshared the same mean population. Figure 2. PARAFAC spectral loading contours for the 3 component(C1-C3) calibration model corresponding to the five species of algaeand EEMs in Figure 1. Figure 3. PARAFAC component scores (±SD) for components (C1-C3)for five replicate individual sample EEMs of each species validated withthe calibration model from Figure 2. Note scale break on y-axis for C3. The fact that the PARAFAC calibration model did notyield five unique spectral loadings is consistent with themathematical principle of PARAFAC, which correlatesorthogonal excitation and emission component spectralshapes among the entire set of EEMs in the calibration dataset. It is not possible to constrain PARAFAC to generatea unique component for a given unique sample (in thiscase a singular algal species) in a given mixed calibrationset of EEMs. Further, it is well-known that PARAFACcomponents do not necessarily reflect chemicallydistinct components and it is also possible for similarspectral shapes to be correlated with different chemicalcomponents. For example, in Figure 3 it is likely thatsimilarities between the spectral shapes of the Fucoxanthinlight harvesting components in the Chrysophytes and thechlorophyll -carotenoid light-harvesting components of theChlorophyte spectra are purely coincidental to explain theobservation of component 2 in the latter. Classical Least Squares In contrast to the orthogonal shape- and calibration-sample-set-dependent model calibration principles ofPARAFAC, the Classical Least Square (CLS) methodprovides an obligatory means for calibration. In thisstudy CLS used 2-way EEM data from the individual algalspecies to generate unique corresponding spectral librarycomponents. CLS also has the additional benefit of thecapacity to assign quantitative concentration dependentinformation for each EEM in the calibration set. ThusCLS significantly enhances the potential to make positiveidentification in an unknown mixture at greater phylogenicresolution (e.g., order, family, genus, or perhaps specieslevel). Figure 4 shows the results of validation of fivereplicate samples of each of the five algal cultures. Despitethe apparently similar spectral features of the Cyanophytesand Chrysophytes the data confirm that there was aremarkable positive identification (ID) fraction on average Test Sample Figure 4. CLS component positive ID Fractions of five individualvalidation replicates for each algal sample based on the model calibratedusing the summed EEMs from Figure 1. of greater than 97% for each culture. In fact, the onlyevidence of minor crosstalk was observed between algaeof a similar Division such as in sample N3 or A1 where aminor fraction of the MD or MC components, respectively,were included in the model. The phylogenetic resolution of the CLS method was furthertested using reciprocal mixtures of A and MC mixed to atotal A680 cmof 0.16 to generate mixtures of a predictedlinear ratio of the two key Cyanophytes. Figure 5 showsthe CLS method was able to distinguish, quantify andidentify the two species with a very high linear correlationover a wide range of A:MC absorbance ratios varying from1 to 0.005 (or 100 to 0.5%). Cell Density and Biovolume Calibration The relationship between the cell density (cells/ml)and biovolume (um3/ml), measured independently bytaxonomic enumeration, was evaluated by linear regressionfor the same A and MC mixtures in Figure 5. Themeasured A680 and QSU normalized fluorescence datafrom the CLS analysis were evaluated. Table 2 shows thelinear regression statistics, described with an interceptfixed at O, with standard errors in the slopes of aroundCV=13% for A and CV=9.67% for MC with adjustedr values of 0.88 and 0.93, respectively. Table 2 alsoshows that A exhibited for the same A680 much highercell densities (around 34-fold) and biovolumes (around26-fold) than M. Likewise, the fluorescence conversionfactor exhibited around 16 and 12 fold higher cell densitiesand biovolumes, respectively, for A and MC. The ratio ofA680 and fluorescence conversion factors for cell density(or biovolumes) was around 123 for A and 58 for MCindicating the fluorescence quantum yields, based on thenormalized A680 values, were significantly different for thetwo cultures analyzed under these conditions. Sample Fraction (Total A680 cm=0.16) Figure 5. Linear regression plots of the actual and predicted relativeabsorbance values from CLS analysis for a reciprocal mixture of Anabaenaflos-quae (closed) and Microcystis aeruginosa (open) corresponding tothe same A680 cm1for each corresponding sample. The slope wasfixed at 1 and the red lines represent the model fit and the green lines the95% confidence intervals. The adjusted r values were 0.99797 for A and0.9882 for MC. Table 2. Linear regression statistics for the relationships between cell density and biovolume and the absorbance at 680 nm and QSU Fluorescenceintensity for A. flos-aquae and M. aeruginosa. Species Cells/ml SE Biovolume SE Cells/ml SE Biovolume SE CV% Adjusted r (um3/ml) (um/ml) A. Flos- 1.88E+07 2.45E+06 9.45E+08 1.23E+08 1.53E+05 1.99E+04 7.68E+06 1.00E+06 13.01 0.879 aquae M. 5.54E+05 5.36E+04 3.62E+07 3.50E+06 9.52E+03 9.20E+02 6.22E+05 6.01E+04 9.67 0.930 aeruginosa Ratio 33.9 26.1 16.1 12.3 Figure 6 further explores the significance of the cell densityand biovolume calibrations by plotting the values predictedusing the conversion factors from Table 2 as a function ofvalues predicted by CLS in the reciprocal mixtures of AandMC described in Figure 5. Most notably, in the presenceof roughly 1.35E+06 cells/ml of A it was possible to detectand identify MC at around 1.5E+03 cells/ml (i.e., close to a900-fold cell density ratio); this corresponded to roughly a688-fold difference in biovolume. In Figure 7 the relative limits of detection for the pureculture A. flos-aquae were estimated by linear regressionfor a serial dilution with three replicates for each sample of Sample Fraction (Total A680 cm"=0.16) Figure 6. Comparison of the cell density (cells/ml) and biovolume (um/ml) as a function of the A680 cm-to predict the cell densityand biovolume based on the enumeration calibrationdata in Table 2. The lowest concentration (see insetFig. 7) used in the dilution corresponded to an A680cm-1value of 7.4E-5 which corresponded to a predictedcell density of 2428±377 cells/ml and a biovolume of1.22E+05±1.89E+04pm3/ml. Notably the integration timeused for all samples was 0.5 s thus it is reasonable toassume that as a function of integration time the sensitivityand precision could easily be increased linearly for apredicted limit of detection of around a few hundred cells/ml. E0E0 Figure 7. Estimated limit of detection for A. flos-aquae determinedby linear regression of a serial dilution as a function of A680 cmandpredicted cell density and biovolume. The EEM and absorbanceconditions included a 0.5 s integration time at medium gain. Values forA680 cm- were predicted by CLS as described previously. The linearregression statistics for cell density and biovolume included an interceptfixed at 0, an adjusted r=0.999 and predicted slopes of 1.88E7±9.32E5and 9.45E8±4.68E6,respectively. The red line defines the fit and thegreen lines represent the 95% confidence bands. Note the expandedscale in the inset. Conclusions The conclusions of this study center on the flowchart in Figure 8 which explains how the CLS andPARAFAC methods in Solo can be compared as abasis for establishing rapid, reliable analysis methodsfor differentiating different algal types.D.The PARAFACmethod, when calibrated with pure culture spectra,affords the capacity to rapidly and effectively separateand identify major algal orders (Cyanophyta, Chrysophytaand Chlorophyta). PARAFAC can also possibly identifydifferent types of cyanobacteria more specifically based onevaluation component scores and score ratios. PARAFACcalibration may not yield unique spectral loadings foreach algal culture nor necessarily allow unambiguousassignments of spectral components to identifiablephysical components in the calibration data set. CLSon the other hand requires calibration with pure culturesamples and exhibits the capacity to generate unique,culture-specific spectral component libraries. Further,based on independent cell density and biovolumecalculations it was clear the CLS method can potentiallyprovide rapid, reliable estimates of these parameters withhigh-precision. In conclusion, it is clear that the AqualogEEM and Solo model analyses show potential for rapidevaluation of algal types and could prove useful in rapidfield and laboratory level cyano harmful algal bloom identification, especially when carefully calibratedwith pure algal culture samples. Due caution is noted interms of dealing with the morphological and physiologicalproperties of the samples in terms of spectroscopy andthe requirement for due diligence in terms of establishingdetection concentration limits in the ranges needed forpositive identification. Importantly, it is well known thatalgal spectral properties are significantly affected by thelight-environment, temperature and nutrient conditionsamong other factors so algal culture methods usedfor calibration would ideally take these factors intoconsideration and independent methods of qualificationand quantification including taxonomic enumeration areadvised. Acknowledgments HORIBA Instruments, Inc. thanks EPA Cincinnati forproviding the algal cultures, and Mrs. Sakiko Akaji forassistance with analysis and data acquisition. USA: +1 7324948660 China:+86 (0)21 6289 6060 www.horiba.com/scientific JOBIN YVONlechnologyHORIBAExplore the futureAutomotive Test Systems I Process & Environmental Medical Semiconductor l Scientific info.sci@horiba.comFrance:+() Germany: +()taly: + Japan: +() razil: + Other: + K: +()ORIBAExplore the futureAutomotive Test SystemsFProcess & EnvironmentalIMedical SemiconductorISScientific The conclusions of this study center on the flow chart in Figure 8 which explains how the CLS and PARAFAC methods in Solo can be compared as a basis for establishing rapid, reliable analysis methods for differentiating different algal types. The PARAFAC method, when calibrated with pure culture spectra, affords the capacity to rapidly and effectively separate and identify major algal orders (Cyanophyta, Chrysophyta and Chlorophyta). PARAFAC can also possibly identify different types of cyanobacteria more specifically based on evaluation component scores and score ratios. PARAFAC calibration may not yield unique spectral loadings for each algal culture nor necessarily allow unambiguous assignments of spectral components to identifiable physical components in the calibration data set. CLS on the other hand requires calibration with pure culture samples and exhibits the capacity to generate unique, culture-specific spectral component libraries. Further, based on independent cell density and biovolume calculations it was clear the CLS method can potentially provide rapid, reliable estimates of these parameters with high-precision. In conclusion, it is clear that the Aqualog EEM and Solo model analyses show potential for rapid evaluation of algal types and could prove useful in rapid field and laboratory level cyano harmful algal bloom identification, especially when carefully calibrated with pure algal culture samples. Due caution is noted in terms of dealing with the morphological and physiological properties of the samples in terms of spectroscopy and the requirement for due diligence in terms of establishing detection concentration limits in the ranges needed for positive identification. Importantly, it is well known that algal spectral properties are significantly affected by the light-environment, temperature and nutrient conditions among other factors so algal culture methods used for calibration would ideally take these factors into consideration and independent methods of qualification and quantification including taxonomic enumeration are advised.
关闭-
1/6

-
2/6

还剩4页未读,是否继续阅读?
继续免费阅读全文产品配置单
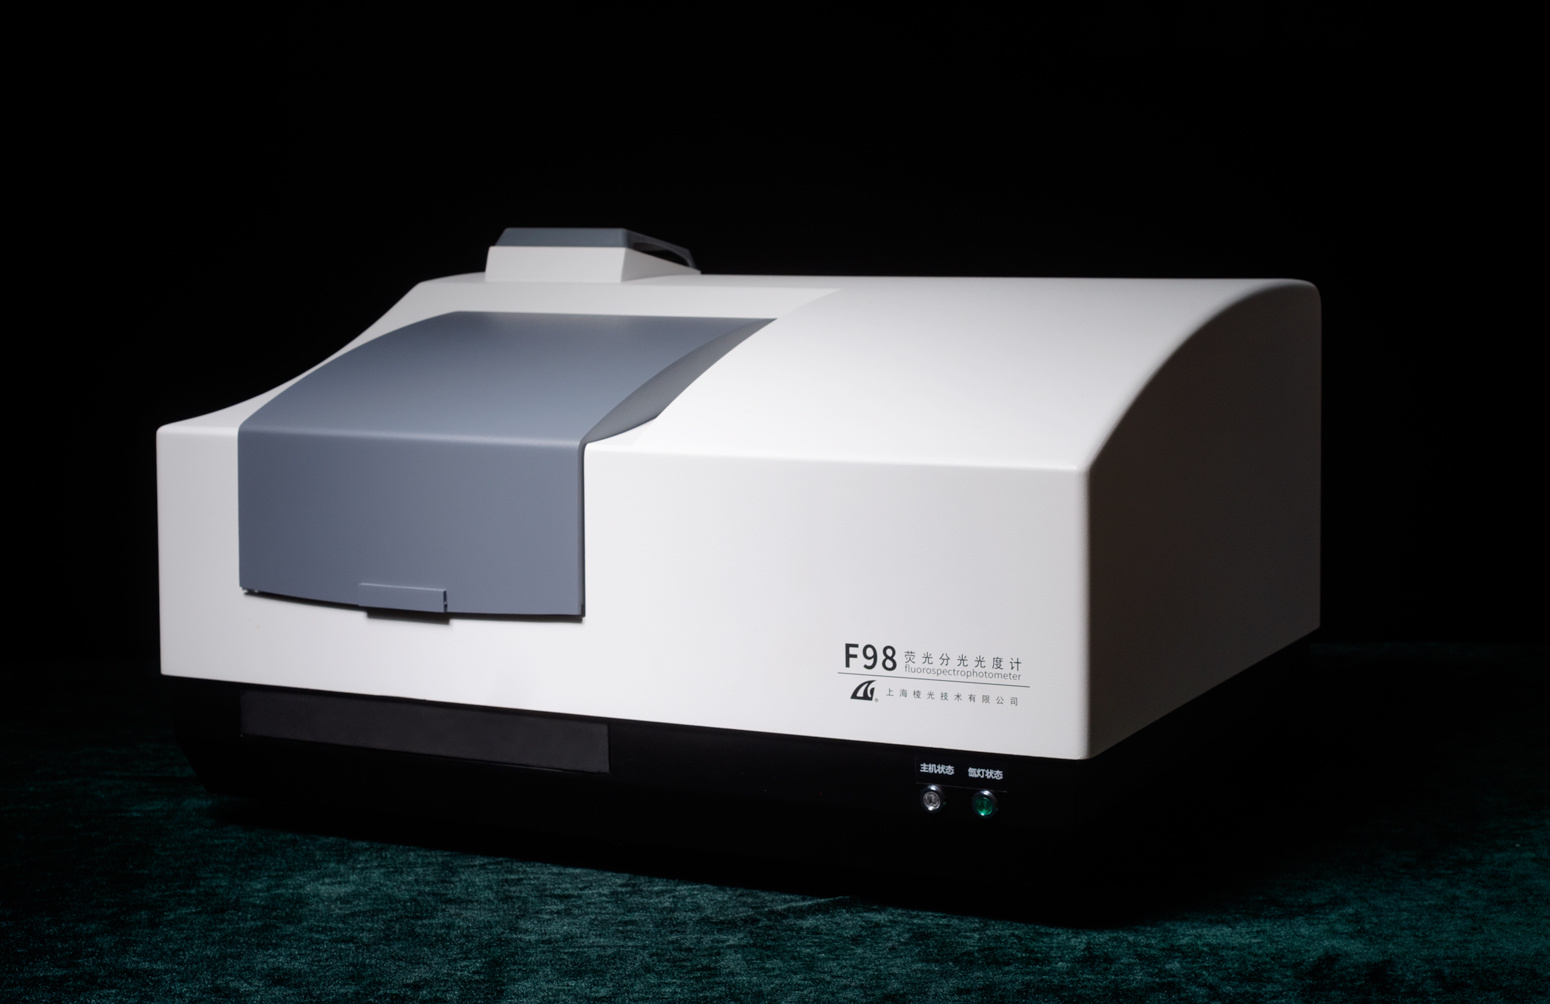
HORIBA(中国)为您提供《海藻中EEM,PARAFAC检测方案(分子荧光光谱)》,该方案主要用于生物环保中EEM,PARAFAC检测,参考标准《暂无》,《海藻中EEM,PARAFAC检测方案(分子荧光光谱)》用到的仪器有HORIBA Aqualog®同步吸收-三维荧光光谱仪。
我要纠错
推荐专场
相关方案
 咨询
咨询