方案详情文
智能文字提取功能测试中
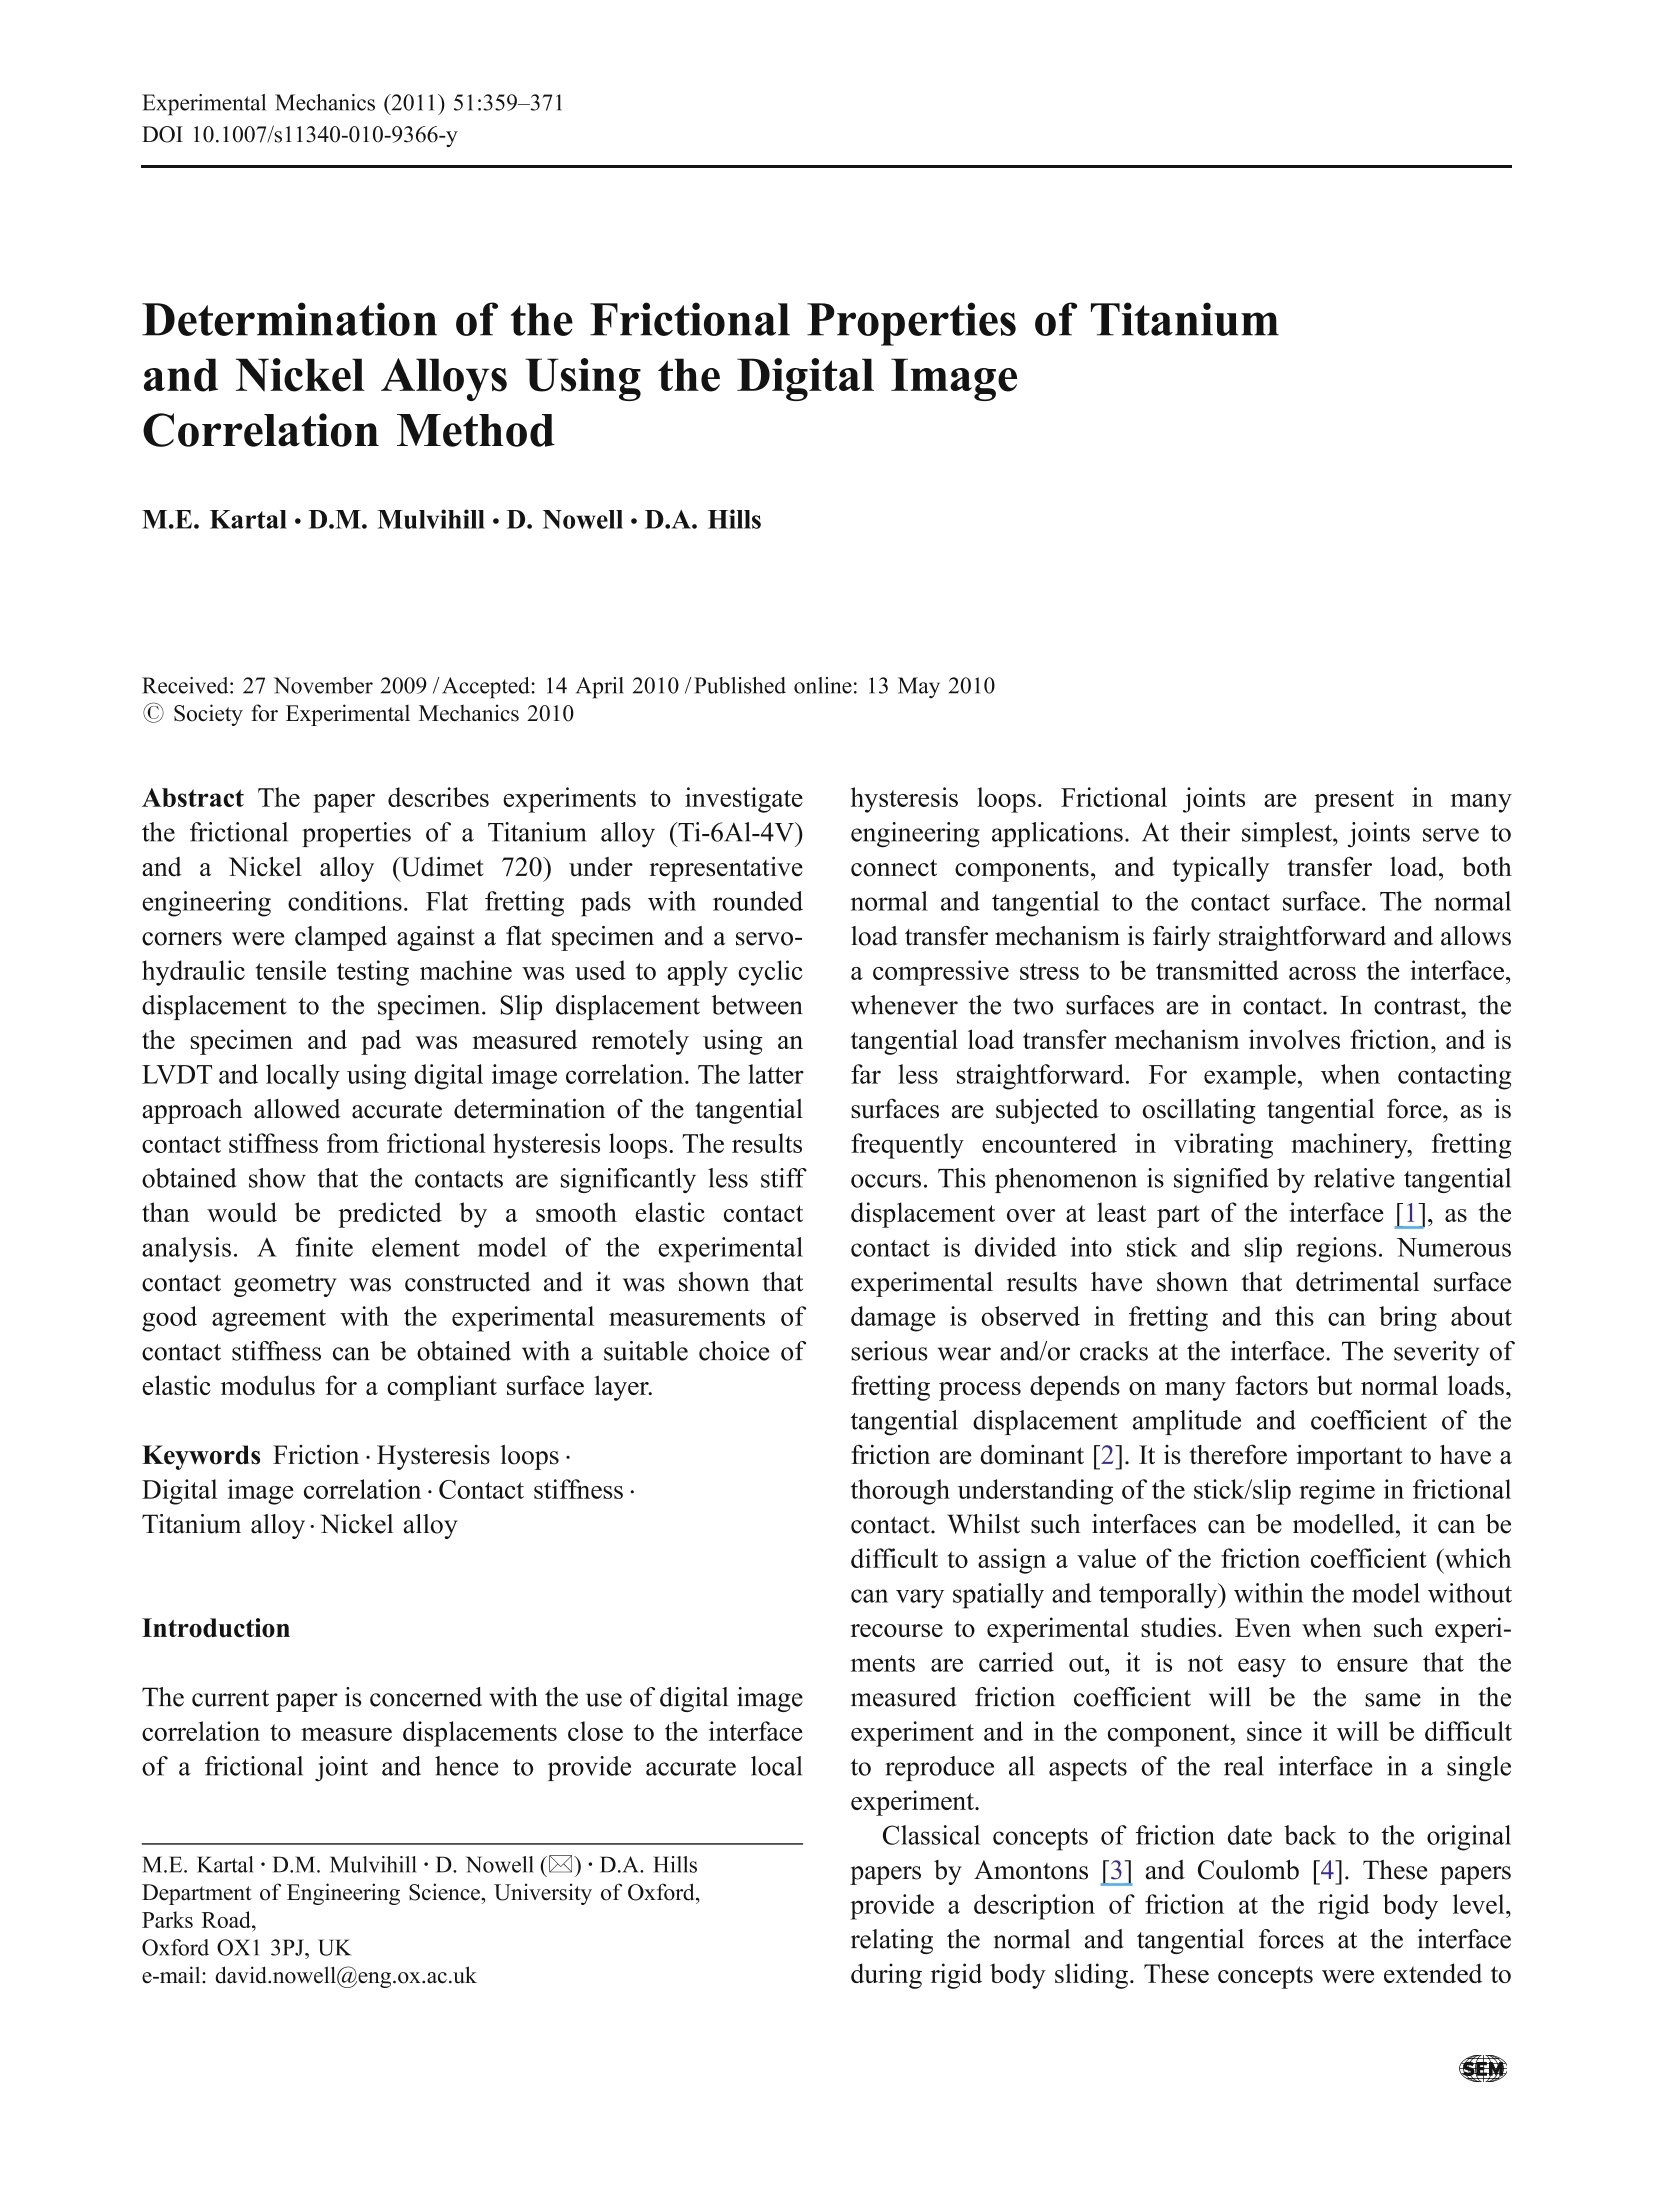
ResearchGateSee discussions,stats, and author profiles for this publication at: https://www.researchgate.net/publication/226428535 Experimental Mechanics (2011) 51:359-371DOI 10.1007/s11340-010-9366-y Determination of the Frictional Properties ofTitanium and Nickel Alloys Using the DigitalImage Correlation Method Article in Experimental Mechanics· March 2011 DOl: 10.1007/s11340-010-9366-y CITATIONS READS 23 ( The user has requested enhancement of the downloaded file. All in-text references underlined in blue are added to the original document and are linked to publications on ResearchGate, letting you access and read them immediately. ) Determination of the Frictional Properties of Titaniumand Nickel Alloys Using the Digital ImageCorrelation Method M.E. Kartal·D.M. Mulvihill·D. Nowell·D.A. Hills Received: 27 November 2009 /Accepted: 14 April 2010 /Published online: 13 May 2010C Society for Experimental Mechanics 2010 Abstract The paper describes experiments to investigatethe frictional properties of a Titanium alloy (Ti-6Al-4V)and a Nickel alloy (Udimet 720) under representativeengineering conditions. Flat fretting pads with roundedcorners were clamped against a flat specimen and a servo-hydraulic tensile testing machine was used to apply cyclicdisplacement to the specimen. Slip displacement betweenthe specimen and pad was measured remotely using anLVDT and locally using digital image correlation. The latterapproach allowed accurate determination of the tangentialcontact stiffness from frictional hysteresis loops. The resultsobtained show that the contacts are significantly less stiffthan would be predicted by a smooth elastic contactanalysis. A finite element model of the experimentalcontact geometry was constructed and it was shown thatgood agreement with the experimental measurements ofcontact stiffness can be obtained with a suitable choice ofelastic modulus for a compliant surface layer. Keywords Friction·Hysteresis loops·Digital image correlation· Contact stiffness·Titanium alloy·Nickel alloy Introduction The current paper is concerned with the use of digital imagecorrelation to measure displacements close to the interfaceof a frictional joint and hence to provide accurate local e-mail: david.nowell@eng.ox.ac.uk hysteresis loops. Frictional joints are present in manyengineering applications. At their simplest, joints serve toconnect components, and typically transfer load, bothnormal and tangential to the contact surface. The normalload transfer mechanism is fairly straightforward and allowsa compressive stress to be transmitted across the interface,whenever the two surfaces are in contact. In contrast, thetangential load transfer mechanism involves friction, and isfar less straightforward. For example, when contactingsurfaces are subjected to oscillating tangential force, as isfrequently encountered in vibrating machinery, frettingoccurs. This phenomenon is signified by relative tangentialdisplacement over at least part of the interface [1], as thecontact is divided into stick and slip regions. Numerousexperimental results have shown that detrimental surfacedamage is observed in fretting and this can bring aboutserious wear and/or cracks at the interface. The severity offretting process depends on many factors but normal loads,tangential displacement amplitude and coefficient of thefriction are dominant [2]. It is therefore important to have athorough understanding of the stick/slip regime in frictionalcontact. Whilst such interfaces can be modelled, it can bedifficult to assign a value of the friction coefficient (whichcan vary spatially and temporally) within the model withoutrecourse to experimental studies. Even when such experi-ments are carried out, it is not easy to ensure that themeasured friction coefficient will be the same in theexperiment and in the component, since it will be difficultto reproduce all aspects of the real interface in a singleexperiment. Classical concepts of friction date back to the originalpapers by Amontons [3] and Coulomb [4]. These papersprovide a description of friction at the rigid body level,relating the normal and tangential forces at the interfaceduring rigid body sliding. These concepts were extended to a smaller length scale by Cattaneo [5] and Mindlin [6], whoused Coulomb friction to describe the response of an elasticcontact in partial slip, by relating shear traction to normalpressure. Within this framework, provided the contactingbodies are elastically and geometrically similar, the initialapplication of a normal load will not cause any relativetangential displacement of corresponding surface pointsafter they come into contact. In this state the contact is saidto be in the ‘stick’regime. If a small tangential force remotefrom the contact interface is subsequently applied, thecontact area will in general consist of a mixture of a smallerstick region, where contacting points are adhered, and a slipregion where tangential relative movement occurs. Thiscondition is the so-called ‘partial slip'state of the contact[7]. Finally, if the remotely applied tangential force ismonotonically increased, the stick zone will continue toreduce in size until it finally disappears and relativetangential motion is observed over the entire contact area.This case is frequently called ‘gross sliding’and isaccompanied by rigid body motion of one body relative tothe other. If the applied tangential load (or displacement) isnow cycled, the response of the contact will involve allthree of these regimes (provided the tangential load issufficiently large). Initially, upon reversal of the load, therewill be stick. This will be followed by partial slip andfinally gross sliding. The three regimes may readily beidentified from a force/displacement hysteresis loop for thecontact. The discussion above is primarily concerned with thefriction coefficient. However, this is not the only parameterof interest from a mechanics perspective. Models of thenatural frequencies and mode shapes of vibration of a singlecomponent can be very accurate [8]. However, whenfrictional interfaces are present (as is the case withassemblies of components) additional damping and com-pliance are introduced by the interfaces. These featuresmake it difficult to predict the vibration characteristics ofassemblies with the same degree of accuracy as can beachieved for single components. It is therefore important tobe able to measure the contact stiffness (or alternativelycompliance) and frictional hysteresis energy loss for aparticular pair of surfaces. If these interface properties canbe determined and their variation with load, frequency etcunderstood, is should be possible to significantly enhancecurrent models of the vibration of engineering assemblies[9]. The preceding paragraphs describe the background andmotivation for our work, which is to provide detailedmeasurements of frictional behaviour in conditions whichare representative of engineering contacts. A number ofrecent articles have taken a similar approach and studied thefrictional properties of various contact geometries using avariety of rig designs and material pairs [10-16]. These researchers used conventional techniques, such as linearvariable differential transformers (LVDT) [11-13] andextensometers[15]t ot omeasure surface displacements.Inevitably, these are remote measurements and additionalcompliance between the contact interface and the measure-ment point means that it is difficult to separate out contactand ‘bulk’components of stiffness. Filippi et al. [16] used alaser interferometer to measure the displacement andcontact stiffness of cylindrical pad on a flat surface. Thisallowed measurement much closer to the contact interface.However, thiiss approach did not produce a full-fieldmeasurement of displacement, which is to be preferred ifone wishes to measure local response of the contact (e.g. toinvestigate stick/slip regions and local compliance). Theseconsiderations suggest the use of optical methods, such asmoire, speckle interferometry or digital image correlation. The current paper describes measurements of frictionalhysteresis loops in representative engineering contacts fortwo materials and two surface finishes. Digital imagecorrelation is employed to measure displacements close tothe contact and from these an accurate value of interfacestiffness is calculated. Finite element analysis is then usedto compare the results with the predictions of contactmechanics, with and without a compliant surface layer.Whilst digital image correlation is now a well-establishedexperimental technique, we believe this is the first time itsapplication to measurement of frictional contact behaviourhas been reported in the literature. Experiments The materials chosen for this work are the Titanium alloyTi-6A1-4V and the Nickel alloy, Udimet 720, both widelyused in aerospace and power generation applications. Thematerials were supplied by Rolls-Royce plc. Typical elasticmaterial properties for these alloys are given in Table 1,together with the chemical composition. Specimens andpads were machined to the geometry shown schematicallyin Fig. 1. Surface roughness values were measured using anAlicona ‘Infinitefocus’instrument, which produces surfaceprofile information over an area by focus variation [17]. Forthe Udimet material, a single surface condition (area rootmean square (RMS) roughness, S~1.88 um) was speci-fied, but for the Titanium alloy, two surface conditions wereinvestigated: normal grinding was used to create a ‘smoothground’surface finish (S~1.49 um), whereas a roughground’surface (S~2.74 um) was produced by using aheavier than normal cut with a single pass of the grindingwheel. As can be seen from Fig. 1, the experimental geometrywas chosen as a flat pad with rounded corners in contactwith a flat specimen. The contact geometry was specifically Table 1 Mechanical properties and chemical composition of Ti-6A1-4V and Udimet 720 modulus ratio offset),(MPa) (GPa) Ti-6Al- 115 0.31 999 Al(5.5-6.75),V(3.5-4.5),N(0-0.05), C(0-0.08),O(0-0.2), Fe(0-0.4), H(0- 4V [18] 0.02), Ti (Balance) Udimet 219 0.33 881 Cr(15.5-16.5), Co(14.0-15.5), Mo (2.8-3.3), W(1.0-1.5), Ti(4.8-5.3), Al(2.3- 720 2.8), C(0.01-0.02), Zr(0.03-0.05), B(0.01-0.02), Ni(Balance) [19] chosen to give a pressure distribution representative of thatin a typical dovetail blade root of a gas turbine engine[20]. Both specimen and pads were 10 mm thick, giving anominal contact area of 8×10 mm. Fig. 1 also shows aschematic diagram of the loads acting on the pad andspecimen during testing. The two pads are pushedhorizontally against the specimen by a constant normalforce, P. The specimen is then moved sinusoidally in thevertical direction between the two contacting pads toproduce slip. This slip gives rise to a frictional force, Q,at each of the pad/specimen contacts. If it is assumed thatconditions at each contact are approximately similar, thenthe total tangential force, 2Q, can be measured at the top ofthe specimen using a conventional load cell. Apparatus and Test Method The friction measurements were performed at ambienttemperature using a servo-hydraulic tensile testing machine(Dartec) with a calibrated 125 kN capacity load cell. TheDartec machine is shown schematically in Fig. 2, andconsists of load cell, a hydraulic actuator, and a cast ironblock attached to the machine base. Each fretting pad isattached to a cylindrical mount, and each mount is a closesliding fit in a cylindrical hole in the cast iron block.Hydraulic cylinders are used to load the two pads againstthe specimen and a hydraulic accumulator is used tomaintain constant normal load in the event of pad wear.The applied normal force was chosen to be 5.6 kN so thatthe mean normal pressure on the contact surface wasapproximately 70 MPa. This is broadly representative of themean contact pressure in practical designs of dovetail joint. ( 1 B lades are frequently f i tted i nto t he d isks o f a g as turbine so thatthey can b e e asily removed in the event of damage or if one component becomes lif e -expired. Th e joint takes the form of a mal e and female w e dges and is ref e rred to a s a ‘dovetail’ (after the similar j oint in carpentry). A multiple lobe geometry is r eferred t o a s a‘ f irtree’joint, and this is sometimes used w here i n sufficient s trength is obtained w ith a d ovetail. ) ( Some contact occurs on t he rou n ded part s of the pad profile, so thatthe actual contact area is slightly larger than 8 0 mm ) The remote applied displacement was varied sinusoidally at1 Hz with (zero to peak) amplitude of 500 um. Each testwas carried out until the total accumulated slip displace-ment had reached 5 m. Note that slip displacement in eachhalf cycle differs from the applied displacement due to thecompliance of the machine, as illustrated in the schematichysteresis loop in Fig.3. Pads and specimens were cleaned with acetone beforeeach experiment, and each test was carried out in a ‘dry’(i.e. unlubricated) contact condition. Remote displacementmeasurement was provided by an LVDT recording relativemovement between the specimen mounting and the castiron block. However, in order to calculate an accurate valuefor the tangential contact stiffness, relative tangentialdisplacement needs to be measured very close to contactinterface. It is difficult to mount an LVDT sufficiently closeto the contact and there will therefore be a significant errorin the magnitude of measured contact stiffness due to thecompliance of the specimens and experimental rig betweenthe measuring position and the contact itself. Henceadditional displacement measurements, close to the contactinterface, were taken using digital image correlation, asdescribed in section“Digital Image Correlation below. Fig. 1 Schematic diagram of specimen and pads showing appliedloads, key dimensions, and field of view for DIC measurements(FOV) Fig. 2 Schematic diagram of the overall apparatus Instrumentation and Data Logging Experimental data was recorded using a National Instru-ments signal conditioning box together with an acquisitioncard. A Labview ‘Virtual Instrument’ program, written byKim [21], was used to acquire load data from load cell anddisplacement data from LVDT in real time. Data wascollected at 40 Hz, so that 40 pairs of load-displacementreadings were available in each cycle. Separate computerswere used for data-logging and for controlling the Dartectest machine. As explained above, it was necessary to acquire imagesclose to the contact interface for subsequent Digital ImageCorrelation. Because of the amount of data involved, it wasnot practical to acquire images continuously. Hence, at thebeginning of each block of 100 cycles, 100 images atconstant framing rate of 40 fps and 1024×768 pixelsresolution were captured, thus giving 2.5 cycles ofinformation. The images collected were not directly“tagged’with the corresponding load values, but compar-ison of specimen displacements obtained by digital imagecorrelation with those recorded from the LVDT allowed theimages to be cross-referenced to the load during post-processing. A high resolution (1.3 Mega-pixels at 10 bit)monochrome camera designed for a broad range of Fig. 3 Schematic diagram of a frictional hysteresis loop industrial imaging applications [22] was used. This camerahas a simple USB 2.0 interface and is based on the CypressIBIS5 CMOS global shutter progressive scan sensor with a2/3" optical format. A Questar QM1 long distance microscope [23] with avariable zoom and a working distance of (150-355 mm)was used as a lens for the camera. The camera and Questarwere mounted on precision translation stages in order toallow accurate positioning of the field of view usingreference features in the image. The working distance (thedistance between the microscope and the object surface)was set to the maximum allowable value (355 mm) to givea field of view of 1.8 mm×1.4 mm, approximately in thecentre of the contact. This produces images with a pixelsize of 1.8 um. Illumination was provided by a remote lightsource connected to Questar by fibre optics. This arrange-ment gave co-axial illumination which was found toprovide excellent contrast of surface features for the DICcalculations. The imaged surfaces of the pad and specimenswere not specially prepared since the original machiningprocess (grinding) gave a surface with sufficient featuresand good contrast. Fig. 4 shows the complete experimentalapparatus, including the test machine, fixture, and Questarmicroscope. Fig.5 shows a typical captured image, overlaidwith displacement vectors obtained from subsequent digitalimage correlation. The grey vertical bar down the centre ofthe image is the mask applied close to the interface for theDIC calculations. Masking of this region avoids dealingdirectly with the displacement discontinuity caused by slipat the interface. Digital Image Correlation Digital image correlation (DIC) is by now a well estab-lished technique in experimental mechanics for the mea-surement of displacement [24]. The method uses natural orartificial surface features and cross-correlates two slightly Fig. 4 Photograph of apparatus in-situ, showing testing machine,fixture, and Questar microscope Fig. 5 Typical captured image, overlaid with results from DICcalculations (arrows show calculated displacements) different images obtained before and after a remotelyapplied load step to provide the whole field deformationof a surface. Robust commercial software is now availablefor the correlation calculations, in addition to public domainapplications. In the work reported here, image correlationwas performed by using DAVIS ‘Strainmaster’ DICsoftware package, developed by LaVision [25] based onoriginal code for particle image velocimetry [26]. Thesoftware uses an FFT based correlation [27] in which anormalised cross correlation coefficient is calculated as afunction of the displacements dx, dy, between a pair of sub-regions in the reference and displaced images. A surface isthen fitted to the values of the correlation function in orderto find the position of the peak. The corresponding valuesof dx and dy are then taken as the displacement of the pointat the centre of the sub-region. After each experiment, the stored images were processedusing the DAVIS software. In each set of images, imagecorrelation was carried out relative to the first image (i.e.the displacements in image i were calculated by correlatingit with the first image in the sequence). Multi-pass analysiswith a decreasing sub-region size was chosen to calculatethe displacement field using three passes. The initial sub-region size was 128×128 pixels with a 25% overlapbetween adjacent sub-regions. After the first pass, the sub-region size was reduced to 64×64 pixels for the remainderof the passes. The computed vector results in the first passare used by the software as a ‘best-choice’sub-region shiftfor subsequent passes. This approach is often found to givemore precise and consistent calculations of displacement[25]. In addition, the reduced sub-region size which ispossible in the second and third passes gives a finerresolution of displacement values. Once the displacement had been obtained,the calculateddisplacement field was exported from the software into aMATLAB data manipulation script to form arrays for eachframe consisting of the x and y displacement values for the region of interest. Since the field of view was in the centreof the contact, there was little displacement variation withvertical position, and each column in the displacementarrays was therefore averaged to improve the signal to noiseratio. Fig. 6 shows a typical set of y-displacement contoursobtained, illustrating the lack of variation in the x-direction.As a result, a single row of displacement data was obtained,giving the variation of displacement in the x-direction withhorizontal () position. Relative tangential displacementbetween the pad and specimen was calculated by subtract-ing pad displacement from specimen displacement usingL Spairs of reference points at chosen spacings (Li, L2. etc),Fig. 7. A MATLAB script was then used to plot thehysteresis loops of tangential (friction) force against relativedisplacement Results and Discussion In order to check the agreement between the LVDT anddigital image correlation results, a calibration experimentwas first carried out. For this purpose, the applied specimendisplacement amplitude (i.e. zero to peak) was chosen to be150) um and the pads were not present. Hence, thespecimen is expected to move sinusoidally as a rigid bodyand the displacement can be measured using both techni-ques and compared. The results of this calibration test areshown in Fig. 8. It can be seen that excellent agreement wasobtained. Friction Coefficients Following the calibration experiment, frictional hysteresisloops for each pad-specimen material pair were obtained.Fig. 9(a-c) show the loops from the 10th, 500th, 1000th,and 3000th cycles obtained from Ti-6A1-4V`smoothground', Ti-6Al-4V ‘rough ground’and Udimet 720 tests,respectively. Note that the displacement values used in thisfigure were acquired from the LVDT and the tangentialforce plotted is the total from both pads (20). As can beseen from the figure, both sets of Ti-6A1-4V experimentsshow a steady increase in tangential force with the numberof fretting cycles. In addition, the Ti ‘rough ground’experiment shows slightly higher tangential forces thanthe ‘smooth ground’experiment. However, the effect isrelatively small, suggesting that initial surface profile (atleast in the range investigated here) does not have a greateffect on the measured hysteresis loops). In contrast, theUdimet 720 experiment shows a more dramatic rise intangential force within the first few hundred cycles. Therealso seems to be a more distinct rise in the tangential forceduring the gross sliding part of each loop than is observedwith the Ti-6A1-4V tests. It will be noted that all of the Fig. 6 Typical contour plot oftangential (x) displacements(mm) over the field of view,showing lack of variation in thex-direction (Udimet 720) 0.2975 0.3385 m刀m 0.34 y position (mm) loops show some degree of ‘backlash’ in the form ofreduced stiffness as the force passes through zero. This is asa result of the small clearance of the cylindrical pad mountsin the cast-iron block and the use of remote displacementmeasurement. In order to show the variation of the coefficient of thefriction for all three experiments, friction coefficients wereby dividing the sliding tangenticattributed to each pad (i.e. half the total measured tangentialforce corresponding to gross sliding) by the applied normalforce: Fig. 7 Position of DIC reference points within the field of view No at the total sliding tangential force, 2Qsliding wasidentified manually from the loops, but that this is relativelystraightforward to do, although it does introduce a smalluncertainty (see transition region from partial slip to grosssliding in Fig. 9(a-c)). In order to assess the repeatability of the experiments,from each of Ti-6Al-4V ‘smooth ground’, rough ground’and Udimet 720 materials, multiple pad-specimen pairswere machined with nominally identical surface rough-ness. Fig. 10(a-c) shows the variations of coefficient offriction versus number ofcycles for Ti-6A1-4V ‘smoothground’, rough ground' and Udimet 720 materials,respectively. Note that, prior to carrying out the experi-ments, it was difficult to decide the minimum value ofapplied displacement which would result in gross slidingfor part of the cycle throughout the entire experiment. Thefirst experiment for Ti-6Al-4V‘smooth ground’surfaceswas carried out using an initial applied displacement of±0.35 mm. However, after 730 cycles were completed, theincrease in the coefficient of friction meant that theapplied displacement was no longer sufficient to producegross sliding, and the contact underwent a transition to thepartial slip state. In this condition,parts of the surface arenot in the limiting frictional state and it is no longerpossible to measure the coefficient of the friction by ( ’It would, of course, have b e en possible to write a script to identify t he relevant point in the loops, but it would have been necessary to make this sufficiently robust to cope w ith different shapes of loop in t he r egion close to t h e onset of sliding. Overall it wa s dec i ded that itwas simpler in t his case to examine t he loops manually. ) Fig. 8 Comparison of displacements obtained from LVDT and DIC inthe calibration experiment examining the ratio of total force (equation (1)). Hence,after 730 cycles, the applied displacement was increasedto ±0.5 mm and this value was applied for the remainderof the tests..This change in applied displacement isresponsible for the abrupt fall in friction coefficientnoticeable for experiment 1 in Fig. 10(a). This is likelyto be associated with a loss of registration’ betweenasperities and corresponding wear pits on the matingsurface as the applied displacement is changed. Compar-ison between the friction coefficients for Ti-6A1-4V‘smooth ground’ and rough ground’ specimens showslittle influence of initial surface roughness [Fig. 10(a-b)].Both surface finishes show similar overall behaviour: aninitial increase in friction (perhaps due to surface cleaning,‘bedding in’, or wear) lasts for around 3000 cycles. ForUdimet 720 there was less consistency between the twospecimens tested [Fig.10(c)]. The reason for using the ‘sliding tangential force’ in thedefinition of friction is largely due to consistency with theoriginal Amontons/Coulomb definition. However, it shouldbe noted that all three material pairs show an increase oftangential force during the sliding part of each cycleincluding a noticeable peak at the end of sliding (Fig. 9),which may be due to interaction of the pad with the wearscar on the specimen. Other definitions of friction coeffi-cient may also be used, e.g. by averaging the tangentialforce for the whole of the gross sliding region or by usingthe maximum value of the tangential force in the cycle.Fig. 11 shows the variation with number of cycles of thefriction coefficient, evaluated according to each of the threedefinitions discussed above (for the Ti-6A1-4V ‘smoothground’case). Firstly, it is clear that all three definitionslead to an increase in friction with the number of frettingcycles. This is likely to be due to an increase in the realcontact area aswear proceeds. Secondly, there iss :an increasing difference between the ‘maximum’and ‘slidingforce’ values, as the force peak at the end of slidingbecomes more pronounced. This is also reflected to someextent in the average value. Displacement(mm) Displacement (mm) Fig. 9 Recorded hysteresis loops at N=10, 500, 1000 and 3000cycles, obtained from (a) Ti-6A1-4V‘smooth ground', (b) Ti-6Al-4V‘rough ground' and (c) Udimet 720 pad-specimen pairs Number of cycles (b) -Experiment 1--Experiment 2 (c) --Experiment 1|--Experiment 2 Fig. 10 Variation of coefficient of friction with number ofcycles for(a) Ti-6A1-4V‘smooth ground',(b) Ti-6A1-4V ‘rough ground'and (c)Udimet 720 experiments The discussions above concern the interpretation of thehysteresis loops to obtain friction coefficients and displace-ment measurements are used only to plot the loops and toindentify the onset of sliding. Either LVDT or DICmeasurements are appropriate for this purpose. However, Fig. 11 Variation of coefficient of friction calculated by maximumforce, average force and sliding force for one of the Ti-6Al-4Vsmooth ground’experiments if we wish to evaluate tangential contact stiffness in thepartial slip regime, greater care must be taken. Fig. 12shows a comparison of the hysteresis loops plotted usingLVDT and DIC measurements at 400 cycles for the Ti-6A1-4V ‘smooth ground’case. The other two materials showsimilar behaviour. Three loops are shown: the LVDT loopis based on remote measurement; that labelled ‘DICspecimen’ was obtained by DIC measurements on thespecimen close to the interface (and assuming that the padswere rigid); finally, that labelled ‘DIC relative’employsrelative displacement calculated by subtracting pad dis-placement from specimen displacement. As can be seenfrom the figure, the hysteresis loop obtained from theLVDT measurement is the most compliant loop, asexpected due the remote nature of the displacementmeasurement. By measuring the displacement on thespecimen using DIC, part of the compliance of the systemcan be eliminated. However, the compliance of the pad andits mounting arrangement remains (including the ‘backlash’referred to above). Hence, the most accurate hysteresis loopis obtained using relative displacement. This eliminates thebacklash feature and provides the largest value for contactstiffness. As will be discussed further below, the preciseshape of the loop in the partial slip regime will depend onthe position of the reference points for the DIC measure-ments. In Fig. 12, the spacing used was 200 um. Particular attention is given to evaluation of thetangential contact stiffness in the region where the motionhas just reversed (see Fig. 3). The loops are almost linear inthis region and a single stiffness value can therefore beevaluated. Some judgment is required in determining howfar the linear region extends, but four data points werethought to be appropriate for the current experiments.Fig. 13 shows an expanded version of this part of the Fig. 12 Comparison of the hysteresis loops obtained from LVDT,‘DIC specimen’and ‘DIC relative'measurements at 400 cycles for theTi-6A1-4V‘smooth ground’case hysteresis loop for Udimet 720 in this region. The fourdifferent curves correspond to four different spacings of thereference points for the DIC measurements. It can be seenthat the closer these points are, the higher the observedstiffness. This is as expected, since the measured value willcomprise elements arising from the interface itself (e.g.deformation of the asperities in rough contact) and ‘bulkelastic compliance of the contacting bodies. By placing thepoints closer together, we are eliminating some of the bulkcompliance, giving a stiffer result. Before investigating this feature in more detail it isappropriate to note that the region of interest in thehysteresis loop (for the purposes of calculating tangentialstiffness, Fig. 13) has very small relative displacements (i.e.6-7 um, only about 3 pixels size). Uncertainties in thedisplacement measurements therefore have a significant Fig. 13 Variation of relative displacement with tangential loadshortly after load reversal for a Udimet 720 test. L111to L4correspond to distances between observation points on the specimenand pad [Fig 1(a)] effect and it is not an easy task to evaluate the tangential(shear) stiffness with a high degree of accuracy. It wasnoted in Section “Digital Image Correlation” that (in thecentre of the pad) displacement measurements should bealmost independent of position in the x-direction. However,variations of around 1 pm were noted in practice. This wastherefore taken as an indication of the uncertainty in themeasurement of displacement and can be taken into accountin the calculation of the tangential contact stiffness. Inpractice, of course, the process of averaging the displacementacross a number of pixels in the x-direction, reduces the actualuncertainty somewhat below this level. Fig. 14(a-c) showsthe variation of the calculated contact stiffness with thespacing of the reference points for each of the contact pairsexamined. As expected, the magnitude of the contactstiffness increases when the points become closer together(i.e. when they approach the interface). Error bars are shown,but it will be seen that the variation is reasonably smooth,suggesting that the measurement uncertainty is indeed lowerthan that assumed. For the Ti-6A1-4V ‘smooth ground’experiments, tan-gential contact stiffness (2Q/A) ranges between 700 and1650 kN/mm, depending on the reference points used andthe number of cycles completed.For the Ti-6A1-4V ‘roughground’ case, the stiffness varies between 800 and1750 kN/mm and for the Udimet 720 experiment it variesbetween 900 and 2150 kN/mm. In passing, we should notethat had the LVDT measurements been used, much loweryalues would have been obtained::7Ti-6A1-4V‘smoothground’: 50-65 kN/mm, Ti-6A1-4V ‘rough ground’50-70 kN/mm, and Udimet 720 smooth: 85-103 kN/mm. Comparison with Finite Element Predictions It is clear that the tangential (i.e. shear) stiffness resultsobtained by DIC are affected to some extent by bulkmaterial compliance between the two measurement points,as well as by the interface compliance itself (attributable tosurface roughness, oxide layers, wear debris etc.). However,it is not straightforward to determine the relative signifi-cance of these two compliances directly from the experi-mental results.Neither is it easy to say how the measuredvalues might differ if a different contact area were used. Toexplore these issues, a Finite Element (FE) model (seeFig. 15) of the Ti-6Al-4V pad-specimen experimentdescribed above was developed using ABAQUS software.The FE model contains no interfacial compliance; thereby,allowing us to isolate the tangential stiffness contributiondue to bulk deformation between the measurement points.Advantage was taken of symmetry in the test and only theright hand half of the arrangement was modelled using alinear elastic material behaviour (although stiffness results 0.5 1 1.5 Distance between measurement points (mm) Fig. 14 Variation of the tangential contact stiffness (2Q/A) obtainedfrom the relative tangential displacement at 1000 cycles for (a) Ti-6A1-4V‘smooth ground’, (b) Ti-6Al-4V ‘rough ground' and (C)Udimet 720 experiments quoted below are for the complete two-pad arrangement).As in the real test, the pad was held against the specimenwith an average normal contact pressure of 70 MPa over anominal contact area of 80 mm’ while the specimen was given a quasi-static vertical oscillation. The Lagrangemultiplier friction formulation was used [28] with a frictioncoefficient of 0.6, chosen for consistency with the exper-imentally measured value, Fig. 11. The tangential stiffnesswas determined when the contact was ‘fully stuck’after thepoint where the motion reverses. Results were derivedusing the relative tangential displacement of pairs of points/nodes situated at various distances (in the range 0-1 mm)from the interface: the points in each individual pair beingequidistant from the interface (on opposite sides) andsituated along the horizontal centre-line of the arrangement. The mesh [Fig. 15(b)] consisted of 2D plane strain linearquadrilateral elements (CPE4R), with a region of triangularelements (CPE3) situated outside the measurement zone onthe pad. Reduced integration was employed to avoid thequadrilateral elements inside the measurement zone beingtoo stiff in bending. Fig. 15 also shows the inclusion of acompliant interfacial elastic layer, which may be used torepresent additional compliance close to the contact surface.This high interfacial compliance is likely to be caused byfactors such as surface roughness and conformity, oxideformation or compacted wear debris. Sevostianov andKachanov [29] envisaged the contact of rough surfaces asproducing a mix of voids and contact regions, where, theexistence of these voids, as well as possible local slip at themicro contacts, would serve to reduce the interface shearstiffness. The compliant layer was used to tune the FEmodel to match the experimental results by changing theYoung’s modulus of the layer elements. However, initiallythe model was analysed as homogeneous bulk Ti-6A1-4V inthe absence of the compliant layer. The result of thisanalysis is shown in Fig. 16 where it is compared with anexperimentally determined DIC result (taken at 500 cycles).It is clear from Fig. 16 that the experimental tangentialstiffness is significantly lower than the FE stiffness and isless sensitive to the choice of measurement position. Thissuggests that the interface itself is much more compliantthan the bulk material and it is therefore necessary toincorporate this feature in the analysis. The thin compliant linear elastic layer was tthenincorporated on each of the bodies in the model to give atotal thickness of 0.1 mm. The layer thickness is chosen tocoincide with four layers of elements on each body(0.05 mm) in order to give a sufficiently refined represen-tation of strain variation. This choice is to some extentarbitrary, but it should be noted that the selected value is anorder of magnitude greater than the surface roughness, buttwo orders of magnitude smaller than the overall contact.The elastic modulus of these layers was then adjusted untilthe FE model agreed with the DIC results. It will beappreciated that the required modulus value will be afunction of the chosen layer thickness. The result of thisanalysis is shown in Fig. 17 where the tuned FE result is Fig. 15 Finite Element model of the Ti-6A1-4V experiment: (a) schematic and (b) FE mesh now seen to agree with the experimental results for the Ti6/4 ‘smooth-ground’case. For the layers shown in Fig. 15(a),the required modulus value was 2.29 GPa (compared with115 GPa for Ti-6Al-4V). The above analysis suggests thatwhen the tangential stiffness of a contact is measured (usingtwo points sufficiently close to the interface), the interfacecompliance dominates the measured result with the bulkcompliance contribution having relatively little effect. Thisis consistent with the findings of Berthoud and Baumberger[30] who reached a similar conclusion after performingstatic unidirectional tests on aluminium alloy (AG5) and Fig. 16 Comparison of experimental (DIC) and finite elementtangential stiffness results (without a compliant layer) for Ti-6Al-4V,‘smooth ground’ area of 40 mm² per pad (half that modelled above) wasanalysed. As expected, the resulting tangential stiffnesseswere almost exactly half of those measured for the 80 mm’contact area, i.e. the measured stiffness is dominated bycompliance at the interface. This feature suggests that anormalisation of the results presented can be achieved bydividing by the nominal contact area, i.e. where k is the measured contact stiffness, k’ isis thenormalised value, and Ag the apparent area of contact.Using this approach, normalised tangential stiffnesses forthe interfaces measured can be calculated from theexperimental results as follows: Ti-6A1-4V(smooth) 4.3 -10.3kN/mm’Ti-6A1 -4V(rough) 5.0-11.0kN/mm’Udimet 720(smooth) 5.7 - 13.5 kN/mm³ A value can also be obtained from the Young’s Modulus,E, of the interface layer in the model, since the shearmodulus, G, is given by where v is Poisson’s ratio. This gives, G=0.88 GPa, which,when taking account of the total layer thickness of 0.1 mmgives an equivalent normalised contact stiffness of k'=8.8 kN/mm’, which can be seen to be within the range ofthe experimental results for the Ti6/4 ‘smooth ground’case.Hence, it can be seen that the tangential compliance arisesalmost entirely from the response of the compliant layerrather than at the scale of the overall contact. Conclusions The paper has described an experimental technique ofmeasuring frictional hysteresis loops in contacts which arerepresentative (in terms of size, loading,and reciprocatingdisplacement) of those found in a number of engineeringcontexts (such as the dovetail roots of blades in gasturbines). It has been shown that measurements of frictioncoefficient obtained with a given pair of surfaces arereasonably reproducible and that the level of the frictionalforce generally increases as the contacts ‘bed in’. Anotherinteresting feature in the contacts investigated is thatinitially the frictional force is approximately constantduring the sliding phase of the motion, consistent with theCoulomb description of friction. However, after a fewhundred cycles of loading, each of the three contact pairstested developed a response which gave an increase in force during each sliding phase, terminating in a significant peak,just before the applied motion was reversed. This is thoughtto be associated with an interaction of wear scars on the twosurfaces, but further investigation of this feature is currentlybeing undertaken. Remote measurement of displacement was undertakenusing an LVDT, but this was shown to be inadequate for thepurpose of calculating tangential contact stiffness during thepartial slip phase of response. Since this quantity is importantfor models of joint behaviour under vibration, a method ofmeasuring displacement local to the contact was developedusing digital image correlation. This proved effective indetermining the relative displacement between the pad andspecimen and showed a linear variation with load in the initialpartial slip region of the hysteresis loop. From this, tangentialcontact stiffness could be evaluated using appropriate pairs ofreference points. It was found that the stiffness values were notparticularly sensitive to the choice of reference points in therange chosen (0.2 to 1.75 mm between the points). This resultwas surprising, in the light of predictions of elastic contactmechanics, which show a far greater variation of stiffness withposition (Fig. 16). A finite element model was thereforeconstructed for the contact, and a compliant surface layerincorporated to represent surface roughness and other surfaceeffects. By adjusting the compliance of this layer it provedpossible to obtain a good match to the experimental results.The results therefore suggest that contacts of this type areless stiff than might be assumed from a smooth contactassumption. More work is required to determine how thetangential stiffness varies with normal pressure, surfaceroughness, and other key variables. AcknowledgmentsThe authors would like to acknowledge thefinancial support of the Engineering and Physical Sciences ResearchCouncil in the UK (EPSRC) under grant reference EP/E058337/1,“APredictive Approach to Modelling Frictional Joint Performance(PAMFJP)”. They would also like to thank Rolls-Royce plc forsupporting the experimental programme by supplying specimenmaterial. Finally thanks are due to our collaborators at ImperialCollege: Dr. D Dini; Dr A. V. Olver; and Prof. D.J. Ewins for usefuldiscussion of the results presented here. References 1. Hills DA, Nowell D (1994) Mechanics of fretting fatigue. KluwerAcademic, Dordrecht 2. Dobromirski JM (1992) Variables of fretting process: are there 50of them? In: Helmi Attia M, Waterhouse RB (eds) Standardizationof fretting fatigue test methods and equipment, ASTM STP 1159.American Society of Testing and Materials, Philadelphia, pp 60-66 3. Amontons G (1699) De la resistance causee dans les machines.Memoires de lAcademie Royale A, 257-282 4. Coulomb CA (1785) Theorie des machines simples, en eyantegard au frottement de leurs parties et a la roideur des cordages.Memoires de Mathematique et de Physique de I’AcademieRoyale, 161-342 5. Cattaneo C(1938) Sul Contatto di due Corpi Elastici: Distrib-uzione Locale Degli Sforzi. Accademia dei Lincei, Rendiconti 27(6):342-348 6. Mindlin RD (1949) Compliance of elastic bodies in contact.ASME J Appl Mech 16:259-268 7. Johnson KL (1985) Contact mechanics. Cambridge UniversityPress, Cambridge 8. Mindlin RD (1951) Influence of rotatory inertia and shear onflexural motions of isotropic elastic plates. J Appl Mech 18:31-38 9..1 Petrov EP, Ewins DJ (2006) Effects of damping and varying contactarea at blade-disk joints in forced response analysis of bladed diskassemblies. Trans ASME: J Turbomachinery 128(2):403-410 10. Fridrici V, Fouvry S. Kapsa P, Perruchaut P (2005) Prediction ofcracking in Ti-6A1-4V alloy under fretting-wear: use of the SWTcriterion. Wear 259:300-308 11. Ding J, Bandak G, Leen SB, Williams EJ, Shipway PH (2009)Experimental characterization and numerical simulation of contactevolution effect on fretting crack nucleation for Ti-6Al-4V.TribolInt 42:1651-1662 12. Mohd Tobi AL, Ding J, Bandak G, Leen SB, Shipway PH (2009)A study on the interaction between fretting wear andcyclicplasticity for Ti-6A1-4V. Wear 267:270-282 13.E]veritt NM, Ding J, Bandak G, Shipway PH, Leen SB, WilliamsEJ (2009) Characterisation of fretting-induced wear debris for Ti-6A1-4V.Wear 267:283-291 14..I DingJ, McColl IR, Leen SB, Shipway PH(2007) A finite elementbased approach to simulating the effects of debris on fretting wear.Wear 263:481-491 15. Jin O, Mall S (2002) Influence of contact configuration on frettingfatigue behavior of Ti-6A1-4V under independent pad displace-ment condition. Int J Fatigue 24:1243-1253 16.. Filippi S, Akay A. Gola MM (2004) Measurement of tangentialcontact hysteresis during microslip. J Tribol126(3):482-489 17. Alicona IFM manual (2008) Alicona Imaging GmbH, Grambach,Austria 18. TiMetal 6-4 datasheet (2000) TMC-0150, Titanium MetalsCorporatiou, Hartford, CT, USA 19. Special Metals Corporation (2004) publication No. SMC-106,Special Metals Corporation, Huntington, WV, USA 20. Kim K, Korsunsky AM (2008) Exponential evolution law offretting wear damage in low-friction coatings for aerospacecomponents. Surf Coat Technol 202:5838-5846 21. Kim K (2006) Investigation of fretting wear and fretting fatigue ofcoated systems, D.Phil. Thesis, University of Oxford, UK 22. PixeLink: Data Sheet, Pixelink PL-B741U USB Mono Camera,Ottawa, Canada www.pixelink.com 23. Questar Corporation: Specification Sheet, Questar QM1 Long-Distance Microscope, New Hope, PA, USA. www.QuestarCorporation.com 24. Hild F, Roux S (2006) Digital image correlation: from displace-ment measurement to identification of elasticproperties-一areview. Strain 42(2):69-80 25. Strain Master Commercial Software, LaVision. (http://www.lavision.de/) 26. Stanislas M, Kompenhans J, Westerweel J (2000) Particle imagevelocimetry: progress towards industrial application. Kluwer,Dordrecht 27. Fincham AM, Spedding GR (1997) Low cost, high resolutionDPIV for measurement of turbulent fluid flow. Exp Fluids23:449-462 28. ABAQUS user’s manual v6.7 29. Sevostianov I, Kachanov M (2008) Contact of rough surfaces: asimple model for elasticity, conductivity and cross-propertyconnections. J Mech Phys Solid 56:1380-1400 30. Berthoud P, Baumberger T (1998) Shear stiffness of a solid-solidmulticontact interface. Proc Math Phys Eng Sci 454:1615-1634 ll content following this page was uploaded by Mehmet Emin Kartal on January M.E. Kartal·D.M. Mulvihill·D. Nowell (区)· D.A. HillsDepartment of Engineering Science, University of Oxford,Parks Road,Oxford OX PJ, UKSEM The paper describes experiments to investigatethe frictional properties of a Titanium alloy (Ti-6Al-4V)and a Nickel alloy (Udimet 720) under representativeengineering conditions. Flat fretting pads with roundedcorners were clamped against a flat specimen and a servohydraulictensile testing machine was used to apply cyclicdisplacement to the specimen. Slip displacement betweenthe specimen and pad was measured remotely using anLVDT and locally using digital image correlation. The latterapproach allowed accurate determination of the tangentialcontact stiffness from frictional hysteresis loops. The resultsobtained show that the contacts are significantly less stiffthan would be predicted by a smooth elastic contactanalysis. A finite element model of the experimentalcontact geometry was constructed and it was shown thatgood agreement with the experimental measurements ofcontact stiffness can be obtained with a suitable choice ofelastic modulus for a compliant surface layer.
关闭-
1/14

-
2/14
还剩12页未读,是否继续阅读?
继续免费阅读全文产品配置单
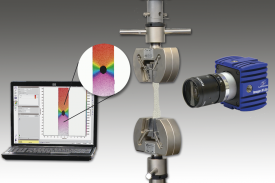
北京欧兰科技发展有限公司为您提供《钛镍合金中摩擦特性、应力应变检测方案(其它无损检测仪器/设备)》,该方案主要用于钛中可靠性能检测,参考标准《暂无》,《钛镍合金中摩擦特性、应力应变检测方案(其它无损检测仪器/设备)》用到的仪器有LaVision StrainMaster材料应变形变成像测量系统。
我要纠错