方案详情文
智能文字提取功能测试中
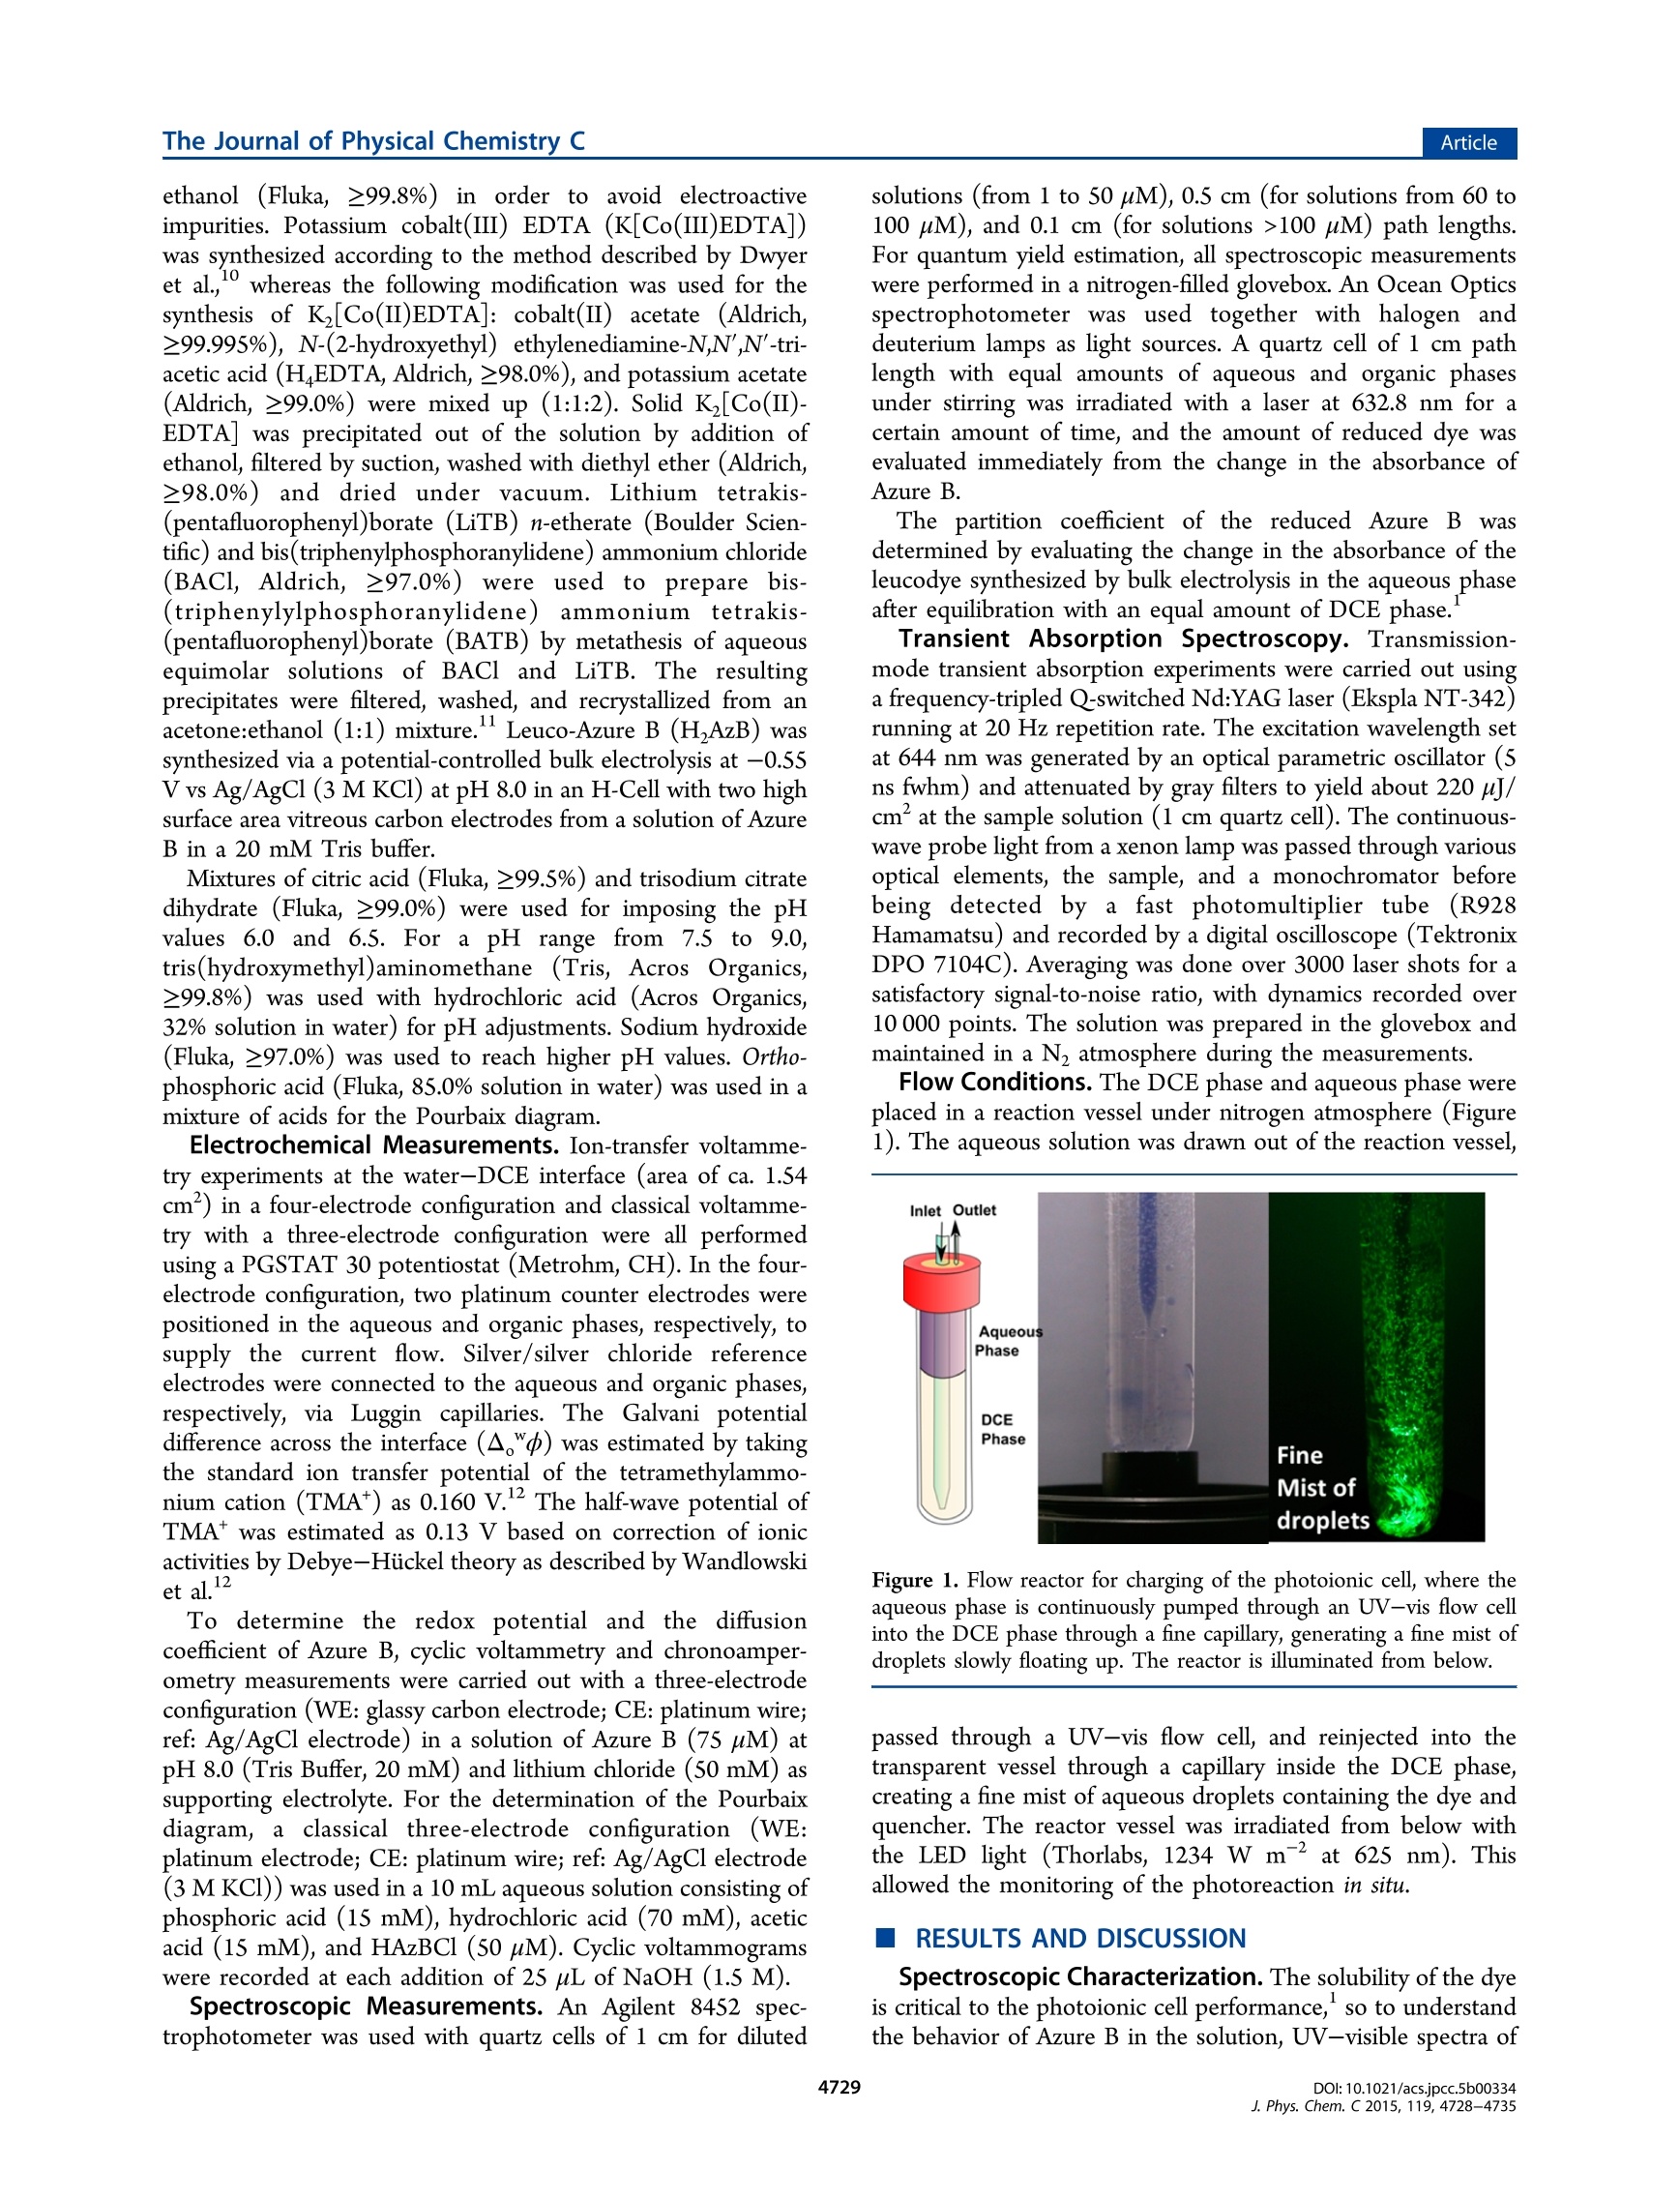
THE JOURNAL OFArticlePHYSICAL CHEMISTRYpubs.acs.org/JPCC The Journal of Physical Chemistry CArticle C- Chaotropic Agents Boosting the Performance of Photoionic Cells Romain Bourdon, Pekka Peljo, Manuel A. Méndez, Astrid J. Olaya, Jelissa De Jonghe-Risse,Heron Vrubel, and Hubert H. Girault* Laboratoire d'Electrochimie Physique et Analytique and*Groupe de Dynamique Photochimique, Ecole Polytechnique Federale deLausanne, CH-1015 Lausanne, Switzerland Supporting Information ABSTRACT: Photoionic cells are a simple and scalable concept for direct solar energystorage, where the redox fuels produced by the photoreaction are separated in differentphases to prevent recombination. The presence of chaotropic agents such as urea, thatbreak the structure of water, was found to drastically enhance the quantum yield; a 10-foldincrease of quantum yield to over 13% was achieved by addition of chaotropes into asystem based on the reductive quenching of Azure B by Co(II)EDTA in water and theextraction of the leuco dye in 1,2-dichloroethane. INTRODUCTION Solar energy conversion is one of the global challenges for asustainable economy. At present, two major routes are beingfollowed: photovoltaic (PV) systems to generate electricity andsolar thermal collectors to generate heat. However, all PVtechnologies must immediately distribute the producedelectricity either to a storage system or to the electrical grid,irrespective of demand. Recently, we have proposed a simpleand scalable concept for solar energy storage: photoionic cells.This is an extension of the early work of Rabinowitch et al.-sand Albery et al.-9 on photogalvanic cells (essentiallyphotochemical concentration cells), but in photoionic cellsthe charge separation takes place at the interface between twoimmiscible electrolyte solutions. The system is based on adye-quencher couple where, upon light excitation, the exciteddye (for example thionine) is quenched in the aqueous solutionby the quencher (e.g., [Co(II)EDTA]2-) to form both anoxidized quencher (e.g.,[Co(III)EDTA]) and reduced neutraldye (leucothionine) that partitions to the organic phase. Thetwo immiscible liquid phases are separated, and the redoxenergy is stored in the respective electrolyte solutions. Thesetwo solutions can then be electrochemically discharged in aflow cell to generate electricity on demand. The main potentialadvantage of photoionic cells over classical solar cells is theunique ability to convert solar energy directly into "redox fuels"that can be consumed only when electricity is required togenerate electricity to meet a specific demand. The original thionine-cobalt EDTA system has somedrawbacks, like low potential difference between the twophotogenerated redox couples and very low solubility ofthionine, which limits the quantum yield of the system. Anotherserious issue that has to be considered is dye aggregation, leading to significant loss of performance. In order to overcomesuch drawbacks, in this work we have explored Azure B(H,AzB) as an interesting alternative in the development ofsystems capable of capturing, converting, and storingsolarenergy in the form of reduced and oxidized photoproductsseparated by a polarized interface formed between twoimmiscible electrolyte solutions. We have systematically studied the effects of thephysicochemical and photophysical properties of a dye on thequantum yield, and we have optimized the reaction conditionsin the photoionic cells in order to maximize the quantum yieldof the reaction. More importantly, we have shown that byincreasing disorder in the solvent by introduction of chaotropicagents like urea (also known as structure breakers) thequantum yield was increased by an order of magnitude to13.1% for conversion of photons into photoproducts. EXPERIMENTAL SECTION Chemicals. All aqueous solutions were prepared withultrapure water (Millipore Milli-Q, specific resistivity 18.2MQ.cm). Azure B chloride (HAzBCl, prepared by directsynthesis))andtetrahexylammonium tetrafluoroborate(THxABF4,≥97.0%) were purchased from Aldrich. Tetrahex-ylammonium chloride (THxACl, ≥96.0%), tetramethylammo-nium chloride (TMACl, ≥98.0%), 1,2-dichloroethane (DCE,≥99.8%), anhydrous lithium chloride (≥99.0%), and urea(≥99.5%)6)were ordered from Fluka. They were used asreceived except urea, which was recrystallized from absolute ( Received: J anuary 1 2, 2015 ) ( Revised: F ebruary 1 0, 2015 ) ( P ublished: F ebruary 13,2015 ) ethanol (Fluka, ≥99.8%) in order to ;avoid electroactiveimpurities. Potassium cobalt(III) EDTA (K[Co(III)EDTA])was synthesized according to the method described by Dwyeret al., whereas the following modification was used for thesynthesis of K,[Co(II)EDTA]: cobalt(II) acetate (Aldrich,≥99.995%), N-(2-hydroxyethyl) ethylenediamine-N,N',N’-tri-acetic acid (HEDTA, Aldrich, 298.0%), and potassium acetate(Aldrich, ≥99.0%) were mixed up (1:1:2). Solid K,[Co(II)-EDTA] was precipitated out of the solution by addition ofethanol, filtered by suction, washed with diethyl ether (Aldrich,≥98.0%) and dried under vacuum. Lithium tetrakis-(pentafluorophenyl)borate (LiTB) n-etherate (Boulder Scien-tific) and bis(triphenylphosphoranylidene) ammonium chloride(BACl, Aldrich,≥97.0%) were usedtdoprepare bis-(triphenylylphosphoranylidene)ammonium tetrakis-(pentafluorophenyl)borate (BATB) by metathesis of aqueousequimolar solutions of BACl and LiTB. The resultingprecipitates were filtered, washed, and recrystallized from anacetone:ethanol (1:1) mixture.Leuco-Azure B (H,AzB) wassynthesized via a potential-controlled bulk electrolysis at -0.55V vs Ag/AgCl (3 M KCl) at pH 8.0 in an H-Cell with two highsurface area vitreous carbon electrodes from a solution of AzureB in a 20 mM Tris buffer. Mixtures of citric acid (Fluka, ≥99.5%) and trisodium citratedihydrate (Fluka, ≥99.0%) were used for imposing the pHvalues 6.0 and 6.5. For a pH range from 7.5 to 9.0,tris(hydroxymethyl)aminomethane (Tris, Acros Organics,≥99.8%) was used with hydrochloric acid (Acros Organics,32% solution in water) for pH adjustments. Sodium hydroxide(Fluka, ≥97.0%) was used to reach higher pH values. Ortho-phosphoric acid (Fluka, 85.0% solution in water) was used in amixture of acids for the Pourbaix diagram. Electrochemical Measurements. Ion-transfer voltamme-try experiments at the water-DCE interface (area of ca. 1.54cm) in a four-electrode configuration and classical voltamme-try with a three-electrode configuration were all performedusing a PGSTAT 30 potentiostat (Metrohm, CH). In the four-electrode configuration, two platinum counter electrodes werepositioned in the aqueous and organic phases, respectively, tosupply the current flow. Silver/silver chloride referenceelectrodes were connected to the aqueous and organic phases,respectively, via Luggin capillaries. The Galvani potentialdifference across the interface (A。") was estimated by takingthe standard ion transfer potential of the tetramethylammo-nium cation (TMA*) as 0.160 V. The half-wave potential ofTMA+ was estimated as 0.13 V based on correction of ionicactivities by Debye-Hiickel theory as described by Wandlowskiet al.12 To determine the redox potential and the diffusioncoefficient of Azure B, cyclic voltammetry and chronoamper-ometry measurements were carried out with a three-electrodeconfiguration (WE: glassy carbon electrode; CE: platinum wire;ref: Ag/AgCl electrode) in a solution of Azure B (75 uM) atpH 8.0 (Tris Buffer, 20 mM) and lithium chloride (50mM) assupporting electrolyte. For the determination of the Pourbaixdiagram, a classical three-electrodee configuration (WE:platinum electrode; CE: platinum wire; ref: Ag/AgCl electrode(3 M KCl)) was used in a 10 mL aqueous solution consisting ofphosphoric acid (15 mM), hydrochloric acid (70 mM), aceticacid (15 mM), and HAzBCl (50 uM). Cyclic voltammogramswere recorded at each addition of 25 uL of NaOH (1.5 M). Spectroscopic Measurements. An Agilent 8452 spec-trophotometer was used with quartz cells of 1 cm for diluted solutions (from 1 to 50 pM), 0.5 cm (for solutions from 60 to100 uM), and 0.1 cm (for solutions >100 uM) path lengths.For quantum yield estimation, all spectroscopic measurementswere performed in a nitrogen-filled glovebox. An Ocean Opticsspectrophotometer was used together with halogen anddeuterium lamps as light sources. A quartz cell of 1 cm pathlength with equal amounts of aqueous and organic phasesunder stirring was irradiated with a laser at 632.8 nm for acertain amount of time, and the amount of reduced dye wasevaluated immediately from the change in the absorbance ofAzure B. The partition coefficient of the reduced Azure B wasdetermined by evaluating the change in the absorbance of theleucodye synthesized by bulk electrolysis in the aqueous phaseafter equilibration with an equal amount of DCE phase. Transient Absorption Spectroscopy.Transmission-mode transient absorption experiments were carried out usinga frequency-tripled Q-switched Nd:YAG laser (Ekspla NT-342)running at 20 Hz repetition rate. The excitation wavelength setat 644 nm was generated by an optical parametric oscillator (5ns fwhm) and attenuated by gray filters to yield about 220 jJ/cm at the sample solution (1 cm quartz cell). The continuous-wave probe light from a xenon lamp was passed through variousoptical elements, the sample, and a monochromator beforebeing detected by a fast photomultiplier tube (R928Hamamatsu) and recorded by a digital oscilloscope (TektronixDPO 7104C). Averaging was done over 3000 laser shots for asatisfactory signal-to-noise ratio, with dynamics recorded over10 000 points. The solution was prepared in the glovebox andmaintained in a N atmosphere during the measurements. Flow Conditions. The DCE phase and aqueous phase wereplaced in a reaction vessel under nitrogen atmosphere (Figure1). The aqueous solution was drawn out of the reaction vessel, Figure 1. Flow reactor for charging of the photoionic cell, where theaqueous phase is continuously pumped through an UV-vis flow cellinto the DCE phase through a fine capillary, generating a fine mist ofdroplets slowly floating up. The reactor is illuminated from below. passed through a UV-vis flow cell, and reinjected into thetransparent vessel through a capillary inside the DCE phase,creating a fine mist of aqueous droplets containing the dye andquencher. The reactor vessel was irradiated from below withthe LED light (Thorlabs, 1234 Wm- at 625 nm). Thisallowed the monitoring of the photoreaction in situ. RESULTS AND DISCUSSION Spectroscopic Characterization. The solubility of the dyeis critical to the photoionic cell performance, so to understandthe behavior of Azure B in the solution, UV-visible spectra of HAzB* were acquired at various concentrations (Figure 2). Theabsorbance at 646 nm (1.92 eV) attributed to monomeric Figure 2. Molar extinction coefficient for HAzB* obtained (a) in theabsence of urea at concentrations of 10 (green), 15, 20, 25, 30, 40, 60,80, 100, 200, 300, 400,500, 600, 700, and 800 uM (red) in water and(b) in the presence of8 M urea at concentrations of HAzB* of 5(green), 10, 15, 20,25,30,40, 50, 60, 80, 100, 200, 300, 400, and 500uM (red). Insets: fittings of the absorbance values at 646 nm (a) and651 nm (b) as a function of [HAzBt]. Arrow shows the effect ofincreasing concentration. Azure B shows a linear region in the concentration rangebetween 0 and ca. 5o uM. Beyond this concentration,dimerization of HAzB is expected to occur (eq 1). As mentioned above, in an ideal photoionic cell, it is highlydesirable to have large amounts of dye dissolved in the aqueousenvironment. Nonetheless, the data presented in Figure 2clearly show that aggregation becomes significant at concen-trations above 0.2 mM, as the extinction coefficient decreases asa function of concentration and the maximum of absorptionshifts to blue, below 600 nm. It is well-known that aggregation of molecules is affected bythe presence of chaotropic or chalcotropic agents.Chaotropicagents like ureal4,15 can be used to enhance the solubility of thedyes and decrease the degree of aggregation. In order to clarifythe effect that these aggregates could have on the overallabsorption, urea was added to the reaction medium. Thedimerization constant was calculated for both the presence and absence of 8 M urea (see Supporting Information (SI) forfurther details), revealing that Kp under these conditions fallsby 1 order of magnitude from 27 ×10 to 3.3×10M. Thelatter translates into a significant reduction of aggregates suchthat even at concentrations as high as 0.8 mM 72% of the dye ispresent in its monomeric form (see SI). Similar behavior hasbeen previously reported for thionine, Azure A, and methyleneblue. Additionally, the addition of 8 M urea increases therelative permittivity of the solvent from 78.5 to 96.6 andchanges the structure of water. The maximum of absorbance ofAzure B is also shifted from 646 to 651 nm; similar behaviorhas been observed before for methylene blue. To understand how to maximize the system performance, wehave to understand the photophysical and physicochemicalbehavior of the chromophore. The reaction cycle is shown inScheme 1. The dye is first excited to the singlet state, followed Scheme 1. Sequence of Reactions Leading to thePhotosensitized Production of Co(EDTA) in Water andH,AzB in Organic Media (DCE) by fast intersystem crossing to the triplet state (lifetime in theorder of tens of microseconds, vide infra). The triplet state isquenched by Co(II)EDTA-, producing Semi-Azure B. Thephotoproduct undergoes fast disproportionation producingAzure B and neutral Leuco-Azure B that can be extractedinto the organic phase. Another critical parameter for the performance of thephotoionic cell is the excited-state lifetime. For this reason,transient absorption experiments were carried out at variousconcentrations of HAzBt, and the results are summarized inTablee 1. The recorded transient absorption spectra of thetriplet states (see SI) agreed well with the previously reportedspectra, but the obtained lifetimes were lower. Consistentwith previous studies,longer lifetimes (19 us at pH 8.0) wereobserved for a pH higher than the pK, of the triplet state, whichcorresponds to 7.2. At pH5 the lifetime decreased to 5 us(seeTable 1 and SI). Hence, protonation of the triplet state has adetrimental effect on the lifetime. According to Table 1, the excited-state lifetime of the dye issignificantly reducedl asthe concentration of aggregates increases (from 200 uM). The latter is not only consistent withthe reduced values obtained at [HAzB*]> 0.5 mM (seeFigure 4) but also provides a solid basis for the utilization ofchaotropic agents that avoid the formation of aggregates tomaximize the efficiency of the photosensitized reaction. Thus,in the presence of urea, even at [HAzB+] as high as 0.5 mM,lifetimes similar to those obtained at HAzB+]below 50 uM areobserved. A third important parameter for the photoionic cellperformance is the partition coefficient of the reduced dye.For HAzB, the partition coefficient between DCE and the pH8 aqueous phase was determined as 6.1. This value is slightlysmaller than the value determined for leucothionine with thesame method, 14.1. Electrochemical Characterization. A crucial parameter inthe performance of a photoionic cell is the driving force for theelectron transfer reaction. For this reason, the electrochemicalreduction of Azure B at various pH values was carried out.Cyclic voltammograms of HAzB*(Figure S1, SI) at differentpH values showed the presence of a reversible reduction waveat all pH values tested and corresponds to The number of electrons (2) involved on the reduction ofHAzB* was corroborated by means of exhaustive bulkelectrolysis. The diffusion coefficient of HAzB* was determined2as 4.4 ×10⁻⁶cm’s- from the scan rate dependency of thepeak current (see SI). Values of acidity constants for thedeprotonation of HAzB* and its 2e reduction product, HAzB,were estimated from the Pourbaix diagram shown in Figure 3.CV experiments carried out in the presence and in the absenceof urea yielded very similar trends, indicating that the acidityconstants in the presence of large amounts of the chaotropicagent are not significantly affected. Nonetheless, the voltammo-grams obtained in the presence of urea were preferred for thedetermination of the half wave potentials given that theformation of dimers was largely avoided and better definedvoltammetric signals were observed at all pH values (CVs areshown in the SI). The Pourbaix diagram tells what species is stable in therespective pH and potential. For reactions involving protons,potential for the reaction calculated from the Nernst equationdepends on the activity of protons (when activities of otherspecies stay constant), i.e., pH, by -a × 0.0592 V/n × pH,where a is the number of protons and n is the number ofelectrons involved in the reaction.The blue line in the Pourbaixdiagram represents the equilibrium HAzB*+ 2e +2H*→H,AzBt. As this reaction includes two protons and two Figure 3. Pourbaix diagram obtained for HAzB* based on E valuesobtained from cyclic voltammograms of a 50 uM aqueous solution ofHAzB* containing 70 mM HCl, 15 mM CH,COOH, and 15 mMH PO4. Progressive pH changes were obtained by consecutiveadditions of 25 uL of NaOH 1.5 M. electrons, the theoretical slope is 59 mV. For the red line thereaction 2 includes one proton and two electrons, gnf -?iving atheoretical slope of -29.5 mV. For the green part, theequilibrium is between AzB + 2e +2H*→H,AzB, so thetheoretical slope is again -59 mV. The experimental slopes of-80 mV (blue line) and -45 mV (green line) differ slightlyfrom the theoretical slope of -59 mV, but the red line has aslope of -31 mV, very close to the expected slope of -30 mV.The differences in the low and high pH can be due to partialdye aggregation or also slight decomposition at high pH. For the separation of the reaction products in the photoioniccell, the reduced dye has to be neutral to allow its partition intothe organic phase. On the basis of the experimental dataobtained from the electrochemical Pourbaix diagram in Figure3,Leuco-Azure B HAzB has apK at pH 4.8 and Azure B apKat 11.5, so this pH range for Azure B goes from ca. 5 to 12. It is also important to know the standard ion transferpotential for the transfer of HAzB* ions to be able to controlthe partition of the cationic species. The ion transfervoltammetry of HAzB* is shown in the SI, and the standardion transfer potential was determined as -0.19 V on theGalvani potential scale. The summary of the behavior of AzureB is presented in Scheme 2. Quantum Yield Determination. The information aboutthe photophysical and physicochemical properties of the AzureB allows us to estimate the optimum conditions for thephotoreaction. To allow the extraction of the neutral product,the pH has to be >4.8. To maximize the excited-state lifetimes,optimum pH has to also be above the pK of the triplet state.Additionally, the presence of urea minimizes the aggregation,leading to a better system performance. Hence, the predictedoptimum conditions are reached at pH 8 in the presence ofurea. As one of the reaction steps is the disproportionation ofthe photoproduct, Semi-Azure B, sufficiently high concen-tration of HAzB*is also required. Determination of the quantum yields (D) for the separationof photoproducts was carried out as described in theexperimental section. The expression describing the quantumyield is 2 × moles of H,AzB produced *This work. Ref 19. Value for methylene blue at pH 7.2, ref 20. Ref21. The red arrow indicates the extraction of the neutral dye into theorganic phase. The factor 2 in the equation comes from the fact that twophotons are required to produce one molecule of HAzB. Theeffect of the pH of the aqueous solution on the quantum yieldis summarized in Figure 4a and shows the presence of amaximum quantum yield at pH 8. Lower values below pH 6 areattributed to a less efficient extraction of the reduced dye intothe organic phase. Figure 4. Quantum yields for the consumption of HAzB* in theaqueous phase at pH 8 (Tris/HCl buffer 20 mM) as a function of (a)pH and (b) concentration of HAzB* in the absence (orange) and inthe presence (cyan) of urea 8 M. The latter stems from the protonation of HAzB, inaccordance with the Pourbaix diagram presented in Figure 3.As the photoproduct is positively charged below pH S,extraction into the organic phase does not take place as well10as for the neutral product. On the contrary, the equilibriumconcentrations of HAzB* and HAzB* in both phases will bedictated by the Galvani potential across the water/DCEinterface. To ensure that all the HAzBt is available forhomogeneous reductive quenching by Co(EDTA) in theaqueous phase, the Galvani potential was fixed with a commonion, the tetrahexylammonium cation, in both phases. Under thepresent experimental conditions, the presence of equimolaramounts of THxA* in both phases fixes the potential across theinterface at -0.456 V, calculated as described previously, ,22close to the standard ion transfer potential of THxA* of -0.470 v.23 In consequence, hydrophobic cations like HAzB* andHAzB* present in the aqueous phase will be more likely toremain there than to transfer into DCE. Unfortunately, theprotonated Leuco-Azure B (HAzB*) present at pH below 5remains in the aqueous phase and is therefore more availablefor back-electron transfer reactions. The reason for the monotonic decrease in at pH valuesabove 8 is at the moment unclear but could be related to thedecreased stability of the Co-EDTA complex in alkalineconditions, showing a maximum at ca. pH 9, and EDTA has thefourth pK, at 10.3.24 To our knowledge, the behavior of Co-EDTA complexes in alkaline solutions has not been studied indetail. On the other hand, the dependence of D on the totalconcentration was explored at pH 8 in the absence and in thepresence of urea (Figure 2b). In the absence of the chaotropicagent, a steady increase in the quantum yield with theconcentration of HAzB* is observed, reaching a maximum atca. 0.5 mM, and is clearly due to an increased concentration ofthe triplet state HAzB*. A subsequent decrease in as theconcentration of the dye is further increased is mainly causedby a higher amount of aggregates in the reaction medium.Indeed, according to the Kp value previously determined in theabsence of urea, at concentrations above 0.4 mM, more than50% of the dye is present as aggregates. Aggregation inducessplitting of the excited-state levels, offering new pathways forexcited states to decay. This is reflected by a reduced lifetime ofthe triplet state as mentioned previously (Table 1)) andtherefore inhibits the quenching by Co(II)EDTA. Aggregationof Azure B could also prevent the encounter with Co(II)EDTAfor steric reasons. Confirmation of the negative effect ofaggregation on the efficiency of the reaction was obtained fromexperiments where urea was present in large concentrations(Figure 2b, cyan). As can be seen from these experiments,keeps on increasing above 0.5 mM and reaches a steady statevalue beyond 0.6 mM. The plateau observed in the presence of urea is due to theratio between HAzB* and [Co(II)EDTA]2-. Support for thishypothesis is obtained from additional experiments in whichthe concentration of the dye was increased to 3 mM and theconcentration of the quencher to 1.6 M and a significantlyhigher value of 13.1% was obtained. To the best of ourknowledge, this is the highest quantum yield reported for theseparation of photoproducts into two immiscible electrolytesolutions. It is also worth noting that the effects of lightscattering and dispersion from the cell and from the dropletsare not considered, so the true quantum yields are slightlyhigher. These experiments confirm the predictions made basedon photophysical and physicochemical properties of Azure B,highlighting the importance of a thorough characterization ofdye properties for development of better systems. Flow Conditions. A parameter that plays a major role inthe kinetics of the reaction is the interfacial area. For thisreason, all the quantum yield measurements were carried outunder vigorous stirring. Nonetheless, with the long-term goal ofinterfacing this type of system with a biphasic redox-flow cell,the rate of disappearance of the dye was determined under flowconditions, where the aqueous solution was continuouslyrecirculated in a closedsystem. As; described in theExperimental Section, the aqueous solution was drawn out ofthe reaction vessel, passed through a UV-vis flow cell, andreinjected into the transparent vessel through a capillary,creating a fine mist of aqueous droplets containing the dye andquencher. A typical spectral sequence and absorbance traces as a function of time are presented in Figure S, where a monotonicdecrease in the absorbance at 646 nm can be observed. A faster Figure 5. (a) UV-visible spectra acquired every 30 s uponillumination of fine mist of aqueous droplets containing 20 mMTris/HCl solution (pH=8, 15 mL), HAzB* 600 pM, [Co"EDTA]2-0.8 M, and THxA*Cl 20 mM. Droplets were produced by injectingthe aqueous phase at a rate of 4 mL/min through a capillaryinmmersed in DCE (25 mL) containing THxA*BF 20 mM.Absorbance values at 646 (black) and 597 (red) nm extracted fromspectral sequences are presented for experiments where [HAzB*] was100 (b), 300 (c), and 600(d) uM, with the slopes of the linear parts ofthe curves. rate of disappearance of dimers of HAzB* can be observed asdye concentration is increased to 300 uM. However, when thedye concentration was further increased to 600 uM, the rate ofdisappearance of HAzB*decreased again because of theunfavorable effects due to dye aggregation. The rate ofmonomer consumption decreased with increasing concen-tration due to the equilibration between dimers and monomers:as monomers were consumed in the photoreaction, dimersdissociated to form more monomers, decreasing the total rateof monomer consumption. Multiple attempts to carry out thereaction under flow conditions in the presence of urea were notsuccessful due to capillary clogging by urea crystals As can be observed in Figure S, photosensitized reactionscarried out under flow conditions present a linear decrease inthe absorbance over the entire range between 400 and 900 nm.At the same time, this decrease in absorbance is accompaniedby the appearance and progressive increase in absorbance of apeak at 270 nm attributed to HAzB in the aqueous phase.Monitoring of the absorbance as a function of time at themaxima of absorption for the monomeric (646 nm) and thedimeric (597 nm) species showed an approximately lineardecrease in the absorbance of both species. Nonetheless, at 100uM (Figure Sb) the absorbance at 646 nm is always above thatat 597 nm because at this concentration the monomerpredominates over the dimeric species. On the contrary, inexperiments carried out at higher [HAzB*] values, e.g., 300(Figure Sc) and 600 (Figure 5d) pM, the absorbance due to thedimeric species is higher than that of the monomer. As thereaction proceeds, however, the absorbance of the monomericspecies becomes gradually more important as the totalconcentration of HAzB decreases due to the photochemicalreaction. This effect can be more easily observed in Figure Sc,where an inversion of the absorbance profiles takes place. These experimental observations also indicate that underconditions in which droplets of similar sizes are loaded withhigh concentrations of HAzB* the resulting increasedabsorbance does not translate into a faster consumption ofthe dye. On the contrary, the reaction rate is negativelyimpacted by an increase in [HAzB*] and further confirms thataggregation is not beneficial to the efficiency of the overallprocess. Numerical Simulations. With the aim of identifying thekey parameters that affect the efficiency of the reaction underflow conditions, a series of finite element simulations wereconducted with COMSOL Multiphysics 4.4. Previously, wehave shown that the triplet state lifetime of the oxidized dyeand the partition coefficient of the neutral reduced species werethe two maina parameters affecting the efficiency of thereaction. In experiments where a fine mist of droplets isproduced, however, the size of the droplet plays an importantrole, in particular in the convective regime produced at theinterior of the droplet. Thus, larger droplets will have a higherterminal velocity due to their larger volume compared tosmaller droplets.5 Empirical and analytical expressionsdescribed by Wallis were used to estimate the terminal velocityas a function of droplet radius, with the assumption that thedroplet remains spherical. The previously described model for photoionic cells wasextended to study the system where dye and quencher presentin a spherical droplet of aqueous phase rises through theorganic phase at the terminal velocity. The details of the modelare shown in the Supporting Information, and the flow velocityprofile for a 1 mm radius droplet showing the recirculationinside the droplet is shown in Figure 6. The influence of thedroplet size on the rate of reaction was quantified bydetermining the amount of time necessary to consume half ofthe total amount of oxidized dye in the aqueous droplet (Figure6). The simulations showed the presence ofa maximum half-life time at a droplet radius of ca. 300 um. Below this size, anapproximately linear increase in ti/2 is observed andisattributed to the longer distance that the neutral product ofthe photochemical reaction needs to travel in order to beextracted before recombination occurs. Such a monotonicincrease is disrupted beyond 300 um droplet size, showing adecrease in t. To rationalize the simulation results, the flowpatterns need to be considered for the different droplet sizes(see SI). Such analysis revealed that the flow pattern issignificantly affected at high terminal velocities (0.05-0.34 m/s), in the transition region between creeping to laminar flowconditions. Thus, at higher terminal velocities, the velocity atthe boundary of the aqueous droplet and surrounding organicphase increases the convection and hence the mass transportinside the droplet.As a result, the residence time for the neutralspecies produced is significantly shortened causing a netdecrease in t1/2. However, simulations especially at higherterminal velocities are oversimplifications due tothedeformations of the droplet. Additionally, surface active speciescan disrupt the recirculation in the droplet by forming astagnant cap at the bottom of the droplet, further complicatingthe mass transport. Nonetheless, in spite of these limitations, the simulationsshow that a small droplet size is desirable as small dropletsdisplay the fastest reaction times. Additionally, the losses due torecombination were found to be larger in larger droplets (see SIfor details). At the given simulation parameters, 10 um radiusdroplets displayed quantum yields of 45% (defined as amount Figure 6. Calculated half-life time of the oxidized dye in the aqueousphase as a function of the aqueous droplet radius. The simulated flowprofile is shown below for a 1 mm radius droplet in a flow of terminalvelocity of 0.34 m/s. of photoproducts divided by the number of absorbed photons),while a value of only 3.3% was observed for 300 um radiusdroplets. On the other hand, small droplets absorb only a smallpart of the incoming light, so a large number of droplets arerequired to utilize all the incoming light. In contrast, the effect of the excited-state lifetime to thephotoreaction performance was found to be minimal, due tothe fast mass transport (see SI). Practically no difference in thesimulations was observed with the excited-state lifetimes of 40,18, and 5 us. Decreasing the lifetime below 1 us had a smalleffect, but the performance of dyes with the excited-statelifetime of 0.5 us would still be satisfactory, allowing the use ofa larger class of dyes. The photophysical behavior of Azure B has been characterizedto optimize the photoreaction performance of photoionic cells.Transient absorption measurements show clearly that theprotonation has a detrimental effect on the lifetime of thetriplet state. The lifetime is also strongly decreased by theformation of dye aggregates.Nonetheless, this limitation can beovercome by the addition of chaotropic agents like urea, asdemonstrated by both UV-vis spectroscopy and transientabsorption experiments. The optimum conditions for the photoreaction could bepredicted based on the photophysical and physicochemicalproperties of the dye. Maximum quantum yield was observed atpH 8 in the presence of 8 M urea. The value of 13.1% wasobtained with a high concentration of quencher, while experiments with a flow system demonstrated the capabilityof photoionic cells for storing energy in different phases. Inparaller, numerical simulations predict that small droplets arepreferable in the photocharging stage and will lead to furtheroptimization of the photoionic cells concomitantly with theinvestigation of alternative dyes with solubilities of more than0.1 M and low aggregation constants. Additional focus is alsorequired to study the effect of the redox quencher. This paper highlights the importance of the characterizationof dyes, as optimization of conditions can lead to more thanone order of magnitude gains in the quantum yield. The resultsclearly show that addition of chaotropic agents like urea isessential to obtain reasonable performance, as the increaseddisordering of thee water structure significantly reducesaggregation of the chromophores, leading to improved systemperformance. ASSOCIATED CONTENT S Supporting Information Cyclic voltammetry and ion transfer voltammetry, transientabsorption results, theory for light absorption of monomers anddimers, finite element simulation model description, andresults. This material is available free of charge via the Internetat http://pubs.acs.org. AUTHOR INFORMATION Corresponding Author *E-mail: hubert.girault@epfl.ch Notes The authors declare no competing financial interest. ACKNOWLEDGMENTS The financial support from EPFL and Swiss Federal Office ofEnergy (SFOE) is gratefully acknowledged. REFERENCES (1) Mendez, M. A.; Peljo, P.; Scanlon, M. D.; Vrubel, H.; Girault, H.H. Photo-Ionic Cells: Two Solutions to Store Solar Energy andGenerate Electricity on Demand. J. Phys. Chem. C 2014,118, 16872-16883. (2) Rabinowitch, E. The Photogalvanic Effect Ii. The PhotogalvanicProperties of the Thionine-Iron System. J. Chem. Phys. 1940, 8, 560-S66. (3) Rabinowitch, E. The Photogalvanic Effect I. The PhotochemicalProperties of the Thionine-Iron System. J. Chem. Phys. 1940, 8, 551-559. (4) Mathai, K. G.; Rabinowitch, E. Studies of Thionine-Ferrous IronReaction Ina a Heterogeneous System. J. Phys. Chem. 1962, 66, 663-664. (5) Srinivasan, V.; Rabinowitch, E. Photochemical Reduction ofThionine by Cobalt (Ii) Edta Complex in Water-Ether Emulsion.J.ph,19mChem. Phys. 1970, 52, 1165-1168. (6) Albery, W. J.; Archer, M. D. Optimum Efficiency of Photo-galvanic Cells for Solar Energy Conversion. Nature 1977, 270, 399-402. (7) Albery, W. J.; Archer, M. D. Photogalvanic Cells: Part 3. TheMaximum Power Obtainable from a Thin Layer PhotogalvanicConcentration Cell with Identical Electrodes. J. Electroanal. Chem.1978, 86,1-18. (8) Albery, W. J.; Bartlett, P. N.; Foulds, A. W.; Souto-Bachiller, F. A.;Whiteside, R. Photogalvanic Cells. Part 14. The Synthesis andCharacterization of Disulphonated Thionines. J. Chem. Soc., PerkinTrans. 2 1981,794-800. (9) Albery, W. J. Development of Photogalvanic Cells for SolarEnergy Conservation. Acc. Chem. Res. 1982, 15, 142-148. (10) Dwyer, F. P.; Gyarfas, E. C.; Mellor, D. P. The Resolution andRacemization of Potassium Ethylenediaminetetra-Acetatocobaltate-(Iii). J. Phys. Chem. 1955, 59, 296-297. ( ( 11) Fermin, D . J.; D ung Duong, H.; Ding, Z.; Br e vet, P. F.; Girault,H. H . Photoinduced El e ctron Transfer at Liquid/Liquid InterfacesPart Ii. A Study of the Electron Transfer and Recombination Dynamicsby I ntensity Modulated P h otocurrent S p ectroscopy (Imps). Ph y s.Chem. C hem. Phys. 1999, 1,1461-1467. ) ( (12) Wandlowski, T.; Marecek, V.; Samec, Z. Gal v ani Potential Scales for Water-Nitrobenzene and W a ter-1,2-Dichloroethane I n t erfaces. Electrochim. Acta 1990, 35, 1173-1175. ) ( (13) M oelbert, S .; Normand, B .; De Los Rios, P. Kosmotropes and Chaotropes: Modelling Pr e ferential Exclusion, Binding and AggregateStability . Biophys. Chem . 2004, 112, 4S-S7. ) ( (14) M ukerjee, P.; G hosh, A. K. The Effect o f U r ea on MethyleneBlue, Its Self-Association, and Interaction with P olyelectrolytes in Aqueous Solution. J. Phys . Chem. 1963,67, 193-197. ) ( (15) H amlin, J. D.; Phillips, D . A. S . ; W h iting, A. Uv / VisibleSpectroscopic Studies of the Effects of Common Salt and Urea Upon R eactive Dye S olutions. Dyes Pigm. 1999, 41, 137-142. ) ( (16) G hanadzadeh Gilani, A.; Ghorbanpour, T.; Salmanpour, M.Additive Effect on the Dimer Formation of Thiazine Dyes . J. Mol. Liq. 2013, 177,273-282. ) ( (17) W yman, J. D ielectric Constants: Ethanol-Diethyl Ether andUrea-Water So l utions between 0 a n d 50°.J. Am. Chem. Soc . 1933, SS, 4116-4121. ) ( (18) Patil, K .; P awar, R .; Talap, P. Self-Aggregation o f MethyleneBlue in Aqueous Medium and Aqueous Solutions of Bu4nbr and Urea. Phys. Chem. Chem. P hys. 2000, 2, 4313-4317. ) ( (19) Havelcova, M .; K ubat, P .; Němcova, I. Photophysical Propertiesof T hiazine D yes in Aqueous So l ution and in Mi c elles. D y es Pigm. 1999, 44 , 49-54. ) ( (20) N emoto, M . ; K o kubun, H. ; Koizumi, M. Determination of S *-TTransition P robabilities of Some Xanthene and Th i azine Dyes on the Basis o f T-Energy Tr a nsfer. ii. R e sults in th e Aqueous Solu t ion. Bull.Chem. S oc. Jpn. 1969, 42 , 2464-2470. ) ( (21) M oreira, L . M.; L yon, J. P .; R omani, A. P . ; S everino, D .;Rodrigues, M. R.; de Oliveira, H . P . M. Phenotiazinium Dyes as P hotosensitizers (Ps) in P hotodynamic Therapy (Pdt): Spectroscopic :ns1 P roperties and Photochemical M echanisms. I n Advanced A s pects o fSpectroscopy; Farrukh, M. A., E d.; I nTech: R i jeka, Croatia, 2012; p p 393-422. ) ( (22)K a kiuchi, T. Partition Equilibrium of Ionic Components in T woImmiscible E l ectrolyte Solutions. In Liquid-Liquid Interfaces, Th e oryand M ethods; Volkov, A. G., D eamer, D. W., Ed s .; C R C Pre s s: Boca Raton, 1996; pp 1-18. ) ( (23) Olaya, A. J.; Mendez, M. A .; Cortes-Salazar, F.; G ira u lt, H. H.Voltammetric Determination of Extreme S t andard Gibbs Ion T r ansfer Energy.J. Electroanal. Chem. 2010, 644 , 60-66. ) ( (24) Z hou, W . ; Shao, Z. ; Ji n , W. Synthesis of N anocrystalline Conducting Composite Oxides Based o n a N o n-Ion Se l ectiveCombined Complexing Process for F u nctional Applications. J. Al l oysCompd. 2006, 426,368-374. ) ( (25) Wallis, G. B. The Terminal Speed of Single Drops or Bubbles in an I nfinite Medium. I n t. J. Multiphase Flow 1 974, 1, 4 91-511. ) ( (26) S adhal, S . S .; Johnson, R . E . Stokes F l ow Past Bu b bles and Drops Partially Coated w ith T hin F i lms. P a rt 1 . Stagnant C a p of Surfactant Film - Exact Solution. J. Fluid Mech. 1983, 126, 2 37-250. ) American Chemical SocietyDOI:acs.jpcc.b. Phys. Chem. C . Phys. Chem. C Photoionic cells are a simple and scalable concept for direct solar energystorage, where the redox fuels produced by the photoreaction are separated in differentphases to prevent recombination. The presence of chaotropic agents such as urea, thatbreak the structure of water, was found to drastically enhance the quantum yield; a 10-foldincrease of quantum yield to over 13% was achieved by addition of chaotropes into asystem based on the reductive quenching of Azure B by Co(II)EDTA in water and theextraction of the leuco dye in 1,2-dichloroethane.
关闭-
1/8
-
2/8
还剩6页未读,是否继续阅读?
继续免费阅读全文产品配置单
北京欧兰科技发展有限公司为您提供《离液剂,光伏电池中提高光伏电池性能方法检测方案(激光产品)》,该方案主要用于太阳能中提高光伏电池性能方法检测,参考标准《暂无》,《离液剂,光伏电池中提高光伏电池性能方法检测方案(激光产品)》用到的仪器有Ekspla NT340 高能量可调谐激光器(OPO)。
我要纠错


相关方案
 咨询
咨询