

方案详情文
智能文字提取功能测试中
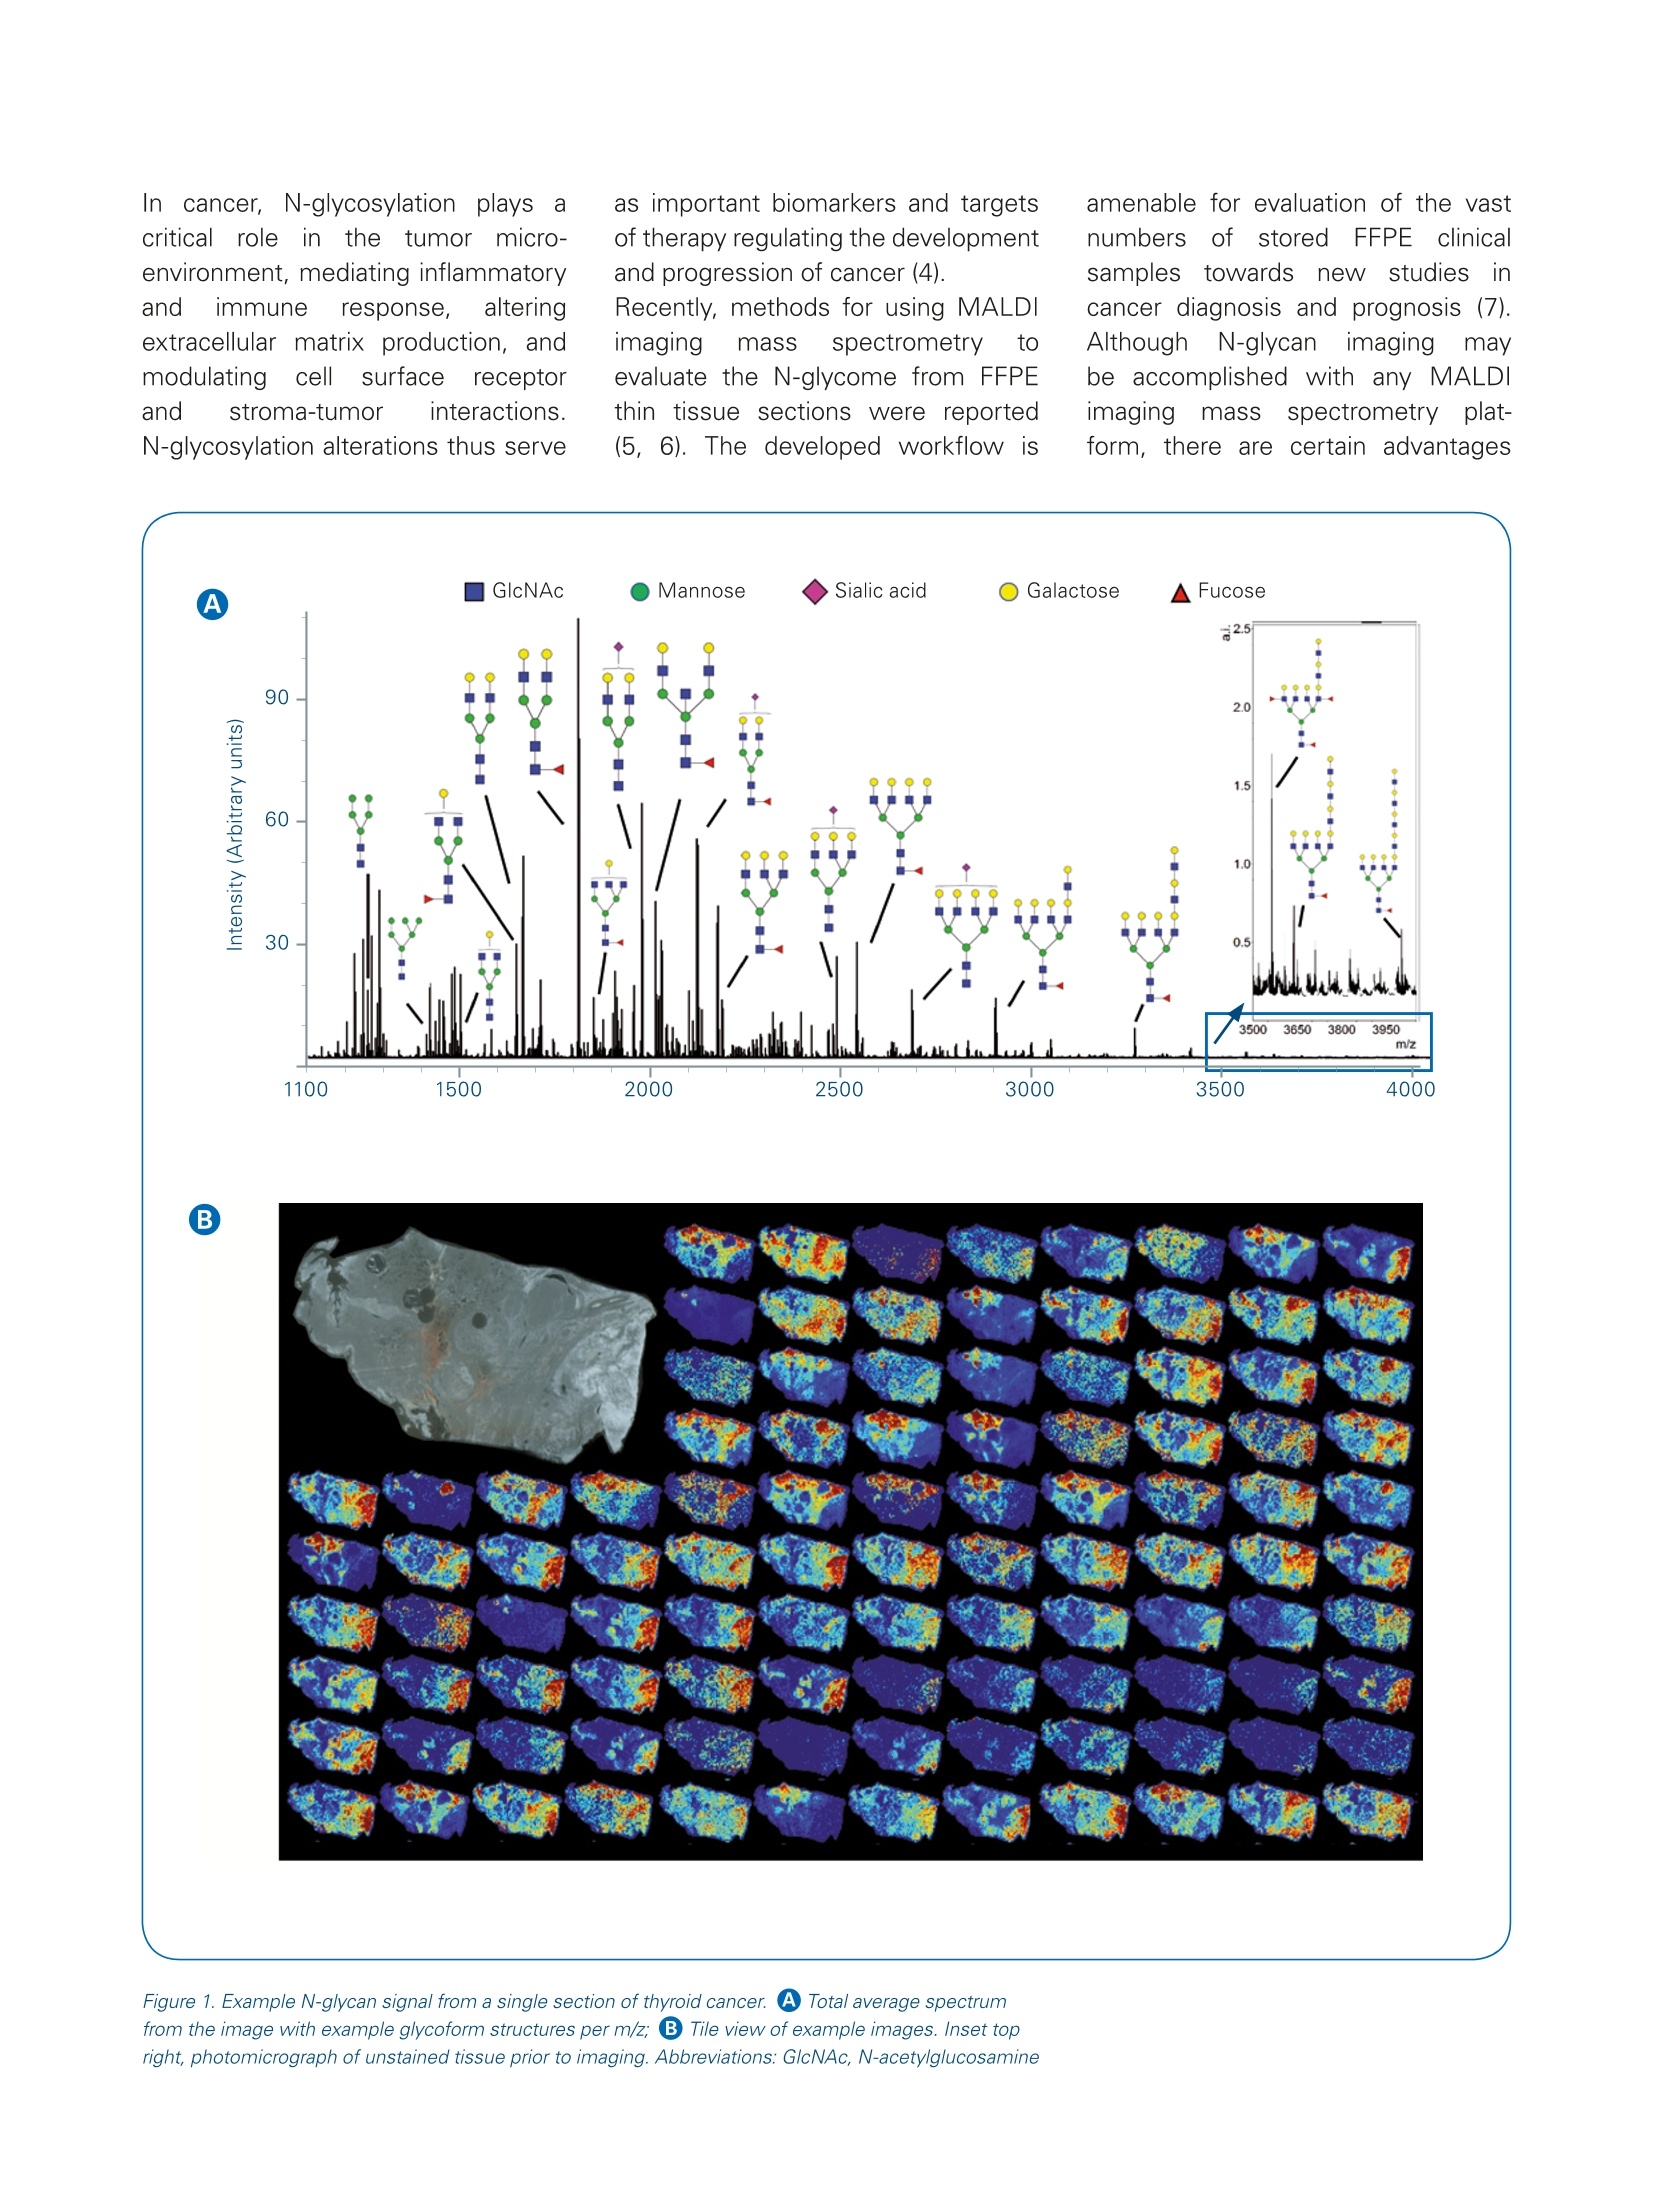
MALDI FTMS Imaging Mass Spectrometryof N-glycans as Tissue Biomarkers of Cancer In this application note,we describe preparation and imaging analysis of N-glycansfrom formalin-fixed paraffin embedded (FFPE) tissues using the solariX MALDI FTMS. N-glycosylation is a commonpos;tt translationalmodificationconsistingy ofa carbohydratemoiety attached to the consensussequence Asn-X-Ser/Thr, whereX may be any amino acid residueother than proline, and a fre-quent modification of membrane associatedproteins..N-glycansare synthesized and processedin the ER and Golgi through theactivity of over 300 enzymes thatattach or trim sugar residues,resulting in thousands of differentstructural combinations (1).The large structural diversity of N-glycans plays a role in finetuningy protein structure andfunction. Cellular activities thatdepend on N-glycosylationinclude protein folding, proteintargeting, regulation of proteaseactivity, cell migration and cell-cellrecognition (2, 3). In cancer, N-glycosylation plays acritical roleir theetumor rmicro-environment, mediating inflammatoryand immune response,, talteringextracellular matrix production, andmodulatingcell surfacee receptorand stroma-tumor interactions.N-glycosylation alterations thus serve as important biomarkers and targetsof therapy regulating the development and progression of cancer (4).Recently, methods for using MALDIimaging mass spectrometry toevaluate the N-glycome from FFPEthin tissue sections were reported(5, 6). The developed workflow is amenable for evaluation of the vastnumbers ofstoredFFFPE clinicalsamples ttoowwards newstudiesincancer diagnosis and prognosis (7).Although N-glycanimagingmaybe accomplished with any MALDIimaging rmass spectrometryplat-form, there are certain advantages Figure 1. Example N-glycan signal from a single section of thyroid cancer. Total average spectrum Figure 2. Image segmentation showing complexity of N-glycan signatures in a thyroid cancer tissuesection. , Pathologist marked H&E stain of section highlighting adjacent nontumor, anaplastic, andnecroticregions. BB SCiLS image segmentation of N-glycans from 2D mapping. White asterisks markcalculated overlaps of anaplastic and necrotic regions. to using the solariX MALDI FTMS.in this note., weediscusshighsensitivity mapping of the N-glycomeas detected from the complex tissueenvironment otfanFFPE thyroidcancer specimen. MethodsftornreleasingN-glycansfromnFFPE tissue have beerdescribedinndetail (5). Use ofde-identified气tissuespecimens tobe discarded was approved by anInstitutional Review Board. Briefly,a 5 um thick FFPE tissue section ofthyroid cancer was incubated for onehour at 60°C, dewaxed, and antigenretrieved under acidic conditions(10 mMcitraconic bbuffer, pH 3).A roboticcsprayer (TM-Sprayer,HTXImaging) was used to apply the enzyme and matrix in separate steps.First, recombinant PNGase F (MehtaLab, MedicalUniversity of SouthCarolina) was sprayed onto tissueat 0.1 pg/uL. The sample was thenincubated in a closed cell culture dishat 37°C under high humidity for twohours. Afterwards, a-cyano-4-hy-droxycinnamic aacid (CHCA)Vwassprayed onto tissue at 7 mg/mL in50% acetonitrile, 0.1% trifluoroaceticacid. MALDIiirmaging analysis wasperformedinpositiveionnmodeusing a 7 T solariX equipped witha dual ESI/MALDI ion source and aSmartbeam Il laser set to minimumfocus. A total of 200 laser shots werecollected at each pixel with a spacingoff150)umbetween eachpixel.lmages were collected in broadbandmode spanning m/z 500-5,000, with a transient length of 1.2 seconds,resulting in an on-tissue resolvingpower of approximately 85,000 atm/z 1,850.0.Flexlmaging softwareversion 4.1 was used to produce apeak list linked to 2D tissue maps.N-glycans were putatively identifiedbasedd on accurate mass within5 ppm using GlycoWorkbench 2.0.(8)The 2D data and peak lists wereuploaded to SCiLSLab software(2016b, Version 4.01.8705, BrukerDaltonics) for analysis betweenpathologist nmarked ttiumor andnontumor regions. For imagesegmentation,SCiLSparametersused were weak denoising, bisectingK-means, and the Manhattan metric.Altered N-glycans were filtered byWilcoxon rank sum hypothesis testingp value ≤1.0E-3 and area under thereceiver operating curve ≤0.8. Figure 3. Quantification of N-glycan signatures from regional areas on tissue. Statistical testing was donecomparing nontumor adjacent and anaplastic regions (ROC-1) or anaplastic versus necrotic (ROC-2). APhotomicrograph depicting areas selected for measuring relative abundance of N-glycan expression.BBAA high mannose (Man9) structure distinguishing nontumor adjacent compared to anaplastic tumor ornecrotic regions. (cA biantennary N-glycan defining necrotic regions with low expression in nontumoradjacent and anaplastic.DA tetrantennary fucosylated structure with low expression in adjacentnontumor and increasing expression in anaplastic and necrotic tissues regions. Results and Discussion In this work, we demonstrate N-glycanimaging analysis using a tissue sectioncontaining anaplastic thyroid cancer.Thyroid cancer is the most commonmalignancy of the endocrine system.Most thyroid cancers remain stableand indolent and patients have a goodoutcome when treated by surgicalresection or therapies directed atinhibiting growth promoting kinasesand angiogenesis (9). Anaplasticthyroid tumors are the least commonbut the most deadly form of thyroidcancer, and most patients die withina year. Prognosis is poor due to alack of effective therapies and newmolecular information is sought todevelop therapies that stop tumorprogression. The example tissue section of ananaplastic thyroid cancer was preparedusing our standard protocol for N-glycanreleaseandanalyzedbyMALDIFTMS using a7.0 TeslasolariX.Figure 1 shows total ion current andexamples of 2D N-glycans mappedacrosstheettissue. Detectionn○ofN-glycans is entirely dependent onthe activity of the applied PNGase F.Here.over 111 N-glycansweredetected as [M+Na]+ or [M-H+2Nal+,including high mannose, complex,hybrid, and sialylated structures. Itis important to note that sialic acidsare thermally labile and most MALDIsources result in loss of the sialic acidfrom the N-glycan. The solariX wasdesigned specifically to minimize lossof sialic acids using high pressurecollisional cooling gas (10). As a result,sialylated N-glycanSare detectedwith equivalent intensity to N-glycansthat do not contain this labile residue(Figure1A). Aaseconddadvantageusing the solarix is that the sourceis decoupled from the massmeasurement SO that tissuesmounted on standard microscopeslides may be analyzed with negligibleloss of massresolution or mass accuracy. Here. the combinedworkflow andimagingplatformyield high. sensitivity detection ofakbroad m/z range of N-glycans,spanning from small pentamannosestructures (Man5, m/z 1,257.4226) tofucosylated tetraantennary specieswith extended poly-N-acetyllac-tosamine (polyLacNAc) series(m/z4,000.4325).Overall, the N-glycanimaging workflow produces intenseand comprehensive N-glycansignaturesfrom FFPEtissue. lrIngeneral, we have observed that theanalysis of advanced tumors (like thisexample) have N-glycan signaturesthat allow mapping of \well over100 N-glycan species. expansion of anaplastic tumor regions(aqua). However, N-glycan signaturesmapping to the anaplastic regionextend intotheienecrotic regionswith some dispersion near adjacentnon-tumortissue.ThesedatahighlightthatatN-glycansignatures link todistinct tissue pathologies Tissue regions were selected fromthe pathologist marked regions toevaluate quantitative measurementof N-glycans (Figure 3). Regions wereselected from within the pathologistmarked areas for adjacent nontumor,necrotic,andanaplastic tumor.An example isshown of a highmannose structure (Man9) mappedto nonadjacent tissue areasswitha~ fourfold increase based on medianvalue compared to anaplastic tumorregions. Necrotic regions showedunique signatures apart from bothnonadjacent tumor and anaplastictumor, shown here with an examplebiantennary structure. Interestingly,N-glycans found in anaplastic tumorregions were frequently also found inpathologist marked necrotic regions(see also Figure 1 B). These examplesillustrate that N-glycan expressionisuniquely regulated withinthetumor micro-environment, and thesealterationsmaybedetected bythe solariX MALDI FTMS imagingplatform. ConclusionsThe N-glycan imagingworkflowreveals complexcarbohydrate interactions takingplacevwithinFFPE tumortissues. An important compo-nent of the imaging workflowas illustrated here is the use ofthe solariX. The cooled sourceenables capturing biologicallyimportanttbutlabileiecarbo-hydrate moieties, sialic acidsthatvwouldotherwise belost in MALDI ;analysis. Highsensitivity allowssdetectionover a wide range of N-glycanstructures.AAnalysis offthissingle piece of tissue sectionhighlights themanyyuniqueN-glycosylation changes thatcan occur in anaplastic thyroidcancer. This workflow providesavaluablettool that allowsdeeper investigations into themolecular causes of diseaseand can beapplied to anyFFPE tissue. Authors: Peggi M. Angel, Anand S. Mehta, Richard R. Drake.Dept. of Cell and Molecular Pharmacology & Experimental Therapeutics, Medical University of South Carolina, Charleston, SC right, photomicrograph of unstained tissue prior to imaging. Abbreviations: GlcNAc, N-acetylglucosamine 生物标志物(Biomarker)是指可以标记系统、器官、组织、细胞及亚细胞结构或功能改变或可能发生改变的生化指标,其具有非常广泛的用途,目前生物标志物可用于疾病诊断、判断疾病分期或用来评价新药或新疗法在目标人群中的安全性及有效性。生物标志物能反映正常生理过程或病理过程或对治疗干预的药物反应,在早期诊断、疾病预防、药物靶点确定、药物反应以及其他方面发挥作用,寻找和发现有价值的生物标记物已经成为目前研究的一个重要热点。基于分子癌症生物标志物的研究至少有如下3种重要用途, 即预测癌症的发生和疾病的早期检测; 提供治疗上的指导, 以及帮助确认药物研制的新靶点。癌症生物标志物的出现可能预示着一个时代的到来, 在这个时代医生将不再安排建立在种群统计基础上的治疗选择, 而是更正确地根据病人个体及其肿瘤的特性进行治疗选择。本方案提供了一个在分子水平,使用HTX基质喷雾仪进行组织样品前处理,然后用超高分辨质谱成像方法研究癌变组织中的标志物分布,该方法可以推广到其它任何FFPE癌变组织。Figure 1. Example N-glycan signal from a single section of thyroid cancer. A Total average spectrum from the image with example glycoform structures per m/z; B Tile view of example images. Inset top right, photomicrograph of unstained tissue prior to imaging. Abbreviations: GlcNAc, N-acetylglucosamine.Figure 2. Image segmentation showing complexity of N-glycan signatures in a thyroid cancer tissuesection. A Pathologist marked H&E stain of section highlighting adjacent nontumor, anaplastic, and necrotic regions. B SCiLS image segmentation of N-glycans from 2D mapping. White asterisks markcalculated overlaps of anaplastic and necrotic regions.Figure 3. Quantification of N-glycan signatures from regional areas on tissue. Statistical testing was donecomparing nontumor adjacent and anaplastic regions (ROC-1) or anaplastic versus necrotic (ROC-2).A Photomicrograph depicting areas selected for measuring relative abundance of N-glycan expression.B A high mannose (Man9) structure distinguishing nontumor adjacent compared to anaplastic tumor ornecrotic regions. C A biantennary N-glycan defining necrotic regions with low expression in nontumoradjacent and anaplastic. D A tetrantennary fucosylated structure with low expression in adjacent nontumor and increasing expression in anaplastic and necrotic tissues regions.
关闭-
1/5
-
2/5
还剩3页未读,是否继续阅读?
继续免费阅读全文产品配置单
通用实验科技(中国)有限公司为您提供《FFPE癌变组织中相关癌变生物标志物的分析检测方案(样品前处理)》,该方案主要用于FFPE癌变组织中相关癌变生物标志物的分析检测,参考标准《暂无》,《FFPE癌变组织中相关癌变生物标志物的分析检测方案(样品前处理)》用到的仪器有null。
我要纠错
相关方案
 咨询
咨询