方案详情文
智能文字提取功能测试中
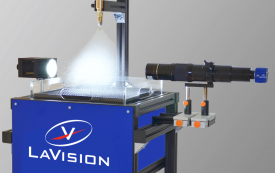
Estimation of droplet size and temperature at which solidification starts in a drop tube-impulse system P. Delshad Khatibi1, H. Henein1 1 Chemical and Materials Engineering Department, University of Alberta Edmonton, Alberta, T6G 2V4, Canada Abstract D2 tool steel powders were produced using a drop tube-impulse atomization technique. In order to measure the radiant energy and droplet size of atomized D2 steel droplets, DPV-2000 (Tecnar Automation Ltée, St. Hubert Quebec, Canada) was utilized. In-situ velocity and droplet size of the atomized droplets were also measured using shadowgraphy technique (Sizing Master Shadow from LaVision GmbH in Gottingen, Germany). A 3D translation stage was designed, constructed and installed inside the drop tube system. DPV-2000 and shadowgraph were then mounted on the translation stage. Using this stage, online measurements were conducted at 4 cm, 18 cm and 28 cm distances below the crucible. Using liquid (fully undercooled) and semi-solid behavior of droplets, it was possible to estimate the droplet size and temperature at which solidification starts. These values were then confirmed by the thermal model using experimentally estimated primary phase undercooling values. It was concluded that DPV-2000 is not accurate enough to detect the amount of recalescence during solidification of the droplets as they fall. But, comparing to the results from the heat loss model, reasonable estimates were obtained for different particle sizes solidifying at different distances using online measurement tools. Introduction It is known that solidification happens almost in all solid materials prior to their final use. Solidification is a phase transformation which has a great impact on mechanical and chemical properties of materials. Therefore, understanding different solidification conditions (i.e. undercooling or cooling rate) provide possibilities to better control the microstructure and morphology of materials. It was shown by Behulova et al. [Beh01] that different size of metal powders generated by rapid solidification has varieties of morphological characteristics. Prediction of undercooling temperature has been investigated using different models in single fluid and gas atomization system, as well as drop tubes [Pra09, Pra08, Zeo08]. It should be noted that the direct validation of these models for droplets with sub-millimeter size has not been feasible so far. Prasad et al. [Pra04] used microtomographic images of a particle in order to detect and measure the volume at which the initial nucleation and growth occurred. Nucleation and growth regions were also predicted from a microsegregation model incorporating different primary phase undercooling values. The results from modeling were then compared to that measured from the microtomographic images [Pra09, Pra08, Zeo08, Pra04]. Not many works have been done in order to investigate the thermal history of the falling droplets during atomization using in-situ measurements techniques [Cui05]. This paper reports an effort in order to investigate the thermal history of the droplets and their characteristics at which solidification starts. Two measuring instruments were used: a shadowgraph to measure droplet velocity and diameter and a DPV-2000 (a two color pyrometer) for droplet radiation measurements. DPV-2000 was used to measure effective radiant energy for different droplet sizes during atomization by Delshad Khatibi et al. [Del11]. The effective radiant energy of the particles can be measured using the DPV-2000 which is a high-speed two colors pyrometer. According to Planck’s radiation law, the total energy radiated by a spherical particle is expressed as: Eq. 1 where, C1= 3.74×10⁸ W.μm4/m2 and C2=1.4387×104 μm.K [Hol97]. T is temperature and ε(λi) is emissivity of the particle at λi, wavelength. In two color pyrometry technique, the energy radiated from a body is measured at two wavelengths. For a two color pyrometer, it is assumed that the emissivity is not a function of wavelength over the measured temperature range. Under these conditions, Eq. 1 would be re-written in the following form for the DVP-2000: Eq. 2 where Q(λi) is the quantity measured by the DPV-2000 and is proportional to E(λi) and, α(λi) is proportional to ε(λi) and d is the droplet diameter in μm. The DPV-2000 measured Q at two specific wavelengths initially set into the instrument. For these experiments, these wavelengths are λ1=0.787 μm and λ2=0.995 μm. A mathematical model was also employed to predict the temperature of falling D2 tool steel droplets at different heights [Del11]. Using this model, the droplet velocity and temperature as a function of time and distance traveled were calculated. Initial velocity of the droplets, forces of gravity and drag were incorporated in this model to find the subsequent trajectory of the droplets. Also, in order to determine the temperature of the droplets during free fall and the amount of latent heat generated during solidification, solidified fraction of the droplets was also considered using equilibrium calculations. However, the eutectic fraction at the end of the solidification as a result of microsegregation cannot be calculated using this model. It should be noted that for the objectives of this work, the thermal model was used in order to predict the thermal history of superheated and undercooled droplets in the liquid and semi-solid states. Experimental The D2 tool steel is a high carbon, high chromium ferrous alloy with 1.55% C, 11.8% Cr, 0.40% Mn, 0.80% Mo, and 0.80% V (all in wt.%). The corresponding pseudobinary phase diagram has liquidus and eutectic temperatures of 1394°C and 1270°C, respectively [Del12]. The alloy was melted using an induction furnace inside a drop-tube impulse atomization (IA) system. Using a vibrating plunger, molten D2 steel was pushed through the 37 orifices with the diameter of 300 µm on a nozzle plate at the bottom of the crucible to break up the liquid stream into droplets with different diameters. The droplets fell through a static nitrogen atmosphere (with ma maximum oxygen content of 8 ppm) solidifying during their free fall. To measure the effective radiant energy, DPV-2000 from Tecnar Automation Ltée was used, while the shadowgraph (Sizing Master Shadow from LaVision GmbH in Gottingen, Germany) was used to measure the velocity and droplet size of the droplets. These sensors were installed on a 3D translation stage inside the drop tube. Sizing master Shadow was using the shadowgraphy technique (backlighting) to visualize droplets for image analysis, using a pulsed laser as a light source. The pulsed laser combined with a diffuser optics can illuminate in-flight droplets 5 times per second. A high resolution imaging system captured the backlight of droplets inside the measurement volume of 666 mm3. Shadowgraph device is capable to detect droplets sizes ranging from 10 µm to 1000 µm with velocities from 0.01 to 10 cm/s. Droplet sizes less than 1000 µm can be detected by DPV-2000 with precision measurement of 7-15%. The droplet size, velocity and radiant energy of falling droplets were measured at different distances below the nozzle plate. In this study, the 3D translation stage was set at distances of 4, 18 and 28 cm below the nozzle plate, while DPV-2000 and shadowgraph devices continuously collected the information from the falling droplets. An imaginary vertical line passing through the center of the nozzle plate was considered and focal point of both DPV-2000 and shadowgraph was set to this line. This was done in order to reject any unfocused droplets by the criteria in the respective software of each instrument, set by the operator. Results and Discussion Predicting the temperature of droplets using thermal model The eutectic undercooling values for powder particles with different sizes were estimated using the eutectic area fraction measured by image analysis of the SEM images, which was described in another work [Del13]. Also, based on the methodology explained by Delshad Khatibi et al. [Del13], using the dendrite coarsening model [Kur98] and experimentally estimated eutectic undercooling values, the authors calculated the primary phase undercooling values of the falling droplets. Briefly, one can estimate the primary phase undercooling values and the nucleation temperature of the primary phase, by knowing the solidification temperature range, and the eutectic undercooling temperature. The primary undercooling values then can be used in the droplet thermal model in order to investigate the solidification and thermal trajectory of the falling droplets during online measurements study. Thermal history of different sized droplets at different distances below the molten metal crucible was predicted by the thermal model (Figure 1). This was done by incorporating the measured velocity of the droplets (by shadowgraph) and the experimentally estimated primary phase undercooling data into the thermal model. Droplet temperature as a function of particle size is shown in Figure 1. In this figure, the temperature of droplets with a given size is calculated for a given distance below the nozzle plate, e.g. 18 cm. The droplets are undercooled when the temperature of the droplets goes below the liquidus temperature. The values of undercooling used in the model are determined from the experimental data, described by authors in [Del13]. Solidification starts when the preset amount of undercooling in the model is achieved. It should be noted that only the thermal element of solidification is considered in the model. It can be seen in Figure 1 that droplets experience recalescence when the temperature rises right after primary phase nucleation. At each measuring height, it is possible to identify fully undercooled droplets using the plot in Figure 1. It was found that at 4 cm, 18 cm and 28 cm distances blow the nozzle plate, 206μm, 486μm and 604μm size droplets were fully undercooled, respectively. Solidification occurs at any droplet smaller than these droplets at each height and those droplets will be at the semi-solid state. Fully undercooled droplets (liquid) and semi-solid droplets will be further investigated using online measurement devices in this work. Online analysis of falling droplets As previously noted, velocity and diameter of the falling droplets were measured by shadowgraph. As the same time, radiant energy information of the droplet was collected by DPV-2000 at the same height. The signal counts of an individual droplet measured by DPV-2000 at two different wavelength (at 28 cm) are shown in Figure 2.a. The Q value, which is proportional to the radiant energy of droplets, is the area under the curves shown in Figure 2.a. It should be noted that Q is a dimensionless quantity. A power regression was fit to the scattered data collected by DPV-2000. The power curve fitted radiant energy at wavelength 1 (Q(λ1)) versus droplet diameter curve measured at λ1 at different heights is shown in Figure 2.b. It should be noted that this graph is for the fully liquid droplets, including those that are undercooled. Delshad Khatibi et al. [Del14] showed that radiant energy at wavelength 2 (Q(λ2)) versus droplet diameter curve measured at λ2 at different heights shows similar behavior as Q(λ1), therefore in the rest of the paper, analyses will only be shown for Q(λ1) results. Emissivity of a material is affected by factors such as temperature, size and wavelength [Hol97]. Temperature of the droplets is changing as they fall. Also, droplets with different size have different temperatures at a given distance (Figure 1). This makes Eq. 2 (Planck radiation law) more complicated since there will be more than one variable. Eq. 2 can be simplified by normalizing the effect of droplet size in the equation: Eq. 3 where Eq. 4 where C1, C2 and λi are constants in Eq. 3 and Eq. 4. Therefore, Q(λi)/d2 versus Ki can be plotted at different heights. According to Eq. 3 and Eq. 4, for a specific droplet size, the slope of the graph at different heights is related to α(λi). Q(λ1)/d2 versus K1 values for the D2 tool steel liquid droplets at different heights during free fall are shown in Figure 3. The K1 value for the melting temperature of D2 tool (1394°C) is also shown in this figure (indicated by a vertical dashed line). Any droplets experiencing primary phase undercooling are located at the left side of the dashed line, which means they are all in the liquid state. Each data point in the curves in Figure 3 represents a particle of a different size. The line joining the points representing the particle with the same size (at different height) and can demonstrate whether α(λ1) is constant or variable. In Figure 3, the points for droplets 614μm, 700μm and 800μm are joined at different distances below the nozzle plate. The Q(λ1)/d2 values at different heights (for the same droplet size) are connected by the solid lines in Figure 3. Delshad Khatibi et al. [Del14] showed that during falling of the droplets, emissivity is changing by size and temperature of the droplets. An advantage of plotting Q(λi)/d2 versus Ki is that direct effect of emissivity in the calculation can be reduced to only the slope of the plot and therefore, this will not be of any effect in the subsequent analysis of droplet temperature. Authors [Del14] also concluded that in the condition that DPV-2000 is used, grey body assumption (ε(λ1)=ε(λ2) at two close wavelength) is not valid. Thus, DPV-2000 should be considered as one color pyrometer for further analysis of the temperature history of droplets. Following the start of solidification, the temperature of the droplets increases as a result of generation of the latent heat of solidification. This is shown in Figure 1. Consequently, a discontinuous change in K1 values occurs in the Q(λ1)/d2 versus K1 plot. Q(λ1)/d2 versus K1 plot for semi-solid droplets at different heights is shown in Figure 4. It should be noted that the Q(λ1) values used in this plot are the experimental data that are averaged for each particle size range which lie inside the measurement accuracy of DPV-2000. The fraction of droplets solidified at different heights is also plotted in Figure 4. It can be observed that toward the lower temperatures (smaller K1 values), the fraction solidified is increasing. Droplet size and temperature at which solidification starts In order to monitor the behavior of droplets in the liquid (fully undercooled) and semi-solid state (before and after the start of solidification), it is possible to superimpose Figure 3 with Figure 4 as it is shown in Figure 5. It should be noted that in this figure, the error bars have been removed for the better presentation and to easily identify the average trend of the results. The error bars will be further discussed in the following section. The linear extension of the semi-solid data as well as its intersection with liquid data is also shown in Figure 5. At 18 cm and 28 cm distances below the nozzle plate, the intersection points correspond to 1386°C and 1376°C temperatures, respectively. It seems that the intersection points are attributed to be close to when recalescence ends. As a matter of fact, the finite solid fraction and temperature rise are related to the droplet size at which the solidification has just started, which corresponds to the end of recalescence. Consequently, the temperature at the intersection points can be equivalent to the maximum temperature that droplet achieves following recalescence. In order to confirm the values of droplet size and temperature at which solidification has just started (achieved from Figure 5), one can use these values in the thermal heat flow model (at 18cm and 28cm heights). The 485 μm and 605 μm droplets and their respective initial velocities were used in the thermal model and the height in which the solidification begins was determined by the model. It should be noted that the experimentally estimated primary phase undercooling values were used in the model. The model results showed that at 18.5 cm and 29.5 cm heights, solidification was starting for 485 μm and 605 μm droplets, respectively. This information shows that the results from DPV-2000 are within 0.5cm (or within 2%) and 1.5cm (or within 5%) of the model results for 485 μm droplet (at 18 cm) and 605 μm (at 28 cm), respectively. DPV-2000 precision DPV-2000 collects data from falling droplets depending on the several variables such as temperature, size, velocity and trajectory of the droplets. If any of these parameters do not meet DPV-2000 requirements (i.e. very slow droplets, not-vertically falling droplets, low temperature, etc.), DPV-2000 does not collect any information from the droplets or measures it with low precision. For example, only droplets with temperature between 1000°C to 4000°C can be detected by DPV-2000. Temperatures close to the detection limits would be measured by DPV-2000 but with low precision [Tec11]. These cause some errors attributed to DPV-2000 calculations (error bars in Figure 4 for semi-solid droplets). These errors can be attributed in part to instrument and measurement errors. On the other hand, nucleation is also a random phenomenon. Nucleation occurs spontaneously and randomly, and as has been shown earlier, primary phase nucleation requires undercooling of the liquid. A droplet is solidifying when nucleation requirements are met (i.e. chemical potential balance in the system) which are called solidification requirements. In order to collect the solidification information using DPV-2000, both instrument and measurement errors, and solidification requirements should take place simultaneously. Therefore, collecting information from a droplet (with the qualified properties for DPV-2000) at the precise time or position when it starts to solidify has a very low probability. Also, the time duration of recalescence from its start to its completion is much smaller than the measurement capability of DPV-2000. For example, using thermal model, for 450 μm droplet, the duration of recalescence was calculated to be about 10-5 s. Also, at 28cm height, the time of flight of the same size droplet through the two sensors in DPV-2000 is about 3×10⁻⁶s. Therefore, DPV-2000 cannot detect droplet’s recalescence during its free fall in front of DPV-2000. This further underscores that the temperatures shown in Figure 5 represent the droplet temperature following recalescence for the respective droplet sizes. Conclusions In the current paper, efforts were done in order to explore possibilities to investigate temperature behavior of falling droplets. This was done by using DPV-2000 and shadowgraph devices measuring radiant energy, velocity and size of droplets at different distances of falling. With the help of a thermal prediction model, a methodology was developed to correlate the radiant energy of droplets to the droplet size and temperature at which the recalescence has ended. Reasonable values were obtained comparing to the results from the heat loss model. It was also shown that droplet effective emissivities vary with material, size and temperature. It was concluded that collecting information from a droplet (with the qualified properties for DPV-2000) at the precise time or position when it starts to solidify is less probable. This suggests that DPV-2000 has limitation in order to detect droplet’s recalescence during its free fall in front of DPV-2000. Acknowledgments This research was supported by Canadian Space Agency (CSA) and Natural Sciences and Engineering Research Council of Canada (NSERC). References [Beh01] M. Behulova, R. Moravcik, M. Kusy, L. Caplovic, P. Grgac, L. Stancek, Influence of atomisation on solidification microstructures in the rapidly solidified powder of the Cr–Mo–V tool steel, Materials Science and Engineering: A. 304-306 (2001). [Cui05] C. Cui, U. Fritsching, A. Schulz, Q. Li, Mathematical modeling of spray forming process of tubular preforms, Acta Materialia. 53 (2005) 2775–2784. [Del11] P. Delshad Khatibi, A. Ilbagi, D. Beinker, H. Henein, In-situ characterization of droplets during free fall in the drop tube-impulse system, Journal of Physics: Conference Series. 327 (2011) 012014. [Del12] P. Delshad Khatibi, D.G. Ivey, H. Henein, Effect of rapid solidifiation and heat treatment on D2 tool steel, in: TMS 2012 Conf., Orlando, FL, United States, 2012. [Del13] P. Delshad Khatibi, H. Henein, A.B. Phillion, Microstructural Investigation of D2 Tool Steel during Rapid Solidification, Powder Metallurgy, Vol. 57 (2013) 70-78. [Del14] P. Delshad Khatibi, H. Henein, The robustness of the two-colour assumption in pyrometry of solidifying AISI D2 alloy droplets, Materials Science and Engineering Technology, 45, (2014) 736–743. [Hol97] J.P. Holman, Heat Transfer, 8th Editio, McGraw Hill Inc., 1997. [Kur98] W. Kurz, D.J. Fisher, Fundamentals of Solidification, Enfield Publishing & Distribution Company, 1998. [Pra04] A. Prasad, H. Henein, E. Maire, C. a. Gandin, X-ray tomography study of atomized Al-Cu droplets, Canadian Metallurgical Quarterly. 43 (2004) 273–282. [Pra08] A. Prasad, H. Henein, Droplet cooling in atomization sprays, Journal of Materials Science. 43 (2008) 5930–5941. [Pra09] A. Prasad, S. Mosbah, H. Henein, C.-A. Gandin, A Solidification Model for Atomization, ISIJ International. 49 (2009) 992–999. [Tec11] Tecnar Automation Ltée, DPV-2000 calculation principles, 2011 [Zeo08] S.K. N. Zeoli, S. Gu, Numerical modelling of metal droplet cooling and solidification, International Journal of Heat and Mass Transfer. 51 (2008) 4121–4131. Figures: Figure 1. Temperature of falling D2 steel droplets in heights calculated by the heat loss model. (a) (b) Figure 2. The signal counts measured at two different wavelengths for a single droplet and range of droplets at 28cm below the nozzle plate, (b) power curve fitted radiant energy vs. droplet diameter curve measured at λ1 at different heights for the droplets that are fully liquid, including those that are undercooled. Figure 3. Q(λ1)/d2 versus K1 graph at different heights for the D2 steel liquid droplets. Figure 4. Q(λ1)/d2 and fraction solidified versus K1 graphs at different heights for the semi-solid droplets. (a) (b) Figure 5. Q(λ1)/d2 versus K1 graphs at different heights for both liquid and semi-solid droplets at (a) 18cm and (b) 28cm heights. 1 D2 tool steel powders were produced using a drop tube-impulse atomization technique. In order to measure the radiant energy and droplet size of atomized D2 steel droplets, DPV-2000 (Tecnar Automation Ltée, St. Hubert Quebec, Canada) was utilized. In-situ velocity and droplet size of the atomized droplets were also measured using shadowgraphy technique (Sizing Master Shadow from LaVision GmbH in Gottingen, Germany). A 3D translation stage was designed, constructed and installed inside the drop tube system. DPV-2000 and shadowgraph were then mounted on the translation stage. Using this stage, online measurements were conducted at 4 cm, 18 cm and 28 cm distances below the crucible. Using liquid (fully undercooled) and semi-solid behavior of droplets, it was possible to estimate the droplet size and temperature at which solidification starts. These values were then confirmed by the thermal model using experimentally estimated primary phase undercooling values. It was concluded that DPV-2000 is not accurate enough to detect the amount of recalescence during solidification of the droplets as they fall. But, comparing to the results from the heat loss model, reasonable estimates were obtained for different particle sizes solidifying at different distances using online measurement tools.
关闭-
1/17
-
2/17
还剩15页未读,是否继续阅读?
继续免费阅读全文产品配置单

北京欧兰科技发展有限公司为您提供《液态金属中液滴粒径和温度检测方案(激光粒度仪)》,该方案主要用于其他中理化分析检测,参考标准《暂无》,《液态金属中液滴粒径和温度检测方案(激光粒度仪)》用到的仪器有LaVision ParticleMaster-Shadow 粒径测量系统、LaVision DaVis 智能成像软件平台。
我要纠错
推荐专场


相关方案
 咨询
咨询