方案详情文
智能文字提取功能测试中
LoughboroughUniversity Downloaded from SAE International by Loughborough University, Tuesday, November 22, 2016 ISSN 0148-7191http://papers.sae.org/2015-01-1039 Loughborough UniversityInstitutional Repository Optical investigation on theability of a cordieritesubstrate mising device tocombat deposits in SCRdosing systems This item was submitted to Loughborough University’s Institutional Repositoryby the/an author. Citation: LOCKYER, T.O. ...et al., 2015. Optical investigation on the abil-ity of a cordierite substrate mixing device to combat deposits in SCR dosingsystems. SAE Technical Papers 2015-01-1039,2015, doi:10.4271/2015-01-1039. Additional Information: ·Copyright C 2015 SAE International. This paper is posted on this sitewith permission from SAE International, and is for viewing only. Furtheruse or distribution of this paper is not permitted without permission fromSAE. Version: Published Publisher: C SAE International Please cite the published version. Optical Investigation on the Ability of a Cordierite Substrate Mixing Device to Combat Deposits in SCR Dosing Systems 2015-01-1039 Published 04/14/2015 Thomas Lockyer, Benjamin Reid, Graham Hargrave, Paul Gaynor, and Jonathan WilsonLoughborough University CITATION: Lockyer, T., Reid, B., Hargrave, G., Gaynor, P. et al.,"Optical Investigation on the Ability of a Cordierite SubstrateMixing Device to Combat Deposits in SCR Dosing Systems," SAE Technical Paper 2015-01-1039,2015, doi:10.4271/2015-01-1039. Copyright C 2015 SAE International Abstract Selective catalytic reduction (SCR) has become the mainstreamapproach for removing heavy-duty (HD) diesel engine NOxemissions. Highly efficient SCR systems are a key enablingtechnology allowing engines to be calibrated for very high NOxoutput with a resultant gain in fuel consumption while stillmaintaining NOx emissions compliance. One key to the successfulimplementation of high efficiency SCR at elevated engine out NOxlevels is the ability to introduce significantly more AdBlue into theexhaust flow while still ensuring complete ammonia production andavoiding the formation of deposits. This paper presents a body of experimental work conducted on anexhaust test bench using optical techniques including high-speedimaging and phase Doppler interferometry (PDI), applied underrepresentative exhaust conditions to a HD diesel engine after-treatment system with optical access inside the mixer tube. Two different sprays were used to dose AdBlue onto the mixingdevice. A three-hole injector and a single-hole pressure-swirl injectorwere characterised in ambient and heated exhaust flow conditions. Ametallic two-stage mixer and an uncoated cordierite ceramic substratemixer were compared and demonstrated the ability of the substratemixer to reduce deposit formation at higher dosing rates inside themixer tube when used with the correct spray type. High-speedimaging revealed the ability of the substrate to absorb injectedAdBlue spray at cooler exhaust temperatures. However, using theincorrect spray can lead to liquid saturation inside the substratechannels, which is detrimental due to the formation of deposits on therear face of the substrate. Introduction Selective catalytic reduction has become the established exhaustafter-treatment technology for combating the NOx emissions ofmodern heavy-duty diesel engines. Today's SCR systems are capableofachieving a cycle averaged NOx reduction efficiency up to 96 %[1] which enables full compliance with the most stringent current emissions legislation. These systems use a urea water solution,commercially known as AdBlue, to provide the ammonia required forthe SCR reaction into the exhaust stream. Many of these systemshave been optimised to operate in conjunction with engines using anEGR strategy of around 15-25 % to maintain typical engine out NOxvalues up to 3 g/kWh [2]. The continued push from regulators for HDdiesel engines to reduce fuel consumption and CO, emissions andrealising engines with brake thermal efficiencies nearing 50 % willrequire engine calibrations and a combustion strategy which generatehigh engine out NOx at levels of 8 to 12 g/kWh [3]. These engineswill require SCR systems capable of over 98 % NOx reductionefficiency and due to the increased NOx levels will requiresignificantly increased AdBlue injection rates into the exhaust flow inorder to provide enough ammonia for the SCR reactions, butultimately could deliver a fuel consumption improvement of nearly 3% compared to a 2010 baseline engine [1]. While there are several aspects key to a highly efficient SCR system,including catalyst formulations and control strategies, the ability togenerate and distribute the required ammonia from AdBlue is criticaland often presents a number of problems. AdBlue, a fluid consistingof 32.5%urea in purified water, is sprayed into the exhaust flowupstream of the SCR catalyst. The transfer of thermal energy from theexhaust stream into the spray evaporates the majority of the watercontent before thermally decomposing the remaining urea bythermolysis and hydrolysis resulting in the release of gaseousammonia. In many cases, mixing devices located downstream of theinjection point are used to provide a hot surface area for sprayimpingement and heat transfer into the spray, and to uniformlydistribute the spray and generated gases within the exhaust flow. Theformation of deposits inside the SCR mixer tube, generated fromundesirable reaction pathways during the thermal decomposition ofthe urea are a known and continual problem in SCR dosing systems.Deposit formation is a complex function of exhaust geometry, sprayand exhaust flow structures, exhaust gas and wall temperatures andchemistry. Despite a significant body of work published around thesesubject areas [4,5,6,7,8,9, 10, 11, 12], a complete understanding ofcontrolling and avoiding deposit formation is still not available. One practice implemented to mitigate against deposit formation is tocreate a deposit-limited dosing map for a specific SCR system [4].This map defines the maximum amount of AdBlue that can besprayed into the exhaust at a given exhaust flow rate and temperaturewithout forming deposits over a set period of time. Ultimately, thesemaps can put a limitation on the NOx conversion efficiency of anSCR system. If the engine NOx level requires more ammonia thanthe deposit map allows, which becomes very significant at highengine out NOx levels, then insufficient ammonia will be available toconduct the SCR reactions. Therefore, being able to make stepperformance increases to the dosing map is critical in realising thenext generation of ultra-high efficiency SCR systems. Scope ofthe Study The objective of this study was to experimentally assess the ability ofa high-surface area mixing device to prevent the formation of ureaderived deposits at high AdBlue dosing rates. This was achieved bymodifying an after-treatment system to provide full optical access tothe mixer and mixer tube. This paper describes the spraycharacteristics of two different AdBlue injection systems. Thee sprayswere then used to dose AdBlue onto a ceramic substrate mixingdevice while a combination of time-lapse photography and high-speed shadow imaging have been used to observe and quantify thespray-mixer interactions for each system under representative exhaustflow conditions. The amount of any deposits formed has beenevaluated and compared against a benchmark of a two-stage mixercommonly found in current SCR dosing systems. Experimental Setup Exhaust Flow Test Facility In order to gather the experimental data, two identical bespokeexhaust test beds were designed and built within the MechanicalEngineering department at Loughborough University.These test bedswere able to operate independently ofeach other and generate airflows representative of exhaust flows from a HD diesel engine. Aschematic of one of the test beds is shown in Figure 1. Figure 1. Schematic diagram ofexhaust test bench Each test bed comprised of a 30 kW air blower which supplied up to900 kg/hr of ambient air at a maximum pressure of1 bar(g). Air massflow rate was modulated by splitting the flow between the mainsupply and a bypass line controlled by butterfly valves and measuredby an in-line thermal mass flow meter (MFM). Each air supply wasfed through a 120 kW in-line electric heater capable of heating the airto a maximum temperature of 600 °C. Due to the risks associated with the operation of Class 4 lasers for theexperimental work, the test sections were contained inside a Class 1interlocked laser-safe cabinet. The heated air supply was fed in and outof the cabinet. An ammonia slip catalyst (ASC) was installeddownstream of the test sections to remove any ammonia generatedbefore discharging to atmosphere. Atmospheric air was usedthroughout the entirety of the testing rather than combustion products. Optical Test Section All experimental work described in this paper was conducted on aHD diesel engine after-treatment module in which the standard mixertube was replaced with an optical 97×97 mm square profile mixertube. The optical mixer tube was mounted immediately downstreamof a sharp 90° elbow and a two-stage mixing device, similar to thosein [8, 10, 14-16], was located at the inlet of the mixer tube. For someof the testing, the two-stage mixer was replaced by a 400 cells persquare inch (cpsi) ceramic substrate structure, acting as a high-surface area mixing device for the AdBlue spray to impact on. TheAdBlue injector was located on the outside the 90° elbow mountedsuch that the spray was discharged into the exhaust flow parallel tothe centreline of the mixer tube. The distance between the injectornozzle and the leading edges of the mixing device was approximately100 mm. A simplified representation of the injector and mixer flowpath is presented in Figure 2. A DPF located upstream of the testsection ensured a consistent flow profile into the mixing device. Figure 2. Schematic diagram of SCR injector and mixer location The optical mixer tube provided visual access to the trailing edge ofthe mixing device and the downstream region. The two flat windowsof the mixer tube were made of 5 mm thick quartz glass. A 3 mmthick flat quartz window was installed downstream of the mixer tubeon a 90° bend. This window allowed light to be introduced axiallydown the length of the mixer tube or for upstream images inside themixer tube to be acquired. All joining surfaces were sealed with hightemperature gaskets to prevent leakages. In this configuration, theoptical mixer tube was able to safely operate at exhaust gastemperatures in excess of 500 °C. Figure 3 shows the optical mixertube and downstream window. Figure 3. Optical square mixer tube and downstream window AdBlue Sprays This study focuses on the use of two different AdBlue dosingsystems, each with their own spray characteristics, and how theyinteract with mixers to influence deposit formation. Both injectionsystems were airless, single-fluid systems using pulse widthmodulation at a fixed frequency of 1 Hz to control and vary the rateof AdBlue injection. Both systems consisted of a pumping unitconnected via a pressurised line to a separate injection unit whichcontained a solenoid valve for injection activation. One systemfeatured a three-hole injector and operated at a system pressure of 9bar(a). The three orifices of the injector were arranged into anequilateral triangle and relied on the turbulent break-up of the AdBluestreams to promote spray atomisation. The second system employed asingle orifice pressure-swirl injector, running at an injection pressureof 10 bar(a) to produce its spray. Both systems could achieve a rangeof AdBlue dosing rates from 50 to 5000 g/hr. Spray Structures High-speed shadowgraphy images of the two sprays in ambientconditions (Figure 4 and Figure 5) highlight the differences betweentheir structures. The three-hole injector produced three distinct jets offluid with long breakup lengths. In comparison the pressure-swirlinjector generated a spray that atomised in a very short breakupdistance resulting in a solid cone spray structure with a much moreuniform distribution of spray across its cross-section. The atomisationof spray from both the injectors was seen to be consistent across theduration of each dosing event and unaffected by dosing rate. Figure 5.High-speed shadowgraphy images of spray breakup near nozzle inambient conditions The cone angle, the angle made by the intersection of the two outsideedges of the spray at the nozzle, was determined to be 28° for thethree-hole injector while the pressure-swirl injector generated a spraywith a wider cone angle of 40°. Figure 6 presents cross sectionsshowing the distributions of the two sprays captured with laser sheetimaging at a plane 100 mm downstream from the point of injection.The injectors were mounted on the outside of a 90° bend and injectedinto an airflow of 200 kg/hr at a temperature of 350 °C. Both spraystructures were insensitive to deflection from the cross flow over arange of exhaust flows. It can be seen that the pressure-swirl injectorgenerated a very distributed spray profile across the entire crosssection in comparison to the concentrated spots of spray from thethree-hole injector. Figure 6. Comparison ofspray cross-sections 100 mm from point of injectionin an exhaust flow of 200 kg/hr and temperature of 350 °℃ Spray Droplet Measurement Droplet diameters and velocities were measured throughout bothsprays in ambient conditions using an Artium Technologies PDI-200Phase Doppler Interferometer system. Figure7 displays thedistribution of droplet diameters across a plane 100 mm from thepoint of injection at an AdBlue dosing rate of 1000 g/hr for bothinjectors. Droplets up to 395 um in diameter were measured in thespray of the three-hole injector although the majority of the dropletsmeasured below 150 microns with a Sauter mean diameter (SMD) of95.5 um. The spray from the pressure-swirl injector was much finerwith an SMD of 33.5 um and no droplets greater than 100 ummeasured, with most of the droplets less than 50 microns in diameter. Figure 7. Histogram of droplet diameters measured across a plane 100 mmfrom point of injection. Dosing rate = 1000 g/hr Droplet velocities measured at the same 100 mm plane are shown inFigure 8. In both sprays, modal droplet velocities ranged between 6to 12 m/s. Droplet velocities up to 30 m/s were recorded for bothsprays, although the pressure-swirl spray had very few droplets withvelocities over 15 m/s. Figure9 and Figure 10 present the spread ofdroplet velocities and momentum respectively as a function ofdiameter for the two sprays. Figure 8. Histogram of droplet velocities measured across a plane 100 mmfrom point of injection. Dosing rate=1000 g/hr Figure 9. Droplet diameter vs velocity measured 100 mm from point ofinjection. Dosing rate=1000 g/hr For droplets measuring between 10 and 100 um, droplet momentumwas comparable between the two sprays, although the three-holeinjector produced droplets above 100 microns with increasedmomentum whereas the pressure-swirl spray contained a greaterquantity of sub 10 micron droplets with very low momentum. Figure 10. Droplet diameter vs momentum measured 100 mm from point ofinjection. Dosing rate= 1000 g/hr Imaging Techniques and Testing Methodology Throughout the testing, six steady-state exhaust flow conditions wereused; three temperatures and two mass flow rates, as listed in Table 1.These conditions represented typical exhaust flows of a HD dieselengine. Table 1. Exhaust operating conditions used during testing Exhaust Condition Exhaust Gas Temperature[℃] Exhaust Gas Mass Flow[kg/hr] EC1 250 250 EC2 250 750 EC3 350 250 EC4 350 750 EC5 450 250 EC6 450 750 At each exhaust condition testing was conducted across a range ofAdBlue dosing rates ranging from 500 to 2000 g/hr, substantiallyhigher than those operated at to achieve Tier 4 final levels of NOxreduction on current engines. However, at future engine out NOxlevels of 8-12 g/kWh, these higher dosing rates will be required togenerate enough ammonia for the SCR reactions. Two imaging techniques were used throughout this study in order togather experimental data on the interaction between the sprays andmixing devices. Deposit Time-Lapse Imaging Time-lapse photography was used to image the rear face of the mixerand downstream inside the mixer tube over a period of constantAdBlue dosing, allowing the formation and progression of anydeposits to be captured. A Nikon D800E DSLR camera fitted with a 60 mm macro lens was positioned to image upstream through thedownstream optical window (Figure 11). The camera was set with anISO of 800, a shutter speed of 1/20 s and at an aperture of f16. Thecamera was triggered remotely to capture an image every 4 secondsover a 10 minute dosing period resulting in a total of 151 images pertest condition. Illumination of the imaging region through the opticalmixer tube windows was provided by a 900 lumen LED light. Figure 11. Mixer tube deposit time-lapse imaging setup schematic At each steady-state exhaust condition, dosing was maintained at aconstant rate over the 10 minute period, with the mixer and mixertube initially free from deposits. After a test, any deposits presentwere either removed by increasing the exhaust temperature to 450℃until the deposits fully decomposed or by cooling the rig andmanually remove the deposits. In order to allow a quantitative comparison of the amount of depositsformed at different exhaust conditions, dosing rates and hardwareconfigurations, a subjective ranking was used to assign a value to thefinal image of each time-lapse series. The severity of any depositsobserved on the mixer and throughout the mixer tube was scoredbetween zero and five. A ranking of zero represented no depositsanywhere within the mixer tube while a ranking of five correlated to asignificant presence of deposits distributed throughout the mixer tube,with increasing integer values in-between correlating to an increasingpresence of deposits. High-Speed Imaging of Spray at the Mixer Outlet High-speed shadowgraphy imaging was conducted at the outlet of themixer to understand how the spray interacted with the mixer over theduration of an injection event. A LaVision Imager Pro HS4M 12-bitdigital high-speed CMOS camera fitted with a105mm lens waspositioned to image through the optical mixer tube focussed at thetrailing edge of the mixer. The camera was operated at a frame rate of2000 Hz at a resolution of 1440 ×1700 pixels. A LaVision high-speed laser diffuser placed on the opposite side of the mixer tubeprovided a uniform background illumination to generate theshadowgraphy images. The beam from a Litron LDY304 Nd:YLFhigh-speed pulsed laser, with a maximum energy output of 30 mJ perpulse at a rate of 2 kHz and pulse duration of 150 ns was mirroredinto the diffuser. The camera and laser were synchronised through aLaVision high speed controller. A schematic of the high-speedshadowgraphy arrangement is shown in Figure 12. At each testcondition, the mixer and mixer tube were initially free from anydeposits prior to AdBlue injection. High-speed imaging was typicallycaptured within the first 10 seconds of dosing Figure 12. Mixer high-speed imaging experimental setup schematic Results and Discussion . Two-Stage Mixer Baseline The original mixing device was based around a metallic two-stageplate mixer, optimised to work with the high-momentum spraygenerated by the three-hole injector. The plates of the mixer provideda hot surface on which the larger droplets produced by the three-holeinjector could impact upon and breakup into smaller droplets withincreased evaporation and decomposition rates. A significant amount of experimental testing was initially conductedusing the two-stage mixer with both sprays. A combination ofhigh-speed imaging at the trailing edge of the mixer and deposittime-lapse imaging at the back face revealed the formation of liquidfilms on the surfaces of the mixer as a result of spray impaction whendosing AdBlue at rates up to six times higher than those seen duringnormal operation. Previous studies have also experienced theformation of liquid films on the surfaces of two-stage plate mixers[Z]. The formation of liquid films had two consequences. The firstwas a direct formation of deposits on the mixer vane surfaces wherethe liquid films accumulated and occurred at all temperatures tested.The second was the stripping of the liquid films due to aerodynamicinteractions during which large droplets were ejected from the liquidfilm and impacted further downstream on surfaces of the mixer tubewhere they formed further deposits at exhaust temperatures below450 C. At low exhaust flow rates, once the liquid film had becomefully developed one or two droplets ranging from 1-5 mm in diameterwould be ejected per injection event. At high exhaust flow rates asmaller liquid film would eject many more droplets between 0.5 and2 mm in diameter at a high frequency. This mechanism of depositformation occurred with both injection systems, although the initialonset of the initial liquid filmed occurred at a higher dosing rate withthe pressure-swirl spray. Table 2 presents the deposit severity rankings at all six exhaustconditions for a range of dosing rates when the pressure-swirl injectorwas used with the original two-stage mixer. The values in bracketsindicate the score given at the same exhaust condition and dosing ratebut with the three-hole injector. With both injectors, the amount ofdeposits increased with an increase in dosing rate, and a reduction inboth exhaust gas temperature and mass flow rate. Table 2. Ranking of deposit severity based on time-lapse images withtwo-stage mixer and pressure-swirl injector DepositSeverityRanking AdBlue Dosing Rate [g/hr] ExhaustCondition 500 1000 1500 2000 EC1 2 (3) 5(5) No Data (5) No Data (-) EC2 0(2) 3(3) No Data (4) No Data (-) EC3 1(2) 1(4) 4(5) No Data (-) EC4 0(0) 0(1) 1(2) 2(3) EC5 0(0) 0(2) No Data (3) 1(4) EC6 0(0) 0 (0) No Data (1) 0(1) It can be seen from Table 2 that the pressure-swirl injector offered abenefit in reducing the amount of deposits when compared to thethree-hole injector at many of the conditions tested, with significantreductions at EC3 with a dosing rate of 1000 g/hr and at EC5 at adosing rate of 2000 g/hr. At these conditions significant amounts ofdeposits remained after 10 minutes of dosing with the three-holeinjector but switching to the pressure swirl reduced these deposits tonegligible amounts. At other exhaust conditions such as EC1 andEC2, the pressure-swirl injector reduced deposits at a dosing rate of500 g/hr but once the dosing rate was doubled to 1000 g/hr, theseverity of the deposits with both injectors were comparable. The improvement seen with the pressure-swirl injector was attributedto the wider spray angle, smaller SMD and more uniform distributionof spray which resulted in better utilisation of the available surfacearea of the two-stage mixer compared to the three-hole injector. Thetargeted jets of the three-hole injector and larger droplet size had theeffect oflocally cooling the impaction sites on the mixer. Thepressure-swirl spray reduced localised heat flux from spray impactionon the surfaces of the mixer and the subsequent formation of liquidfilms that was the starting point for deposit formation was alsoreduced. However, at higher dosing rates the fact that the depositseverity became insensitive to the spray type suggests that thecapacity of the mixer began limiting the capability of the system toextract thermal energy from the exhaust stream and transfer it into thespray mass to enable successful urea decomposition. A mixer with a much greater surface area should therefore be able tofurther reduce deposit formation at a given exhaust condition bybeing able to collect more heat from the exhaust flow throughincreased convection, and simultaneously impart more of that energyinto the AdBlue spray during impaction. High-Surface Area Substrate Mixer A 400 cpsi uncoated cordierite ceramic substrate, typically used inautomotive catalysts, was employed as a high-surface area mixingdevice. Each extruded square profile channel measured 1.15 mm ×1.15 mm. Figure 13 shows the front face of the substrate mixer alongwith an image of the channels when viewed through a microscope. Figure 13. 400 cpsi uncoated ceramic substrate used for a high-surface areamixing device An 80 mm long section of substrate was cut to shape and fitted insidethe optical mixer tube replacing the original metallic two-stage mixer.The total surface area of the substrate mixer channels wasapproximately 2500 % greater than that of the two-stage mixer. Substrate Mixer with Three-Hole Injector The substrate mixer was initially used in conjunction with thethree-hole injector to assess whether or not the increased surface areain comparison to the two-stage mixer would lead to a reduction indeposit formation. Deposit formation over a 10 minute period wascaptured with time-lapse photography and the severity ranked for allsix exhaust conditions at a range of AdBlue dosing rates from 250 to2000 g/hr. Exhaust Mass Flow Rate Figure 14. Time-lapse images of the substrate mixer and mixer tube after 10minutes of dosing AdBlue at rate of 500 g/hr with three-hole injector Time-lapse images captured observing the downstream face of thesubstrate mixer taken after dosing AdBlue at a rate of 500 g/hr over a10 minute period are shown in Figure 14 for all six exhaustconditions. The back of the substrate mixer and inside the mixer tuberemained free from deposits at four of the conditions. However, atEC3 and more noticeably at EC1, lighter spots were present on thedownstream face of the substrate. At EC1, three spots, eachapproximately 10 mm in diameter were formed. The spots indicatedthe presence of liquid AdBlue and that the channel had become fullysaturated with spray. At EC1, the first signs of saturation began afterapproximately 200 seconds of dosing and then continued to growover the remaining dosing period. The arrangement of the three spotscorresponded to the jets produced by the three-hole injector. At EC3,a very small spot could be identified towards the top of the substrateas some of the channels became saturated. Exhaust Mass Flow Rate a Figure 15. Time-lapse images of the substrate mixer and mixer tube after 10minutes of dosing AdBlue at rate of 1000 g/hr with three-hole injector Images shown in Figure 15 were taken at a dosing rate of 1000 g/hr.Doubling the dosing rate led to some level of saturation at allconditions with the exception of EC6. At EC1, the onset of saturationbegan after 1 minute. After 2 minutes, spitting emanating from thesaturated regions began leading to significant wall wetting on thedownstream surfaces of the mixer tube. The size of the saturationregions increased to approximately 20 mm in diameter after 5 minuteof dosing. At EC3, initial saturation could be seen after the first 80 sof dosing with spitting and wall wetting again occurring after 2minutes leaving a coating of white deposits distributed over the walls of the mixer tube. After 6 minutes, white rings started to form anddevelop around each saturation spot on the back of the mixer. Thesame white rings were also formed at EC2 and at EC4,5 and 6 athigher dosing rates. As seen with the formation of liquid films on the two-stage mixer,saturation of the substrate channels occurred the quickest and mostreadily at low exhaust temperatures, low mass flow rates and at highdosing rates. Also observed with the substrate mixer was a tendency for deposits toform on the rear imaging window downstream of the mixer tube,even when there was no evidence of channel saturation or depositformation on the substrate mixer, as displayed in Figure 16. Figure 16. Urea deposits on rear window at EC6 with no mixer or mixer tubedeposits after 10 minutes of dosing at 1000 g/hr Deposits in this location were not seen to form when the two-stagemixer was fitted. However, with the substrate mixer they occurred atall conditions tested with two exceptions; at EC1 with a dosing rateof 250 g/hr and at EC2 at a dosing rate of 500 g/hr. At both of theselow temperature (250°C) operating points, the substrate mixer didnot become saturated (Figure 17). Figure 17. No substrate saturation or rear window deposits after 10 minutes ofdosing at EC2, dosing rate=500 g/hr Two processes have been identified to explain the formation of thedeposits seen on the rear window due to the substrate mixer. Theextruded profile of the substrate mixer allowed a straight flow paththrough which the injected spray could pass unimpeded, with nomixer surface directly in the trajectory of the spray. The extrudedprofile also acted as a flow straightener creating a uniform flowprofile downstream of the mixer with very little cross-stream mixingthat allowed the droplets to continue until their momentum resulted inthem impacting on the downstream window. This could be seen tooccur from the time-lapse images and occurred at EC3, 4, 5 and 6 atall dosing rates and consistently over the 10 minute dosing period.This attribute of the substrate mixer was responsible for the depositsseen in Figure 16 where there was no mixer saturation or depositformation at the mixer. It should also be noted that no spray was seenpassing through the substrate mixer when the exhaust gas temperaturewas 250 °C at both flow rates (EC1 and EC2). The other process which led to the formation of deposits on the rearwindow only occurred once the channels of the substrate becamesaturated. Liquid films present on the downstream face of thesubstrate were stripped by the air flow discharging through nearbychannels and the droplets entrained in the flow eventually impactedon the rear window. Examples of this are shown in Figure 18 andFigure 19. The ejected droplets also impacted on the walls of themixer tube forming further deposits. Figure 18. Urea deposits on rear window due to substrate saturation after 10minutes of dosing at EC2, dosing rate=1500 g/hr Figure 19. Urea deposits on rear window due to substrate saturation after 10minutes of dosing at EC5, dosing rate=2000 g/hr The angled surfaces and vanes of the two-stage mixer presentedobstructions to the trajectory of the spray resulting in dropletimpingement and also created a strong mixing flow inside the mixingtube to disperse the droplets, both of which prevented the formationof deposits on the rear window. Deposit severity rankings aresummarised in Table 3 for all the conditions and dosing rates tested atwith the three-hole injector and substrate mixer. Correspondingvalues for the three-hole injector with the two-stage mixer are shownin brackets. Table 3. Ranking of deposit severity based on time-lapse images with 400 cpsisubstrate mixer and three-hole injector DepositSeverityRanking AdBlue Dosing Rate [g/hr] ExhaustCondition 500 1000 1500 2000 EC1 2(3) 5(5) No Data (5) No Data (-) EC2 1(2) 2(3) 4(4) No Data (-) EC3 1(2) 5(4) 5(5) No Data (-) EC4 1(0) 2(1) No Data (2) 5(3) EC5 1(0) 3(2) 5(3) No Data (4) EC6 1(0) 1(0) No Data (1) 4 (1) Compared to the two-stage mixer, the substrate mixer onlymarginally reduced deposits at EC1, 2, and 3 at dosing rate of 500 g/hr (and also at 1000 g/hr at EC2). At all other exhaust conditions and dosing rates, the same or an increased coverage of deposits occurredwhen using the substrate mixer. In some cases, such as at EC4,5, and6 at low dosing rates, this was due to the small amount of depositsformed on the rear window from direct spray impingement despite adeposit free mixer and mixer tube. In other cases saturation of thesubstrate and associated deposits were responsible for the higherdeposit severity rankings. Spray High-Speed Imaging at Substrate Outlet To further examine and assess the amount of spray droplets passingthrough the substrate mixer high-speed shadowgraphy imaging wasconducted at the outlet of the substrate mixer at all six exhaustconditions. At each condition, data was collected within the first 10seconds of dosing, before any potential channel saturation occurred.The images were then processed using LaVision DaVis software toquantify the amount of droplets over an injection event. The stepsused to process a series of spray images to extract a measure of spraydroplets is listed below. 11. Background removal by subtracting first image from allsubsequent images 2. Convert to binary image using fixed pixel intensity threshold.Binary image; spray=0, background=1 3 Define fixed pixel area within each image that spray passesthrough 4. Count all pixels inside defined area with intensity value =0(spray) 5. Plot pixel count against image number (time) Plots of all six exhaust conditions at a dosing rate of 500 g/hr and at1000 g/hr are presented in Figure 20 and Figure 21 respectively. Bothplots indicate at EC1 and EC2 (250C) that no droplets weredetected at both dosing rates across the full spray events. At all otherconditions some quantity of spray droplets were measured across theentirety of the spray event. At both dosing rates the most spraydownstream of the substrate mixer occurs at EC5 followed by EC6, both at 450°C. Less spray was detected at the two 350 °℃ conditions. Figure 20. Quantitative analysis of high-speed imaging of spray dischargingfrom substrate mixer with three-hole injector at a dosing rate = 500 g/hr This analysis indicates that at 250 °℃, the substrate mixer wascapturing all the injected droplets which promoted quick saturation ofthe channels. At hotter temperatures, the ability of the substrate to retain all the spray mass was reduced, therefore some of the dropletspassed through the mixer leaving less fluid to be captured requiringmore time or a higher dosing rate for any saturation to occur. Comparing Figure 20 and Figure 21 a decrease in the spray quantitydetected at EC3, EC4, EC5 and EC6 can be seen as dosing rate wasincreased. Figure 21. Quantitative analysis of high-speed imaging of spray dischargingfrom substrate mixer with three-hole injector at a dosing rate=1000 g/hr This trend of decreasing amount of spray discharged from thesubstrate mixer with an increase in dosing rate in highlighted inFigure 22 which shows plots of spray count at EC5 at dosing rates of500 g/hr, 1000 g/hr and 2000g/hr. Figure 22. Quantitative analysis of high-speed imaging of spray dischargingfrom substrate mixer with three-hole injector at EC5 at 3 dosing rates As dosing rate was increased, the surface temperature of the substratemixer decreased as more heat was transferred to the droplets. As seenin Figure 20 and Figure 21, lower temperatures resulted in less spraydischarged and the substrate mixer absorbing a greater percentage ofthe initial spray. Substrate Mixer with Pressure-Swirl Injector The substrate mixer with the three-hole injector did not demonstrate asignificant performance gain in being able to increase dosing rateswhile avoiding deposit formations compared to the two-stage mixer.This was in part due to liquid saturation of the channels of thesubstrate where the jets of the spray hit. The pressure-swirl mixer hadalready shown to reduce deposits on the two-stage mixer due to itsmore distributed and finer spray. Therefore, this spray should also bebetter suited to maximising the high-surface area of the substrate mixer and yield higher dosing rates without the presence of deposits.Time-lapse imaging of deposit formation and high-speed imaging ofthe spray were both repeated with the same substrate mixer and thepressure-swirl injector over the same range of high dosing rates. With the pressure-swirl injector, minimal localised saturation of thesubstrate only occurred at one condition; at EC1 with a dosing rate of1500 g/hr. At a dosing rate of 1000 g/hr at EC1 there was noindication of substrate saturation or deposits in the mixer tube. Incomparison with the three-hole injector, significant saturation andspitting occurred at this condition and with the two-stage mixersignificant deposits formed on the mixer and inside the mixer tubewith both injectors. However, as seen with the substrate mixer and three-hole injector,spray droplets consistently impacted on the rear imaging windowresulting in small deposits. This occurred continually across the 10minute dosing period at all conditions, even at exhaust temperaturesof 250 ℃which did not happen with the three-hole injector. Figure 23. Three-hole injector and pressure-swirl injector with substrate mixerafter 10 minutes dosing at a rate of 1000 g/hr at EC1, EC3 and EC5 Figure 23 compares images after 10 minutes of dosing at a rate of1000 g/hr with both injectors onto the substrate mixer at an exhaustflow rate of 250 kg/hr. At all three exhaust temperatures the substratemixer became saturated with the three-hole spray with deposits on thewalls of the mixer tube at 250 and 350°C and significant wetting onthe rear window at 450°C. At all three conditions some minor spray impaction on the rear window was evident with the pressure-swirlspray but no deposits on the substrate mixer or the walls of the mixertube occurred. Deposit severity rankings from the time-lapse images for thesubstrate mixer with the pressure-swirl injector are summarised inTable 4. Corresponding values for the pressure-swirl injector with themetallic two-stage mixer are shown in brackets. Table 4. Ranking of deposit severity based on time-lapse images with 400 cpsisubstrate mixer and pressure-swirl injector DepositSeverityRanking AdBlue Dosing Rate [g/hr] ExhaustCondition 500 1000 1500 2000 EC1 1(2) 1(5) 2(-) No Data (-) EC2 0(0) 1(3) 1(-) No Data (-) EC3 1(1) 1(1) No Data (4) 2(-) EC4 0 (0) 2(0) No Data (1) 3 (2) EC5 1(0) 1(0) No Data (-) 1(1) EC6 0(0) 1(0) No Data (-) 1(0) At an exhaust gas temperature of 250 °C deposit severity wassignificantly reduced by switching to the substrate mixer at bothexhaust flow rates (EC1 and EC2). A ranking value of one, indicatingnegligible amounts of deposits was applied in many cases due to asmall amount of spray impaction on the rear window. In some casessuch as EC3 and EC4 at a dosing rate of 2000 g/hr deposits on therear window were more prevalent resulting in a ranking of two orthree. Figure 24. Three-hole injector and pressure-swirl injector with substrate mixerafter 10 minutes dosing at a rate of 2000 g/hr at EC4 and EC6 A comparison of deposits with the two injectors at a dosing rate of2000 g/hr at an exhaust flow of 750 kg/hr is presented in Figure 24Again, with the three-hole injector saturation resulted in the formationof deposit rings on the back of the substrate and spitting onto the rearwindow. However, with the pressure-swirl injector, the substrateremained deposit free and direct spray impingement on the rearwindow was responsible for a small amount of deposit formation. Analysis of high-speed imaging to quantitatively evaluate the spraydischarging from the substrate mixer was carried out with thepressure-swirl spray. Figure 25 shows the spray measureddownstream of the substrate at an exhaust flow rate of250 kg/hr attemperatures of 250 ℃ (EC1),350℃ (EC3) and 450°℃ (EC5) at aconstant dosing rate of 1500 g/hr. As seen with the three-holeinjector, the amount of spray detected increased with an increase inexhaust gas temperature. Very small amounts of spray wereconsistently observed at 250 °C with the pressure-swirl injector, butwith the three-hole injector no droplets were detected at thistemperature. This might be due to the fact that the droplets of thepressure-swirl spray were smaller in diameter in comparison to thethree-hole spray. Over 60 % of the droplets in the pressure-swirlspray measured between less than 20 microns 100 mm from theinjection point. Therefore these droplets were more likely to beentrained in the flow passing through the channels of the mixer andhad a higher probability of avoiding contact with the channel wallsresulting in an increased likelihood of downstream spray. However,this minor amount of spray still resulted in the presence smalldeposits on the rear window. Figure 25. Quantitative analysis of high-speed imaging of spray dischargingfrom substrate mixer with pressure-swirl injector at a dosing rate=1500 g/hr The effect of increasing dosing rate on the amount of spray observed. downstream of the substrate at EC3 is shown in Figure 26. As seenwith the other injector, spray decreased with an increase in dosing rate. Figure 26. Quantitative analysis of high-speed imaging of spray dischargingfrom substrate mixer with pressure-swirl injector at EC3 at 3 dosing rates An optical investigation into the interactions between two differentAdBlue sprays and a high-surface area mixing device based on a 400cpsi ceramic cordierite substrate has been carried out on a hot exhaustflow test bench under exhaust flow rates and temperatures typical of aHD diesel engine. The sprays of two injectors have been studied andmeasured in both ambient conditions and a heated cross-flow todevelop a detailed understanding on their behaviours andcharacteristics. Imaging inside the mixer tube over a sustained period of dosing withthe two different injection systems has revealed the importance ofcorrectly coupling the characteristics of the injector spray and amixing device. The substrate mixer provided a very high-surface areathrough which heat could be extracted from the convecting exhaustflow and transferred into the impacting AdBlue spray. The pressure-swirl injector generated a spray with a cone angle which enabledgood coverage on the front ofthe substrate mixer. Within thissolid-cone of spray, droplets with diameters no greater than 100microns were well distributed and therefore the entire area of thesubstrate mixer was uniformly utilised by the spray. As a result, theformation of liquid films was generally avoided and depositformation minimised even at high dosing rates in comparison to thetwo-stage mixer. This injector and mixer partnership has beendemonstrated to raise the dosing limits without forming depositswhich should result in NOx conversion efficiency gains. However, the high-surface area mixer only delivered thisimprovement with the correct spray type. When using the three-holeinjector, which produced much larger droplets up to 395 microns insize, concentrated in three jets of fluid, the available surface area ofthe substrate mixer could not be exploited. Instead, the spray jetsresulted in liquid saturation of the channels. The saturation led to theformation of deposit rings on the rear face of the substrate at severalof the conditions tested along with spitting of urea in solution ontodownstream surfaces where deposits formed. In general, the substratemixer offered little to no improvement in reducing deposits comparedto the two-stage mixer when the three-hole injector was used, and insome cases actually performed worse. The extruded profile of the substrate mixer did present the problem ofallowing some of the injected spray to pass directly through thesubstrate resulting in the formation of small deposits at the site wherespray impaction occurred downstream. The amount of spray whichpassed through was related to gas, and therefore substrate wall,temperature. It was shown that at 250°C the substrate mixer was ableto absorb nearly all of the spray which could be advantageous tocontrolling deposit formation. However as temperature increased,either through a direct increase in exhaust temperature or indirectlythrough reduced cooling at lower dosing rates, the amount of spraywhich passed through the substrate mixer increased. References 1. Stanton, D., Charlton, S., and Vajapeyazula, P., “Diesel EngineTechnologies Enabling Powertrain Optimization to Meet U.S.Greenhouse Gas Emissions,”SAE Int. J. Engines 6(3):1757-1770,2013, doi:10.4271/2013-24-0094. 2. Ohrnberger, T., Becker, C., and Doehring, C.,“Assessment ofTier 4 Final Aftertreatment Strategies,”SAE Technical Paper2012-01-1953,2012, doi:10.4271/2012-01-1953. 3. Johnson, T., “Vehicular Emissions in Review,”SAE Int. J.Engines 5(2):216-234,2012,doi:10.4271/2012-01-0368. 4. Zheng, G., Fila, A.,Kotrba, A., and Floyd, R., “Investigationof Urea Deposits in Urea SCR Systems for Medium and HeavyDuty Trucks," SAE Technical Paper 2010-01-1941,2010,doi:10.4271/2010-01-1941. 5. Seo, J.,“Aftertreatment Package Design for SCR PerformanceOptimization,”SAE Technical Paper 2011-01-1135, 2011,doi:10.4271/2011-01-1135. 6. Munnannur, A., Chiruta,M., and Liu, Z.,“Thermal and FluidDynamic Considerations in Aftertreatment System Design forSCR Solid Deposit Mitigation,”SAE Technical Paper 2012-01-1287,2012, doi:10.4271/2012-01-1287. 7. Smith, H., Lauer, T., Mayer, M., and Pierson, S.,“Opticaland Numerical Investigations on the Mechanisms of DepositFormation in SCR Systems,” SAE Int. J. Fuels Lubr: 7(2):525-542,2014, doi:10.4271/2014-01-1563. 8. De Rudder, K., Chauvin, C. Close coupled DOC-mixer-SCRfor Tier 4 final. AVL International Commercial PowertrainConference. 2013 9. Zheng, G., Gardner, T., Kotrba, A., Golin, M. et al.,“Development of Urea SCR Systems for Large Diesel Engines,”SAE Technical Paper 2011-01-2204,2011,doi:10.4271/2011-01-2204. 10.Lundstrom, A., Andersson, B., Olsson, L. Urea thermolysisstudied under flow reactor conditions using DCS and FT-IR. Chemical Engineering Journal (150) 544-550.2009.doi:10.1016/j.cej.2009.03.044. 11.Schaber, P., Colson.J., Higgins, S., Thielen, D., et al., Thermaldecomposition (pyrolysis) of urea in an open reaction vessel.Thermochimica Acta (424) 131-142.2004.doi:10.1016/i.tca.2004.05.018. 12.Fang, H., DaCosta, H. Urea thermolysis and NOx reduction withand without SCR catalysts. Applied Catalysis B: Environmental(46) 17-34.2003 doi:10.1016/S0926-3373(03)00177-2. Contact Information Tom Lockyer Wolfson School of Mechanical & Manufacturing EngineeringLoughborough University Loughborough, Leics, LE11 2HH, UK t.lockyer@lboro.ac.uk Acknowledgments The authors would like to thank the Energy Technologies Institute(ETI) for commissioning and funding the project on which this workis based. All of the experimental data was gathered at LoughboroughUniversity with thanks to Mark Capers, David Britton and RobertTemple for their technical assistance and support during theconstruction of the test bed facility. Caterpillar and Johnson MattheyPLC for their advice and support, notably Mark Kennedy, DaveHeaton, Andrew Keen, Ron Silver and Michael Nash. Thanks to theEngineering and Physical Sciences Research Council (EPSRC) forproviding additional funding. HD-Heavy-Duty Definitions/Abbreviations AdBlue- A fluid consisting of 32.5% urea by mass in ultra-purewater MFM-Mass Flow Meter NOx-Nitrogen Oxides ASC -Ammonia Slip Catalyst PDI-Phase Doppler Interferometry CPSI -Cells Per Square Inch SCR-Selective Catalytic Reduction DPF-Diesel Particulate Filter SMD -Sauter Mean Diameter DSLR-Digital Single-Lens Reflex ( The Engineering Meeting s Board has approved this paper for p ublication. It has successfully completed SAE’s peer review proce s s under the su p ervision of the session organizer. The p r ocessrequires a minimum of th r ee (3 ) revie w s by in d u s try experts. ) ( All rights reserved. No part of this publication may be reproduced, sto r ed in a retrieval system, or transmitted, in a ny form or b y a n y m eans, electronic, mechanical, photoco p ying, recording , orotherwise, without the prior written p ermission o f SAE In t ernational. ) ( Positions and opinions advanced in thi s paper are tho s e of the aut h or(s) and not necessarily thos e of SAE Intern a tional. The author is solely responsible for the content of the paper. ) Selective catalytic reduction (SCR) has become the mainstream approach for removing heavy-duty (HD) diesel engine NOx emissions. Highly efficient SCR systems are a key enabling technology allowing engines to be calibrated for very high NOx output with a resultant gain in fuel consumption while still maintaining NOx emissions compliance. One key to the successful implementation of high efficiency SCR at elevated engine out NOx levels is the ability to introduce significantly more AdBlue into the exhaust flow while still ensuring complete ammonia production and avoiding the formation of deposits. This paper presents a body of experimental work conducted on an exhaust test bench using optical techniques including high-speed imaging and phase Doppler interferometry (PDI), applied under representative exhaust conditions to a HD diesel engine aftertreatmentsystem with optical access inside the mixer tube. Two different sprays were used to dose AdBlue onto the mixing device. A three-hole injector and a single-hole pressure-swirl injector were characterised in ambient and heated exhaust flow conditions. A metallic two-stage mixer and an uncoated cordierite ceramic substrate mixer were compared and demonstrated the ability of the substrate mixer to reduce deposit formation at higher dosing rates inside the mixer tube when used with the correct spray type. High-speed imaging revealed the ability of the substrate to absorb injectedAdBlue spray at cooler exhaust temperatures. However, using the incorrect spray can lead to liquid saturation inside the substrate channels, which is detrimental due to the formation of deposits on the rear face of the substrate.
关闭-
1/13
-
2/13
还剩11页未读,是否继续阅读?
继续免费阅读全文产品配置单
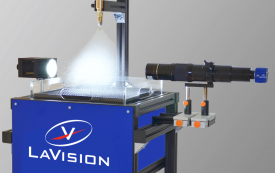
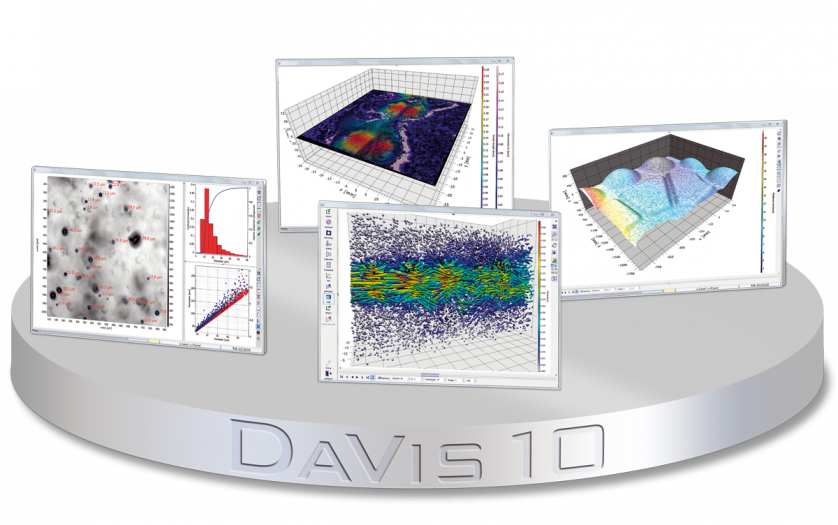
北京欧兰科技发展有限公司为您提供《堇青石基质混合装置中高速阴影成像,液滴粒径和速度检测方案(CCD相机)》,该方案主要用于其他中其他检测,参考标准《暂无》,《堇青石基质混合装置中高速阴影成像,液滴粒径和速度检测方案(CCD相机)》用到的仪器有LaVision HighSpeedStar 高帧频相机、LaVision ParticleMaster-Shadow 粒径测量系统、激光相位多普勒干涉仪LDV,PDI,PDPA,PDA、LaVision DaVis 智能成像软件平台。
我要纠错
推荐专场
CCD相机/影像CCD
更多相关方案








 咨询
咨询


