

方案详情文
智能文字提取功能测试中
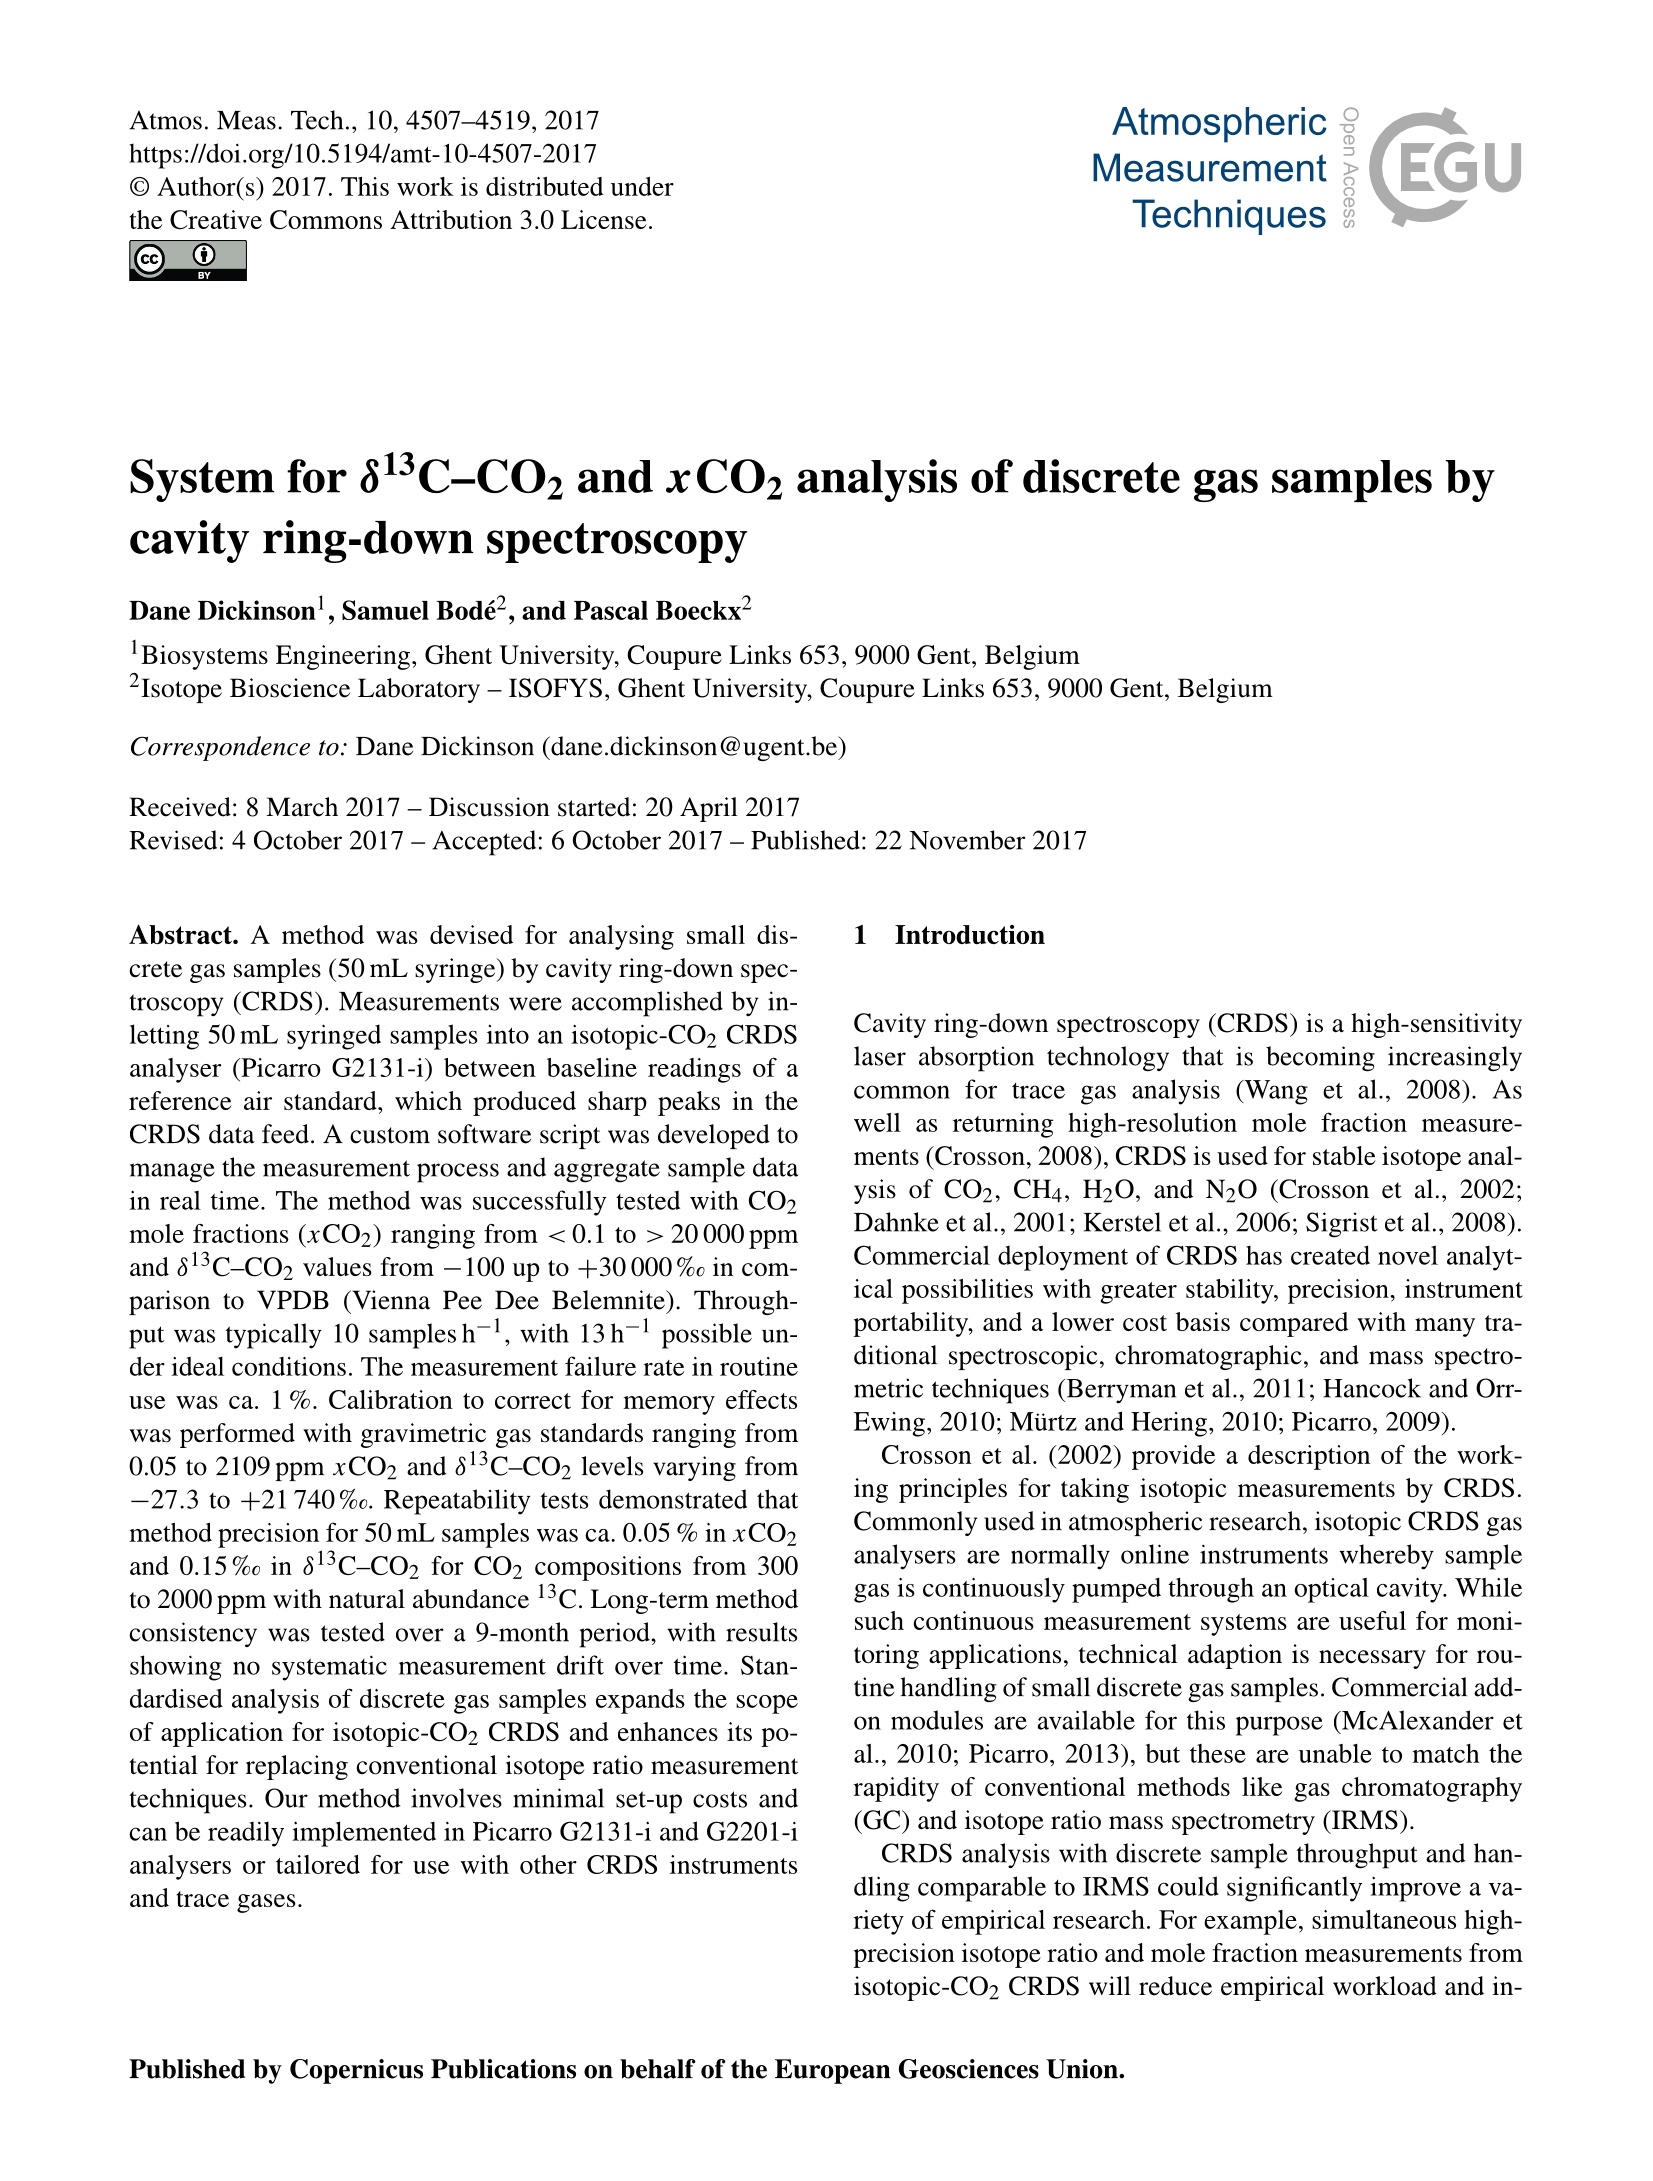
Atmos.Meas. Tech., 10, 4507-4519, 2017AtmosphericMeasurementTechniqueshttps://doi.org/10.5194/amt-10-4507-2017C Author(s) 2017. This work is distributed underthe Creative Commons Attribution 3.0 License. 4508 System for 813C-CO2 and xCO2 analysis of discrete gas samples bycavity ring-down spectroscopy Dane Dickinson, Samuel Bode,and Pascal Boeckx’ Biosystems Engineering, Ghent University, Coupure Links 653, 9000 Gent, Belgium Isotope Bioscience Laboratory-ISOFYS, Ghent University, Coupure Links 653, 9000 Gent, Belgium Correspondence to: Dane Dickinson (dane.dickinson@ugent.be) Received: 8 March 2017-Discussion started: 20 April 2017 Revised: 4 October 2017-Accepted: 6 October 2017 -Published: 22 November 2017 Abstract. A method was devised for analysing small dis-crete gas samples (50 mL syringe) by cavity ring-down spec-troscopy (CRDS). Measurements were accomplished by in-letting 50 mL syringed samples into an isotopic-CO2 CRDSanalyser (Picarro G2131-i) between baseline readings of areference air standard, which produced sharp peaks in theCRDS data feed. A custom software script was developed tomanage the measurement process and aggregate sample datain real time. The method was successfully tested with CO2mole fractions (xCO2) ranging from <0.1 to >20 000 ppmand 813c-CO2 values from -100 up to +30 000% in com-parison to VPDB (Vienna Pee Dee Belemnite). Through-put was typically 10 samples h-, with 13h-possible un-der ideal conditions. The measurement failure rate in routineuse was ca. 1%. Calibration to correct for memory effectswas performed with gravimetric gas standards ranging from0.05 to 2109 ppm xCO2 and 813c-Co2 levels varying from-27.3 to +21740%o. Repeatability tests demonstrated thatmethod precision for 50 mL samples was ca. 0.05% in xCO2and 0.15%o in 813c-CO2 for CO2 compositions from 300to 2000ppm with natural abundance 13C. Long-term methodconsistency was tested over a 9-month period, with resultsshowing no systematic measurement drift over time. Stan-dardised analysis of discrete gas samples expands the scopeof application for isotopic-CO2 CRDS and enhances its po-tential for replacing conventional isotope ratio measurementtechniques. Our method involves minimal set-up costs andcan be readily implemented in Picarro G2131-i and G2201-ianalysers or tailored for use with other CRDS instrumentsand trace gases. Cavity ring-down spectroscopy (CRDS) is a high-sensitivitylaser absorption technology that is becoming increasinglycommon for trace gas analysis (Wang et al., 2008). Aswell as returning high-resolution mole fraction measure-ments (Crosson, 2008), CRDS is used for stable isotope anal-ysis of CO2, CH4, H2O, and N2O (Crosson et al., 2002;Dahnke et al., 2001;Kerstel et al., 2006; Sigrist et al., 2008).Commercial deployment of CRDS has created novel analyt-ical possibilities with greater stability, precision, instrumentportability, and a lower cost basis compared with many tra-ditional spectroscopic, chromatographic, and mass spectro-metric techniques (Berryman et al., 2011; Hancock and Orr-Ewing, 2010; Murtz and Hering, 2010; Picarro, 2009). Crosson et al. (2002) provide a description of the work-ing principles for taking isotopic measurements by CRDS.Commonly used in atmospheric research, isotopic CRDS gasanalysers are normally online instruments whereby samplegas is continuously pumped through an optical cavity. Whilesuch continuous measurement systems are useful for moni-toring applications, technical adaption is necessary for rou-tine handling of small discrete gas samples. Commercial add-on modules are available for this purpose (McAlexander etal., 2010;Picarro,2013), but these are unable to match therapidity of conventional methods like gas chromatography(GC) and isotope ratio mass spectrometry (IRMS). CRDS analysis with discrete sample throughput and han-dling comparable to IRMS could significantly improve a va-riety of empirical research. For example, simultaneous high-precision isotope ratio and mole fraction measurements fromisotopic-CO2 CRDS will reduce empirical workload and in- D. Dickinson et al.: System for discrete gas sample analysis by CRDS crease accuracy of CO2 flux partitioning calculations in soiland plant respiration experiments (Midwood and Millard,2011; Snell et al., 2014). However, realising these benefitsrequires regular batch analysis of discrete samples - existingarrangements that couple CRDS instruments directly to soilheadspace chambers are generally constrained to measuringjust one experiment at a time (Albanito et al., 2012; Bai etal., 2011;Midwood et al., 2008). Berryman et al. (2011) describe a syringe sample deliverysystem for isotope ratio CRDS that allows small air samples(20-30 mL NTP) to be analysed. In their method, the opticalcavity of the CRDS analyser is flushed and completely evac-uated prior to direct sample injection to ensure consistencyand prevent sample-to-sample contamination. Although it isan important technical innovation with handling and cost ad-vantages over IRMS, the set-up is limited by slow sampleturnover rates (3h-). In this paper, we present a new method for measur-ing discrete syringed gas samples (50 mL NTP) by CRDS.Like Berryman et al. (2011), this method was conceived forisotopic-C02 CRDS to provide 813c-Co2 and CO2 molefraction (xCO2) analysis in soil respiration studies, but re-mains general enough to be used in other contexts and ad-justed for other gas species. Instead of evacuating the cav-ity prior to sample introduction, our process interspersessamples against background measurements of a fixed refer-ence air and post-corrects for bias in the measurements. Thisresults in considerably faster throughput for atmosphericsamples (up to 13h-1) than the method of Berryman etal. (2011). Additionally, with precision and discrete sam-ple measurement rates comparable to automated continuous-flow IRMS, this method further advances CRDS as an attrac-tive alternative for trace gas isotope analysis 2 Materials and methods 2.1 Analyser and sampling system The CRDS instrument adapted for discrete sample mea-surement was a Picarro G2131-i isotopic-CO2 gas anal-yser (Picarro Inc., Santa Clara, CA,USA). Detailed de-scriptions of the operation and spectroscopy of the G2131-iand predecessor units can be found in Dickinson etal. (2017), Hoffnagle (2015), Rella (2010a, b,c), and Wahlet al. (2006). In brief, sample air is circulated through a high-reflectivity optical cavity (35 cm) at an inlet flow rate ofca.25 mLmin-1 (NTP). Internal controls maintain the cavityat 318.150±0.002K and 18.67±0.02kPa. Spectroscopicring-down time constants are measured across spectral bandsof 12cl602 and 13c1602 to determine optical absorptionpeak heights, which are computed into 13c/12c isotope ra-tio and CO2 mole fraction data (Hoffnagle,2015). Spectrallines of 12clH4 and H,60 are also measured for correctingdirect and indirect spectral interferences from H2O and CH4 Figure 1. Schematic diagram of the discrete gas sample measure-ment system coupled to the isotopic-CO2 CRDS analyser. on the CO2 bands. The normal measurement range for theG2131-i is set at 380 to 2000 ppm xCO2 and natural abun-dance to +5000% in 813c-Co2 (Picarro, 2011). All measurements made by the G2131-i are continuallyrecorded at a rate of ca. 0.8 Hz; specific data must be ex-tracted from log files for further treatment. Although discretesample measurement is thus possible without special provi-sion - by inletting the G2131-i with 200 to 300 mL (NTP)of sample from a gasbag or chamber and retrieving the rel-evant data (Picarro, 2012)- such a procedure is time inef-ficient and prone to errors from operator inconsistency. Fur-thermore, in many research settings it is impractical or im-possible to gather such large samples (e.g. headspace cham-ber analyses). By instead applying a controlled procedure forinletting smaller volumes and software to automatically pro-cess the raw data in real time, a more feasible method of dis-crete sample measurement was created. A schematic of our measurement set-up is shown in Fig. 1.The system was simple in construction and concept: her-metic sample collection and delivery was achieved by a high-quality gas-tight syringe with push-button valve and Luerlock fitting (50 mL, SGE Analytical Sci., Australia). A low-permeability multilayer foil gasbag (27 L Plastigas, LindeAG, Germany) functioned as a reservoir for a reference airstandard, which was analysed between individual samples soas to give a baseline for accurate data delineation. The large,non-pressurised volume of the reservoir meant pressure-induced mixing and back-flow risks were excluded and al-lowed prolonged operation before refilling (>15 h). Gas-proof fluorinated-ethylene-propylene (FEP) tubing (Roti-labo, Carl Roth GmbH, Germany), Luer lock fittings, and Luer lock 3-way valves completed the set-up. All permanenttube fittings and joins were adhered with Loctite 406/770(Henkel AG, Germany) to ensure robustness and preventleakage. The FEP tubing between the syringe sample inletpoint and the CRDS inlet port (Fig. 1) was minimised (1/8-inch OD×44 cm, connected to the 1/4-inch CRDS inlet portwith reducing ferrule) to decrease mixing and lag time be-tween sample delivery and measurement. 2.2 Sample measurement The G2131-i and discrete sample measurement system wereinstalled in an environmentally controlled laboratory (20°C)to ensure stable operation. Syringed sample measurementwas performed as follows: after instrument start-up and com-mencement of normal function, reference air measurementwas initiated to establish stable baselines of xCO2 and813c-CO2. When a sample was ready for analysis, the syringe wasconnected to the sample inlet point (Fig. 1), and the 3-wayvalve manually actuated to stop the flow ofreference air andsupply the sample directly to the analyser. Upon opening thesyringe valve the gas sample was drawn into the G2131-i,causing steady, unassisted collapse of the syringe plunger.Sample evacuation was completed in ca. 2.5 min, after whichthe sample inlet point valve was immediately reset and ref-erence air intake resumed. Once CO and 813c-Co2 read-ings had returned to initial baseline levels (thereby safeguard-ing against sample-to-sample carryover), the process was re-peated for the next sample. In this way, reference air read-ings were punctuated by syringe samples to create “peaks”in the raw data output with a sample-to-sample time of ca.5 min (Fig. 2). The gas aliquot size for all measurements wasnominally 50 mL NTP. (Analysis of smaller amounts may bepossible but 50mL was assessed as a minimum for reliableoperation. Samples larger than 50 mL would be easily han-dled, although adjustment of peak truncation parameters andre-calibration may be necessary for accurate performance-see below and Sect. 2.3.) To achieve unambiguous sample peak identification, dis-tinction in CO2 was required between reference air and sam-ple. In practice this meant a relative change of ca. 2 % inxCO2 or ca. 5%o in 813c-C02. However, very large dif-ferences resulted in slower sample turnover (see Sect. 3.1).Best throughput was obtained using reference air that wassimilar to samples in xCO2 but contrasted in 813c-C02 (ca.15%o difference). In this work, dry standard air with 496 ppmxCO2 and -36.1%813C-CO2 was used as the reference forall formal measurements (NA1, Table 1). While sample measurement was performed manually (i.e.syringe connection and disconnection, valve operation), toensure method consistency we composed a custom computersoftware script to manage the process in real time (scriptavailable in the Supplement). Running through the built-inCoordinator software programme of the G2131-i, our scriptprompted the user for correct timing of sample introduction, Figure 2. Example CRDS data feed for syringe samples. Referenceair measurements (ca. 425 ppm xCO2 and -37%8C-CO2)are interrupted by successive samples to form consistently identifi-able peaks in the data. detected and extracted sample peak data, monitored refer-ence air values, filtered problem measurements, and recordedmeasurement results. The software script isolated individualsamples from the CRDS data stream by using specific eventsand timings in the measurement process as cues (e.g. a ba-sic peak recognition algorithm; Fig. 3a). Prior to the intro-duction of a sample, a reference air baseline was recordedfor 30 s and averaged. Sample detection (trigger) then oc-curred when xCO2 or 813c-CO2 values deviated from thebaseline beyond a fixed threshold (default: 0.5% ofxCO2or 2% in 813c-CO2). The sample end (detrigger) was de-tected when measurements returned halfway to baseline val-ues (Fig.3b). By truncating the sample peak data +80 s fromthe trigger and -29s from the detrigger, ca. 30s of repre-sentative measurement data was obtained for each sample(Fig. 3a). Upon completion of a sample measurement, thescript computed means and standard deviations (SDs) of alldata elements reported by the G2131-i (i.e. xH2O and xCH4values together with xCO2 and 813c-CO2). These statisticswere compiled along with corresponding baseline measure-ments, time-stamped, assigned sample descriptors, and thenoutputted into a concise results file (see example in the Sup-plement). After each detrigger event the software monitoredCRDS readings for a return to initial reference air baselinevalues before directing the operator to proceed with the nextsample. In addition to the G2131-i analyser, our method wassuccessfully trialled on a sister CRDS instrument (PicarroG2201-i). The G2201-i differs from the G2131-i only inadditionally measuring 13clH4 to give 813C-CH4 data (Pi- Time (s) Figure 3. (a) Example of raw G2131-i measurement data and breakdown of events during analysis of a 50 mL syringe sample. Blue segmentsare truncated from the sample peak by our software script while red segments are the extracted measurement data. All timings and thresholdsare user customisable in the software for variation in sample size and equipment.(b) The most reliable sample end time (detrigger) wasestablished as the point when measurements returned to half the difference between peak-maximum (or minimum in the case of sampleswith lower xCO2 than reference air) and the baseline value. Grey lines are amplitude-normalised tailing segments from 23 test sampleswidely varying inxCo2. The broken green curve denotes a generalised logistic function fit to these test data by non-linear least squaresoptimisation. Solving the fitted function determined that 29±2 s elapsed between peak-maximum and half-maximum irrespective of samplecomposition. carro, 2015). To assist method adoption, we supply softwarescripts customised for each instrument (Supplement). Thescripts include provision for user adjustment of peak identi-fication and truncation parameters to suit individual set-ups.A short video demonstration of the system is also available(see https://doi.org/10.5446/32922). 2.3 Measurement calibration Conventional CRDS trace gas measurements are affected bysignal noise, gradual instrument drift, and any unaddressedinterferences or perturbations in the underlying spectroscopy(Vogel et al., 2013). Calibration strategies exist to counterboth drift and spectral errors, while random noise ultimatelylimits instrument precision (Friedrichs et al., 2010; Wen etal., 2013). In the present case of small discrete samples, how-ever, there was additional inaccuracy stemming from the na-ture of sample gas delivery into the CRDS analyser. As discussed in studies by Gkinis et al. (2011) andStowasser et al. (2012), stepwise changes to the inlet gascomposition (as occur with discrete samples) do not give riseto correspondingly abrupt jumps in CRDS measurements andinstead result in sigmoid-shaped steps in the data (Fig. 3b).These smoothed transitions are the combined result of (i) therate of gas replenishment in the optical cavity (Stowasser etal., 2014), (ii) partial mixing (turbulence and diffusion) ofgas compositions downstream of the sample inlet (Gkinis etal., 2011), and (iii) molecular sorption and desorption on in- ternal surfaces of the cavity and inlet tubes (Friedrichs etal., 2010). Although reported response times of CRDS in-struments typically range from 1 to 3 min (Picarro, 2011;Sumner et al., 2011), the actual time required for an opti-cal cavity to completely transition to a new gas compositioncan be substantially longer. In testing the G2131-i, we ob-served remnants of previous gases persisting with asymptoti-cal decline for as long as 40 min following very large shifts inCO2 composition (e.g. |xCO2|>10 000ppm or |A813c-CO2|>5000%0). While the error caused by the residualgases may sometimes be relatively trivial, all measurementsthat occur prior to the cavity attaining equilibrium will expe-rience these “memory effects". In our 50 mL syringe samples, memory effects wereclearly present, as evidenced by the asymptotic curvature inthe data peaks (Fig.2). This meant that reported measure-ments of syringe samples were biased towards reference aircompared to “true” values that would eventually be deter-mined from measurements of indeterminately large samplevolumes and monitoring for asymptotic closure. Other re-searchers have mitigated memory effects by evacuating theoptical cavity before sample introduction (Berryman et al.,2011), or through several replicate measurements (Gupta etal., 2009; Leffler and Welker, 2013). Such solutions signifi-cantly reduce sample throughput, however. In this work, weelected to post-correct for reference air carryover by calibrat-ing our method with bottled gas standards. More specifically,we compared discrete sample measurements of gas standards Table 1. Bottle measurement data of the standard air used as baseline for syringe sample measurements (NA1) and the gas standards usedin method calibration (NA2 to LE2). Values are the averages (SDs in parentheses) of 10 min measurements taken for each standard directlyinlet to the CRDS analyser (see Sect. 2.3). Data have been post-corrected as per the calibration of Dickinson et al. (2017). Standard ID x12co2 (ppm) x13co2 (ppm) xCO2 (ppm) Rco(13co2/12co2) 813c-co2(%0)b NA1 (Ref. air) 490.55 (0.13) 5.286(0.004) 495.84 (0.13) 1.0776 (0.0006) -36.14(0.57) NA2 1024.26 (0.21) 11.137(0.004) 1035.39 (0.21) 1.0874 (0.0003) -27.43(0.28) ZERO 0.05 (0.04) 0.004 (0.004) 0.05 (0.04) HE1 2028.98 (0.47) 25.528 (0.007) 2054.51(0.47) 1.2582 (0.0004) +125.35(0.34) HE2 2009.15(0.53) 100.11(0.02) 2109.26 (0.53) 4.983 (0.001) +3456.9 (1.1) TT 1002.18(0.22) 50.216(0.008) 1052.40(0.22) 5.011(0.001) +3481.7(1.1) LE1 402.24(0.11) 25.249 (0.005) 427.49 (0.11) 6.277 (0.002) +4614.5(1.7) LE2 398.21(0.16) 101.24(0.01) 499.45 (0.16) 25.42 (0.01) +21739(9) a Rco, data are scaled by 10? for ease of comprehension. b13c-CO2 values are reported against VPDB (Vienna Pee Dee Belemnite; Werner and Brand,2001). against measurements of the same standard directly inletto the G2131-i for prolonged periods (>1 h). Importantly,syringe measurements were not calibrated directly againstgravimetric values of the standards -here we were only con-cerned with isolating and eliminating bias associated withthe syringe sampling method and not with unaccounted in-accuracies or drift in instrument spectroscopy. This approachfacilitates a more comprehensive examination of memory ef-fects while also providing flexibility for method adaptationor applying additional error corrections for specific samples(e.g. adjusting for gas-matrix pressure broadening effects:Nara et al., 2012). To this end, seven gravimetric gas standards were used asfixed-source calibrants (0.05 to 2109 ppm xCO2 and -27.3to +21 740%o813c-Co2; see Table 1, exact compositionsdetailed in Dickinson et al.,2017). Using such a wide rangeof CO2 compositions served to improve overall calibrationaccuracy as well as demonstrating reliability and applicabil-ity of method. Direct measurements were performed by in-letting the bottled standards to the G2131-i for more than1h to ensure the absence of memory effects before tak-ing formal measurements for 10 min (ca. 460 data points,averages reported in Table 1). Next, 50 mL syringe sam-ples of the standards were taken directly from bottles (sy-ringe was pre-flushed several times to preclude contamina-tion) and measured as described in Sect. 2.2 (8 samples ofeach standard for 56 measurements in total - data set in theSupplement). Before further analysis, due to the high3cabundance in several gas standards, all reported CO2 datawere adjusted using the empirical correction described byDickinson et al. (2017). (In testing CRDS performance withC-enriched CO2, Dickinson et al., 2017, identified minorbut unaccounted spectroscopic cross-talk in 12Co2 measure-ments at elevated levels of 13CO2, as well as logical in-consistencies in the G2131-i data output. Their correctionscheme was applied to the present data as a precaution topreclude any possibility that an underlying instrument error might obfuscate the memory effects in syringe sample mea-surements. The relationship between syringe and bottle measurementswas established by recognising that the data peaks generatedby syringe samples could be approximated by generalised lo-gistic curves (Fig. 3b, also Gkinis et al., 2011). From this,together with a constant aliquot size for all syringe measure-ments, we were able to predict a simple linear scaling of sy-ringe values: where “syringe"refers to the measurement value obtainedfor a syringe sample of a gas standard, “baseto the baselinemeasurement of reference air prior to sample introduction,“bottle”to the direct bottle measurement of the same stan-dard, and K is a dimensionless empirical constant. While all CO2 data elements reported by the G2131-i ex-hibited reasonably similar sample peak geometry, the empir-ical constants for 12CO2 and 13Co2 were expected to differdue to (de)sorption and diffusion-induced isotope fractiona-tion during sample filling of the optical cavity. Further, theo-retical gas mixing considerations entailed that Eq.(1) wouldnot consistently hold for 13c / 12C isotope ratio data (Rco,),where a simultaneous change in total-xCO2 also occurred.Consequently, only x12co2 and x13co2 data were explic-itly calibrated, with Rco being subsequently recalculated.(Moreover, only the dry mole fraction data of 12Co2 and13CO2 were used due to the high likelihood of different tran-sition equalisation rates for CO2 and H2O. For explanationof dry and wet mole fraction data see Hoffnagle, 2015; Rella,2010a; Rella et al., 2013.) Accordingly, the following correc-tion formulae were derived from Eq. (1): Total-xCO2, Rco, and 813c-co2 data were then deter-mined from the resulting corrected values of x2CO2 andx13CO2: The correction constants, KC12 and Kc13, were foundthrough weighted least squares analysis (WLS) of Eqs. (2)and (3) with syringe and bottle measurements of gas stan-dards as input data (i.e. reverse regression of Eq. 1: bottlemeasurements substituting for the left-hand sides of Eqs. 2and 3). To increase statistical power, Rco, and total-xCO2data from bottle measurements were also incorporated intothe analysis with Eqs. (4) and (5), thereby forming an ex-tended optimisation problem (n =216). In a similar vein tothe WLS approach used by both Dickinson et al. (2017) andStowasser et al. (2014) for calibrating CRDS measurements,residual weights were taken as the reciprocals of the indi-vidual summed variances resulting from the SDs of each sy-ringe sample and bottle measurement (see Supplement andTable 1). The WLS solution was determined in R (version3.2.1, R Core Team, 2015) by general purpose optimisationusing the L-BFGS-B algorithm (Zhu et al., 1997) to yield thebest-fit correction constants for all available CO2 mole frac-tion and 13c/12C isotope ratio data. 2.4 Precision and consistency tests CRDS precision is generally assessed by the variability in re-peated measurements of a homogenous gas source (e.g. theSD of multiple 5 min analyses; Vogel et al., 2013; Wang etal.,2013). However, the internal variation in individual mea-surements can also be used to gauge analytic resolution (e.g.the SD of data contained in a 10 min measurement - as withthe bottle measurements in Sect. 2.3; also Pang et al.,2016and Stowasser et al., 2014). For our case of 50 mL syringesamples, precision was quantified in both ways: the SD ofthe 30 s of CRDS data composing each individual sample (in-trasample SD; see Sect. 2.2) and as the statistical dispersionof replicate samples (intersample SD). We tested method precision by repeated measurementsof a systematic set of gas mixtures that spanned the nor-mal operational CO2 range of the G2131-i. Using gas stan-dards as blending sources (Table 1; Dickinson et al., 2017),20 unique mixtures with varied CO2 mole fractions (ca. 300,600,1000,1500,2000ppm) and 813c-C02 values (ca.-30,+800,+1750,+2700,+3600%0) were prepared into multi-layer foil gasbags (1000 mL Supel Inert, Sigma-Alrich Corp.,St. Louis,MO,USA). (The set of mixtures formed an orthog-onal array of cross combinations of xCO2 and 813C-Co2meaning any interdependency in precision could be iden-tified.) Each mixture was sampled and measured with thesyringe method three times in succession, and results wereanalysed for inter- and intra-measurement variation. Long-term consistency and reliability of our syringemethod was assessed by periodic analysis of standard air(NA2, Table 1) during the course of 9 months of routine in-strument use. More than 200 measurements were conductedand results were examined for precision and drift. 3 Results and discussion 3.1 System operation Though somewhat labour intensive and requiring contin-ual operator attention, the syringe sample measurement pro-cess was uncomplicated, reliable, and economical. Samplehandling and CRDS operation was non-specialist in com-parison to conventional IRMS. The method was flexible toCO2 composition, successfully handling samples <0.1 to>20 000 ppmxCO2 and -100 to +30000% 813C-CO2.The only significant methodological constraint observed wasa reduction in sample turnover rate for compositions greaterthan either 3000ppm xCO2 or +4000%813C-CO2. Thiswas because post-sample reference air measurements tooklonger to return to pre-sample baselines due to memoryeffects, thereby extending the intersample period. Keep-ing CO2 levels within G2131-i specifications resulted in athroughput of ca. 10 samples h-1. Best measurement rates of12 to 13 samples h-occurred when sample CO2 composi-tions neighboured the reference air (e.g. within ca. 100 ppmxCO2 and ca.20%813C-CO2 of reference). These through-put rates are at least a 2-fold improvement over both themethods of Berryman et al. (2011) and specialty peripheraldevices (Picarro,2013). Following initial development, the syringe method was in-corporated into our general laboratory practices and duringthe first year of implementation more than 10 000 sampleswere measured. Despite intense instrument usage, we noticedno changes or adverse impacts on G2131-i function, althoughincreased external pressure variations caused by frequent sy-ringe evacuations may conceivably reduce mechanical life-times of optical cavity pressure control valves. Failures oc-curred in ca. 1 %of measurements, principally due to oper- Figure 4. Discrepancies between syringe sample and direct bottle measurements (syringe bias) of gas standards as a function of the syringesample peak height (Eq. 7) for (a) x12CO2 and (b) x13Co2. The WLS-fitted linear models (see Sect. 2.3) are overlaid for comparison (solidlines, slopes=1-K, Eq. 7), with 95 % confidence intervals (shaded) and 95 % prediction intervals (dashed lines) as determined from thestandard error estimates of KC12 and KC13 (Sect.3.2). ator mistakes but occasionally because of leakage in sam-ple inlet valve, syringe fault, or complications from the peakidentification algorithm for samples very similar to the refer-ence air (see Sect. 2.2). Very rarely, minor instabilities in ref-erence air readings caused false peak detections and baselinereturn problems, but such instances were usually identifiedby the software script and internally resolved. Durability of the gas-tight syringes used for sample de-livery was excellent, although regular monitoring and main-tenance was important to ensure smooth sample evacuationduring the measurement process. Excessive plunger frictionled to significant “jumpiness”during the collapse of the sy-ringe plunger, which manifested as small pressure fluctua-tions in the optical cavity and increased measurement noise(evidenced by larger intrasample SDs). Careful cleaning andexact silicone lubrication was carried out every few hundredsamples to ensure uniform plunger operation and prolonga-tion of syringe life. Syringe push-button and sample inletpoint valves also required periodic attention and were re-placed as necessary to pre-empt leaks and breakages. 3.2 Correction of memory effects From rearranging Eq. (1), the discrepancy between syringeand bottle measurements (syringe bias) was predicted to beproportional to the difference between the syringe value andreference air baseline (sample peak height): Comparing the actual syringe sample and bottle measure-ments of gas standards, we observed a systematic memory effect bias that was indeed consistent with this postulatedrelationship (Fig. 4). WLS across all CO2 data yielded es-timates of 1.00341 for Kc12 and 1.00440 for KC13, with acoefficient of determination (r-) of 0.84 (weighted residuals)for the complete correction model. Standard errors for KC12and KC13 estimates were respectively 0.00017 and 0.00014(see confidence intervals in Fig. 4). The Pearson’s correla-tion coefficient between KC12 and KC13 estimates was 0.26.The observed divergence in correction constants for 12co2and 13Co2 was statistically significant (t-test: P <0.0001)with a larger memory effect present in 13co2 measurements.This result corroborates the expectation of isotope fraction-ation occurring during gas equalisation in the CRDS opticalcavity, putatively due to surface (de)sorption and diffusionphenomena. Having determined KCi2 and KC13, syringe CO2 mea-surements can be adjusted for bias with Eqs. (2)-(6). Ac-curacy of these corrections is very good: the standard errorson KC12 and KC13 add uncertainty to xCO2 and 813C-Co2data of less than 0.02% of the difference between the sampleand baseline values. For atmospheric samples, this additionalsource of error is entirely negligible compared to the uncer-tainty deriving from measurement precision and gas standardanalytical accuracy. While the correction coefficients (KC12 and KC13) foundin this work are unique to our sampling equipment andG2131-i analyser, the equivalent calibration may be easilyperformed on replica set-ups. We provide a generic spread-sheet to post-correct syringe sample CO2 data for any val-ues of KC12 and KC13, and a template for simultaneouslyapplying the syringe correction with the spectroscopic cali- x13coz(ppm) Inter-sample standard deviation Intra-sample standard deviation Linear trend line Linear trend line bration strategy of Dickinson et al. (2017) for 13C-enrichedsamples (Supplement). Although our work only addressesmemory effect bias in CO2 data, we are confident that thesame strategy (Eq. 1) is straightforwardly applicable to othergas species (and isotopes) that can be similarly analysed bysyringed samples and CRDS (e.g. CH4,H2O,N2O). 3.3 Measurement precision and consistency Replicate tests provided a practical account of precision af-forded by our discrete sample measurement system. Figure 5shows inter- and intrasample SDs and relative SDs for 12CO2and 13CO2 mole fraction data (complete data set in the Sup-plement). The SDs of both species were generally propor-tional to their measured values and unaffected by 813C-Co2level (i.e. precision in 12Co2 and 13Co2 measurements weremutually independent). Relative SDs for both isotopologuesremained near constant at ≤0.05% across the tested ranges,however (Fig. 5c, d). Notably, the majority of intrasampleSDs for both x12co2 and x13Co2 data were found to bein general agreement with counterpart intersample SDs (seetrend lines in Fig. 5). This means that the SDs reported by oursoftware script for 12co2 and 13co2 mole fractions in indi-vidual syringe sample measurements will reasonably approx-imate the expected precision for replicated measurements ofthose samples. In contrast, inter- and intrasample SDs in 13c/12C iso-tope ratio data were dependent on the813c-Co2 level andCO2 mole fraction, increasing with higher 813c-Co2 andlower xCO2 (see Fig. Sla, b in the Supplement). The rel-ative SDs of isotope ratio measurements w1e..r.e.. .unaffected by813c-CO2 level but steadily decreased with increasing xCO2- declining from between 0.07 and 0.04 % at 300 ppm xCO2to between 0.03 and 0.015 % at 2000 ppm (Fig. S1d). Oneexception was at natural abundance isotope ratios (83c-CO2≈-30%), where intersample relative SDs of Rcowere steady at ca. 0.015 % (i.e. 0.15%) across the testedxCO2 range (Fig. S1b).Somewhat opposing CO2 mole frac-tion data, intrasample SDs of isotope ratio data were al-most always greater than corresponding intersample SDs,which largely reflects the summation of variance from the12Co2 and 13Co2 spectral measurements used to produce the13c /1C ratios. Nevertheless, as with 12co2 and 13CO2, theSD reported for 813C-CO2 in individual syringe sample mea-surements may be used as a conservative proxy of 813c-Co2replicate precision. Consistency of the syringed sample method was estab-lished by long-term repeated analysis of standard air (NA2,Table 1). Figure6 shows x12co2 and 813c-CO2 data from200 measurements covering a 9-month period (data set avail-able in the Supplement). It is important to note that, becausethese data were only adjusted for memory effects inherent Figure 6. Repeated syringe sample measurements in (a) x12cO2 and (b) 813c-c02 of standard gas NA2 (Table 1) over a 9-month period(n=200). Error bars denote ±1 intrasample SD of each individual measurement. Grand means are the solid black horizontal lines withdotted lines indicating ±1 SD of all measurements. Ten sample moving averages are shown in red. Histogram insets on the right depictcumulative distributions of syringe measurements. Blue dashed lines indicate the direct bottle measurement of NA2 with blue-shaded areascovering ±1 SD of the bottle measurement. to the discrete sample system (i.e. by Eqs. 2-6), they rep-resent a simultaneous time-series test of instrument stabil-ity and methodological constancy.12( The measurements aver-aged 1024.18 ppm in x1Co2 and -27.35% in 813c-C02with respective SDs of 0.50 ppm and 0.33%o. The latter SDis larger than the intersample SD found in replicate mea-surement testing (0.15%o; see above), likely indicating thepresence of instrument drift in the data in addition to ran-dom errors of repeated syringe sampling. While the sepa-rate components of variance cannot be resolved here,movingmeans (red lines in Fig. 6) show neither a sustained trend normethod discontinuity, and imply that reasonable measure-ment accuracy is possible under typical laboratory practiceswithout perpetual calibration against gas standards (comparesyringe sample measurements against the direct bottle mea-surement of NA2, Fig. 6), corroborating the similar conclu-sion reached by Friedrichs et al. (2010). The mean of in-trasample SDs in the 200 measurements was 0.42 ppm forx12co2 and 0.35%o for 813c-CO2, both corresponding wellto the aforementioned SDs of all measurements and the in-trasample SDs in the replicate tests. This consistency furthersupports our proposition that a single syringe measurementand its intrasample SD can deliver a similar (although in-herently less reliable) statistical estimate to one generatedthrough multiple sample measurements, potentially makingreplicate CRDS analyses unnecessary in research contextswhere statistical uncertainty is not a critical consideration. In sum, despite the short CRDS analysis period for a sy-ringe sample (ca. 30 s), and limited number of replicates in performance testing, achieved measurement precision wasexcellent. With our system and G2131-i analyser, replicatesample SDs of ≤0.05 % may be expected for 12Co2 and13co2 mole fraction data, while resolution in repeated 813c-CO2 measurements will be ca. 0.15%o at natural 13C abun-dance. Moreover, to a first approximation, similar precisionscan be obtained from intrasample SDs of single syringe sam-ple measurements. These results should be viewed tentativelyif adapting our method to a different model of CRDS anal-yser, however. Because observed measurement variation de-rives from both volatility in the discrete sampling method andnoise inherent to the instrument, matching the precision re-ported here is unlikely with lower-performance CRDS units.As a point of reference, when using the G2131-i for continu-ous analysis of a homogeneous source, the intersample SDsfor sequential 30 s data segments are ca. 0.15%oin 813c-CO2and 0.01% in both x12CO2 and x13Co2, while intrasampleSDs are ca. 0.30% and 0.025 %(Dickinson et al., 2017; alsomanufacturer specifications: Picarro, 2011). Compared to other CRDS discrete sample methods, our re-sults improve upon the 0.3%(813c-CO2) and 0.3%(xCO2)precision attained by Berryman et al. (2011), although this isprobably due to the enhanced spectroscopic sensitivity of theG2131-i relative to the older G1101-i analyser used in theirstudy. Additionally, our method delivers precision in 813c-CO2 that is similar to both the Picarro SSIM2 discrete sam-ple peripheral device (0.11%o, Picarro, 2013) and traditionalcontinuous-flow IRMS (typically 0.1%o), which, by contrast,are single-purpose instruments that do not also report accu- rate CO2 mole fraction measurements. And finally, althoughfiner measurement resolution is possible with CRDS, the un-certainties deriving from the precision of our discrete sam-ple measurements will be, in many cases, no worse than thetolerances on gravimetric gas standards used for instrumentcalibrations (cf. Brewer et al., 2014; Dickinson et al.,2017).In such contexts, applying our method to isotopic and molefraction analyses of trace gases should not result in signifi-cantly poorer absolute accuracy compared to other samplingtechniques (i.e. uncertainties on gas standards, rather thanmeasurement precision, may limit overall accuracy). 3.4 Potential applications At present, isotope ratio analysis of fixed trace gas samplesis usually accomplished by IRMS interfaced to autosamplingGC systems. Such instruments require specialised user train-ing and carry high consumable costs, however. Similarly ca-pable CRDS-based techniques can avoid both these limita-tions and represent an advance in stable isotope analysis. Al-though not suitable for all sample types, adapting the presentgeneration of CRDS gas analysers for rapid discrete samplemeasurement has promising application in contexts wheresyringe or flask sampling is frequently performed -espe-cially where accurate gas mole fraction data are also valuable- such as in ecosystem respiration and emission studies (cf.Zeeman et al., 2008), analysing dissolved gases in terrestrialwaters (Hope et al.,1995;Loose et al., 2009), and certain in-stances of trapped air in ice cores (e.g. Sowers et al., 2005). A specific example where our method has immediate rel-evance is in measuring CO2 respiration in soil microcosmheadspace studies. To date, applying CRDS gas analysersto such research is mostly achieved through closed-loop re-circulation (Christiansen et al., 2015;Ramlow and Cotrufo,2017) or continuous analysis of open chamber systems (Baiet al., 2011; Jassal et al., 2016). Apart from cost and com-plexity, these solutions restrict the number of experimentsthat can be concurrently measured by a single instrument.Our system significantly eases this constraint, however. Forinstance, assuming a sample turnover of 10 h-1 and conduct-ing four syringed headspace measurements per microcosmover the course of a 10 h workday, it is feasible to use oneanalyser for measuring daily respiration rates in 25 simul-taneous experiments. Further, where CO2 flux partitioningby isotopic analysis is undertaken, achieving sample mea-surement precision of ca. 0.05 % in xCO2 and ca. 0.15%oin 813c-CO2 means that the resulting uncertainties on effluxpartitions will be comparable (if not smaller) to those in stud-ies using infrared gas analysis and IRMS or IRMS alone (cf.Joos et al., 2008; Munksgaard et al., 2013). The primary drawbacks of employing our method forisotopic-CO2 measurements of discrete samples compared toan automated GC-IRMS system are (i) the larger samplingsize, (ii) a more constrained operational xCO2 range, and(iii) the necessity of near-continuous operator presence at the instrument. However, implementation of smaller CRDS op-tical cavities could dramatically decrease the required sam-ple amount and allow even shorter measurement times (e.g.Stowasser et al., 2014), while dilution methods and calibra-tion can expand the xCO2 measurement range of CRDS.Similarly, methodological refinements that integrate auto-mated syringe sampling and valve systems would curtaillabour requirements. 4 Conclusions and outlook Discrete sample analysis of trace gases by CRDS is possi-ble through basic instrument adaptation. We have set fortha scheme for xCO2 and 813c-CO2 determination of 50 mLsyringed samples on a Picarro G2131-i isotopic-CO2 anal-yser. With software to manage the measurement process andcompute results data, our method offers substantially fasteranalysis of small gas volumes with equal or better precisionthan comparable set-ups. Memory effects present in syringesample measurements can be accurately compensated by cal-ibration against large-volume measurements of gravimetricgas standards. Although CRDSS iss gaining scientific acceptance forisotopic-CO2 measurement, so far the technology has not se-riously challenged IRMS in discrete gas sample analysis, de-spite lower running and capital costs, simpler operation, lessmeasurement drift, and the added benefit of providing moreaccurate xCO2 data concurrently with 813c-CO2. In achiev-ing comparable precision and sample throughput to IRMS,our syringe sample method helps to position CRDS as a ten-able competitor for isotopic analysis of discrete samples. The chief disadvantages of our process compared to IRMSfor isotopic-CO2analysis are a narrower xCO2 performancerange, higher labour demands, and a comparatively largesample size (50mL NTP). Method improvements towardsautomation may greatly ease user workload, however, andthe development of smaller optical cavities could reduce thesample gas needed for discrete analysis on future CRDSanalysers as well as increasing sample throughput rates evenfurther. This system can be applied with any Picarro G2131-i orG2201-i CRDS analyser, thoughcalibration and tuning of pa-rameters in the software script may be necessary to accountfor variations in set-up, sample volume (and pressure), andreference air composition. Implementation on other CRDSinstruments and conversion for measurements of other tracegases are anticipated with only minor software amendments. Data availability. All data used in this paper, as well as variousresources to facilitate method adoption, are contained in the Sup-plement. A video demonstration of the system in operation is alsoavailable (https://doi.org/10.5446/32922). The Supplement related to this article is available onlineat https://doi.org/10.5194/amt-10-4507-2017-supplement. Competing interests. The authors declare that they have no conflictof interest. Acknowledgements. We are grateful to our ISOFYS colleaguesStijn Vandevoorde, Hannes De Schepper, and Katja Van Nieulandfor their assistance with instrument operation and numerous samplemeasurements. We also thank Lei Liu (CREAF-CSIC, Barcelona,Spain) for testing our method on a Picarro G2201-i CRDS unit andfor providing feedback on method efficacy. Renato Winkler fromPicarro Inc. aided this work with his useful advice on developingsoftware scripts for the G2131-i analyser. Finally, we thank theassociate editor and two anonymous referees whose commentshelped to refine this paper. Edited by: David Griffith Reviewed by: two anonymous referees References ( Albanito, F .,McAllister, J . L., C escatti, A., Smith, P., a nd Robin- son,D.: D ual-chamber m e asurements of 813c of soil-respired CO2 partitioned u sing a field-based thre e end-member m odel,Soil Biol. Biochem., 47 , 106-115,2012. ) ( Bai, M., Kostler, M., Kunstmann, J . , Wilske, B . , Gattinger, A .,Frede, H .-G., and B reuer, L .: Biodegradability screening of soilamendments t h rough co u pling of wavelength-scanned cav i ty ring-down spectroscopy t o multiple dynamic chambers, Rapid Commun. Mass Sp.,25,3683-3689,2011. ) ( Berryman, E. M.,Ma r shall, J. D . , R a hn, T . , Cook, S. P . , a nd Lit-vak,M.: Adaptation of continuous-flow cavity ring-down spec- troscopy for batch analysis of 813c of CO2 and comparison withisotope ratio mass spectrometry , Rapid Commun. Mass Sp., 25 , 2355-2360,2011. ) ( Brewer, P. J ., Brown, R. J., M iller, M . N., Minarro, M . D. , Mu r u- g an, A ., M ilton, M . J . , a nd Rhoderick, G . C.: Preparation andValidation of Fully Synthetic Standard Gas M ixtures with Atmo-spheric Isotopi c Composition for Global CO2 and CH4 Monitor- ing, Anal. Chem., 86,1887-1893,2014. ) ( Christiansen, J. R., Outhwaite, J., and Smukler, S. M .: Compari- son of CO2, CH4 and N20 soil-atmosphere exchange m e asured in stati c chambers with cavity ring-down spectroscopy and gaschromatography, Agr. Forest. Meteorol., 211-212, 48-57,2015. ) ( Crosson, E. R .: A c avity ring-down analyzer f or measuring a tmo-spheric levels of methane, carbon dioxide, and water vapor, Appl. Phys. B, 92,403-408,2008. ) ( Crosson,E. R . , Ricci, K. N., R ichman,B. A., Chilese, F. C.,Owano, T . G., Provencal, R. A ., T odd, M. W . , Glasser, J., Kachanov, A.A., Paldus, B . A ., S pence, T . G., a n d Zare, R. N.: St a ble is o -tope ratios using cavity ring-down s pectroscopy: D etermination of 13c/l2C for carbon dioxide in human breath, Anal. Chem., 74, 2003-2007,2002. ) ( Dahnke, H . , K l eine, D., U r ban, W., He r ing, P., and Mi r tz,M.: Iso-topic ratio measurement o f methane in ambient a i r using mid-infrared cavity leak-out spectroscopy, Appl. Phys. B , 72, 1 21- 125,2001. ) ( Dickinson, D., Bode, S., and Boeckx, P: Measuring 13c-enriched CO2 i n air with a cavity ring-down spectroscopy ga s an a lyser:Evaluation and calibration, Rapid Commun. Mass Sp., 31, 1892-1902, https://doi.org/10.1002/rcm.7969,2017. ) ( Friedrichs, G., Bock, J., T emps, F . , F i etzek, P . , Kortzinger, A . , and W allace, D . W . R . : Toward continuous mo n itoring of se a - water 13co2/12co2 isotope r a tio a nd pCO2: Performance of cavity ringdown s pectroscopy and g a s m a trix effects, L imnol.Oceanogr.-Meth., 8, 539-551, 2010. ) ( Gkinis, V., P opp, T . J., B lunier,T . , Bigler, M., S c hiipbach, S., Ke t -tner, E., and Johnsen, S. J.: Water i s otopic ratios from a contin-uously melted ice core sample, Atmos. M eas. Tech., 4, 2 531- 2542, h ttps://doi.org/10.5194/amt-4-2531-2011,2011. ) ( Gupta, P., Noone, D.,Galewsky,J., S weeney, C., a n d Vaughn, B. H.: Demonstration o f h igh-precision continuous measurements o f water vapor isotopologues in laboratory and remote field deploy- ments using wavelength-scanned cavity ring-down spectroscopy (WS-CRDS) technology, Rapid Commun. Mass Sp., 23, 2534- 2542,2009. ) ( Hancock, G. and Orr-Ewing, A. J. : Applications o f Cavity Ring-Down Spectroscopy in Atmospheric Chemistry, in: Cavity Ring-Down Spectroscopy, John W iley & Sons Ltd., 181-211, 2010. ) ( Hoffnagle,J.: Understanding the G 2131-i i s otopic c arbon d ioxidedata log, Picarro Inc., Santa Clara, California, USA, 2015. ) ( Hope, D . , D a wson, J. J. C. , Cr e sser, M. S., and Billett, M. F.: Amethod f or measuring f ree CO2 i n u pland s treamwater usingheadspace analysis, J. H ydrol., 1 66,1-14, 19 9 5. ) ( Jassal,R. S., Webster, C., Black, T . A., Hawthorne, I., and Johnson,M. S.: Simultaneous Measurements of Soil CO2 and CH4 FluxesUsing Laser Absorption Spectroscopy, Ag r ic. En v iron. Lett., 1, 150014, https://doi.org/10.2134/ael2015.12.0014, 20 1 6. ) ( Joos, O.,Saurer, M., Heim, A., Hagedorn, F. , Schmidt, M. W. I., and Siegwolf, R. T . W.: C an w e use th e CO2 con c entrations deter- mined by continuous-flow isotope r a tio mass s p ectrometry fromsmall samples f or the Keeling plot approach?, Rapid Commun. Mass Sp., 22, 4029-4034,2008. ) ( Kerstel, E. R. T ., I annone, R. Q., C h enevier, M. , Kassi, S., Jos t , H. J., and Romanini, D .: A w ater isotope ( H, 1 7 0, a n d 18o) spectrometer based on optical f e edback cavity-enhanced abs o rp- tion for in situ airborne applications, Appl. Phys. B, 85,397-406, 2006. ) ( Leffler, A. J. and Welker, J. M.: Long-term i n creases in snow packelevate l eaf N a nd p h otosynthesis in Sa l ix arctica: re s ponses toa snow f ence experiment in the High Arctic of NW G reenland, Environ. R es. L ett., 8 ,025023, https://doi.org/10.1088/1748- 9326/8/2/025023,2013. ) ( Loose, B ., Stute, M., Alexander, P., and Smethie, W. M.: D esign and deployment of a p o rtable membrane equilibrator for s a m- pling aqueous dissolved gases, Water Resour. Res., 45, W00D34, https://doi.org/ 1 0.1029/2008WR006969,2009. ) ( McAlexander, W. I. , F e llers, R ., Owano, T. G . , and B a er, D . S.: Carbon isotope a nalysis of discrete CO2 samples r anging from 300 ppmv to 1 0 0 % using cavity enhanced laser absorption, Eu-ropean Geophysical U nion General Assembly, V i enna, Austria,2010. ) ( Midwood, A. J. and Millard, P: Challenges in measuring the 813c of the soi l surface CO2 efflux, Rapid Commun. Mass Sp., 25, 232-242,2011. ) ( Midwood, A. J. , T h ornton, B., a nd Millard, P : Measuring the 13ccontent of soil-respired CO2 u sing a novel open chamber system, Rapid Commun. Mass Sp., 22,2073-2081,2008. ) ( Munksgaard, N. C., Davies, K., Wurster, C. M ., B ass, A. M., and Bird, M. I : Field-based cavity ring-down spectrometry of 813c in soil-respired CO2, Isotopes Environ. Health Stud. , 49 , 232- 242,2013. ) ( Murtz, M. a nd Hering, P .: Cavity Ring-Down Spectroscopy f o r Medical A pplications, in: Cavity Ring-Down S pectroscopy, John Wiley & Sons Ltd., 213-235,2010. ) ( Nara, H., T animoto, H. , T o hjima, Y., Mukai, H. , No j iri, w· Y. , Katsumata, K ., a nd Rella, C . W.: E f fect of air composition(N2, 02, Ar, and H2O) on CO2 a nd C H4 m e asurement b y wavelength-scanned cavity r ing-down s p ectroscopy: calibration and m easurement strategy, Atmos. Meas. Te c h., 5, 2689-2701,https://doi.org/10.5194/amt-5-2689-2012,2012. ) ( Pang, J., Wen, X ., Sun, X ., a nd H uang, K.: I n tercomparison oftwo c avity ring-down s pectroscopy a nalyzers for atmospheric 13co2/12co2 m e asurement, Atmos. Meas. T e ch., 9, 3879- 3891, https://doi.org/10.5194/amt-9-3879-2016,2016. ) ( Picarro: WS-CRDS for Isotopes - Cost of Measurement Compari-son with I RMS for Liquid Wa t er, Pi c arro In c ., S u nnyvale, Cali-fornia, USA, 2009. ) ( Picarro: Picarro G2131-i813C High-Precision Isotopic CO2 CRDS Analyzer, Picarro Inc., Santa Clara, California, USA, 2 0 11. ) ( Picarro: Picarro A0314 Small S a mple Is o tope Mo d ule 2, Pic a rro Inc., Santa Clara, California, USA, 2 013. ) ( Picarro: G2131-i Analyser f o r Isotopic CO2 User’s Guide, Pi c arro I nc., Santa Clara, California, USA, 2 0 12. ) ( Picarro: Picarro G2201-i C RDS An a lyzer for Isotopic Carbon in CO2 a n d CH4, Picarro In c ., Santa Clara, California, USA, 2015. ) ( R Core T eam: R: A Language Environment fo r Statistical Com-puting, R Foundation for Statistical Computing, Vienna, Austria,2015. ) ( Ramlow, M. a nd C otrufo, M. F: Woody biochar’s greenhousegas m itigation potential across fertilized an d unf e rtilized agri- cultura l soil s and soil moisture regimes, GCB Bioenergy, https://doi.org/10.1111/gcbb.12474, online first, 2017. ) ( Rella,C.: A ccurate stable carbon isotope ratio measurements in hu- mid gas streams u s ing t h e P i carro 813co2 G2101-i gas analyzer, Picarro Inc., Sunnyvale, California,USA, 2010a. ) ( Rella, C.: Accurate stable carbon isotope ratio measurements withrapidly varying carbon dioxide concentrations using t h e Picarro 8 13CO2 G2101 - i gas analyzer, Pi c arro In c ., S u nnyvale, Califor- nia,USA, 2010b. ) ( Rella, C.: Reduced drift, high a ccuracy stable c arbon i s otope r a - tio measurements using a reference gas with the Picarro 8CO2G2101-i gas a n alyzer, P i carro Inc., S unnyvale, C a lifornia, USA,2010c. ) ( Rella, C. W., Chen, H., Andrews, A. E . , Filges, A ., G erbig, C ., Hatakka, J., K arion, A., Miles, N . L., R i chardson, S. J., Stein-bacher, M. , Sweeney, C., W astine, B ., and Z ellweger, C .: High accuracy m easurements of dry mole fr a ctions of carbon diox- ide and methane i n humid air, Atmos. Meas. Tech., 6, 837-860, https://doi.org/10.5194/amt-6-837-2013,2013. ) ( Sigrist, M.W., Bartlome,R., Marinov, D., Rey, J. M., Vogler,D. E., and Wachter, H.: Trace gas monitoring with infrared laser-based detection schemes, Appl. Phys. B, 90, 289-300,2008. ) ( Snell, H. S. K. , Robinson, D ., a nd Midwood, A. J.: Minimising methodological b iases t o i mprove t h e accuracy o f partitioning soil respiration usi n g natural abundance 13C, Rapid Commun. Mass Sp., 28,2341-2351,2014. ) ( Sowers, T., B ernard, S., A ballain, O ., Chappellaz, J . , B arnola, J. M., and M arik, T : R e cords o f the 813c of at m o- spheric CH4 o v er t h e l a st 2 centuries a s recorded in Antarc-tic snow and i ce, Global Biogeochem. Cy., 19,GB2002, https://doi.org/10.1029/2004GB002408,2005. ) ( Stowasser, C., Buizert, C., Gkinis, V., Chappellaz, J., Schiipbach,S., Bigler, M., Fain, X., Sperlich, P. , Baumgartner, M., S chilt, A., and Blunier, T.: Continuous measurements of methane mix- ing ratios from ice cores, Atmos. Meas. T ech., 5 , 999-1013, https://doi.org/10.5194/amt-5-999-2012,2012. ) ( Stowasser, C., Farinas, A . D., Ware, J., Wistisen, D. W., Rel l a, C., Wahl, E., Crosson, E., and B lunier,T . : A low-volume cavity ring- down spectrometer fo r sample-limited applications, Appl. Phy s . B, 116,255-270, 2 014. ) ( Sumner, A . L . , H a nft, E . , Dindal, A., and M c Kernan, J.: Is o topic Carbon Dioxide Analyzers For Carbon Sequestration MonitoringPicarro Cavity Ring-Down Spectroscopy Analyzer For Isotopic CO2-ModelG1101-i, Battelle Memorial Institute, Environmen- tal Technology Verification R eport 600F11053, 201 1 . ) ( Vogel,F . R., Huang, L.,Er n st, D.,Giroux, L., Racki, S., and Worthy, D. E .J.: E valuation o f a c avity ring-down spectrometer for in situ observation s of 13Co2, Atmos. Meas. Tech., 6, 301-308, https://doi.org/10.5194/amt-6-301-2013, 2013. ) ( Wahl, E. H., Fidric, B ., Rella, C. W., K oulikov, S., K harlamov, B., T an, S., Kachanov,A. A., Richman, B . A.,Crosson,E. R., Paldus,B. A., Kalaskar, S., and Bowling, D . R.: A pplications of cavity ring-down s p ectroscopy to high precision is o tope ratio measure-ment of 13c 12c i n carbon dioxide, I sotopes Environ. Health Stud.,42,21-35,2006. ) ( Wang, C., M iller, G. P., and Winstead, C. B.: Cavity RingdownLaser Absorption Spectroscopy, in: Encyclopedia o f AnalyticalChemistry, J ohn Wiley & Sons Lt d ., 2 0 08. ) ( Wang, J . -L., Jacobson, G., Rella, C. W. , Chang, C.-Y., Liu, I., L iu , W.-T., Chew, C ., Ou-Yang, C . -F., L iao, W .- C ., and C hang, C.-C.: Flask sample measurements for CO2, CH4 and CO using cavity ring-down s pectrometry, A tmos. M e as. Te c h. Di s cuss.,https://doi.org/10.5194/amtd-6-7633-2013,2013. ) ( Wen, X.-F., Meng, Y . , Zhang, X . -Y., Sun, X . -M., a nd Lee, X.:Evaluating c a libration strategies for isotope ra t io infrared sp e c- troscopy for atmospheric 3co12co, mea s urement, Atm o s. Meas. Tech., 6, 1491-1501,h t tps://doi.org/10.5194/amt-6-1491-2013,2013. ) ( Werner, R. A. and B rand, W. A.: Referencing s t rategies and tech-niques i n stable isotope ratio analysis, Rapid Commun.Mass Sp.,15,501-519,2001. ) ( Zeeman, M . J . ,W e rner, R. A., Eugster, W. Si e gwolf, R. T. W., Wehrle, G., Mohn, J., and B uchmann, N.: Optimization of au t o- mated gas sample collection and isotope ratio mass spectromet-ric analysis of 813c o f CO2 i n air, Rapid Commun. Mass Sp., 22, 3883-3892,2008. ) Zhu, C., Byrd, R. H., Lu, P., and Nocedal, J.: Algorithm 778: L-BFGS-B: Fortran subroutines for large-scale bound-constrainedoptimization,ACM T. Math. Software, 23,550-560,1997. Published by Copernicus Publications on behalf of the European Geosciences Union. Atmos.Meas. Tech., www.atmos-meas-tech.net/
关闭-
1/13
-
2/13
还剩11页未读,是否继续阅读?
继续免费阅读全文产品配置单
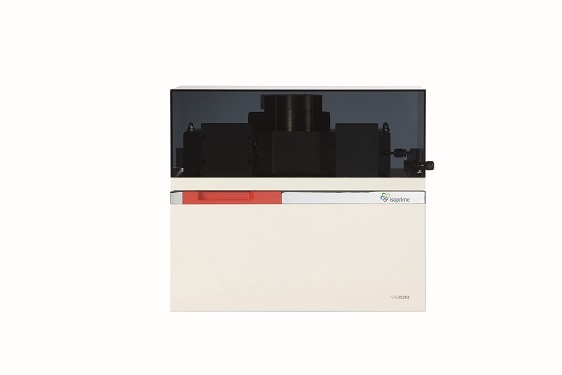
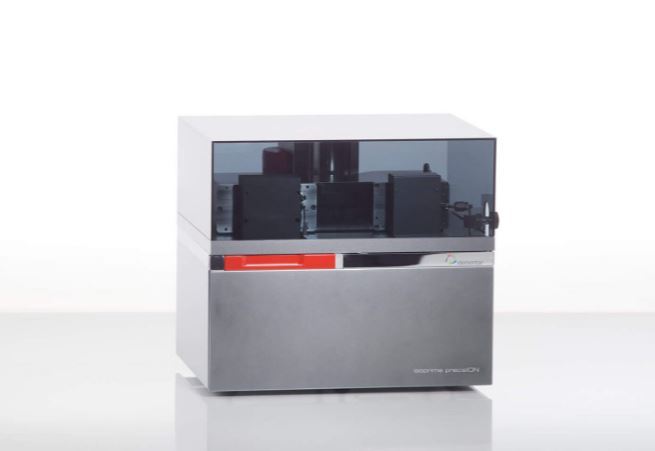
北京世纪朝阳科技发展有限公司为您提供《大气中δ13C–CO2 xCO2检测方案(多气体分析仪)》,该方案主要用于空气中分子态无机污染物检测,参考标准《暂无》,《大气中δ13C–CO2 xCO2检测方案(多气体分析仪)》用到的仪器有Picarro G2131-i 高精度CO2碳同位素和气体浓度分析仪。
我要纠错
相关方案
 咨询
咨询