方案详情文
智能文字提取功能测试中
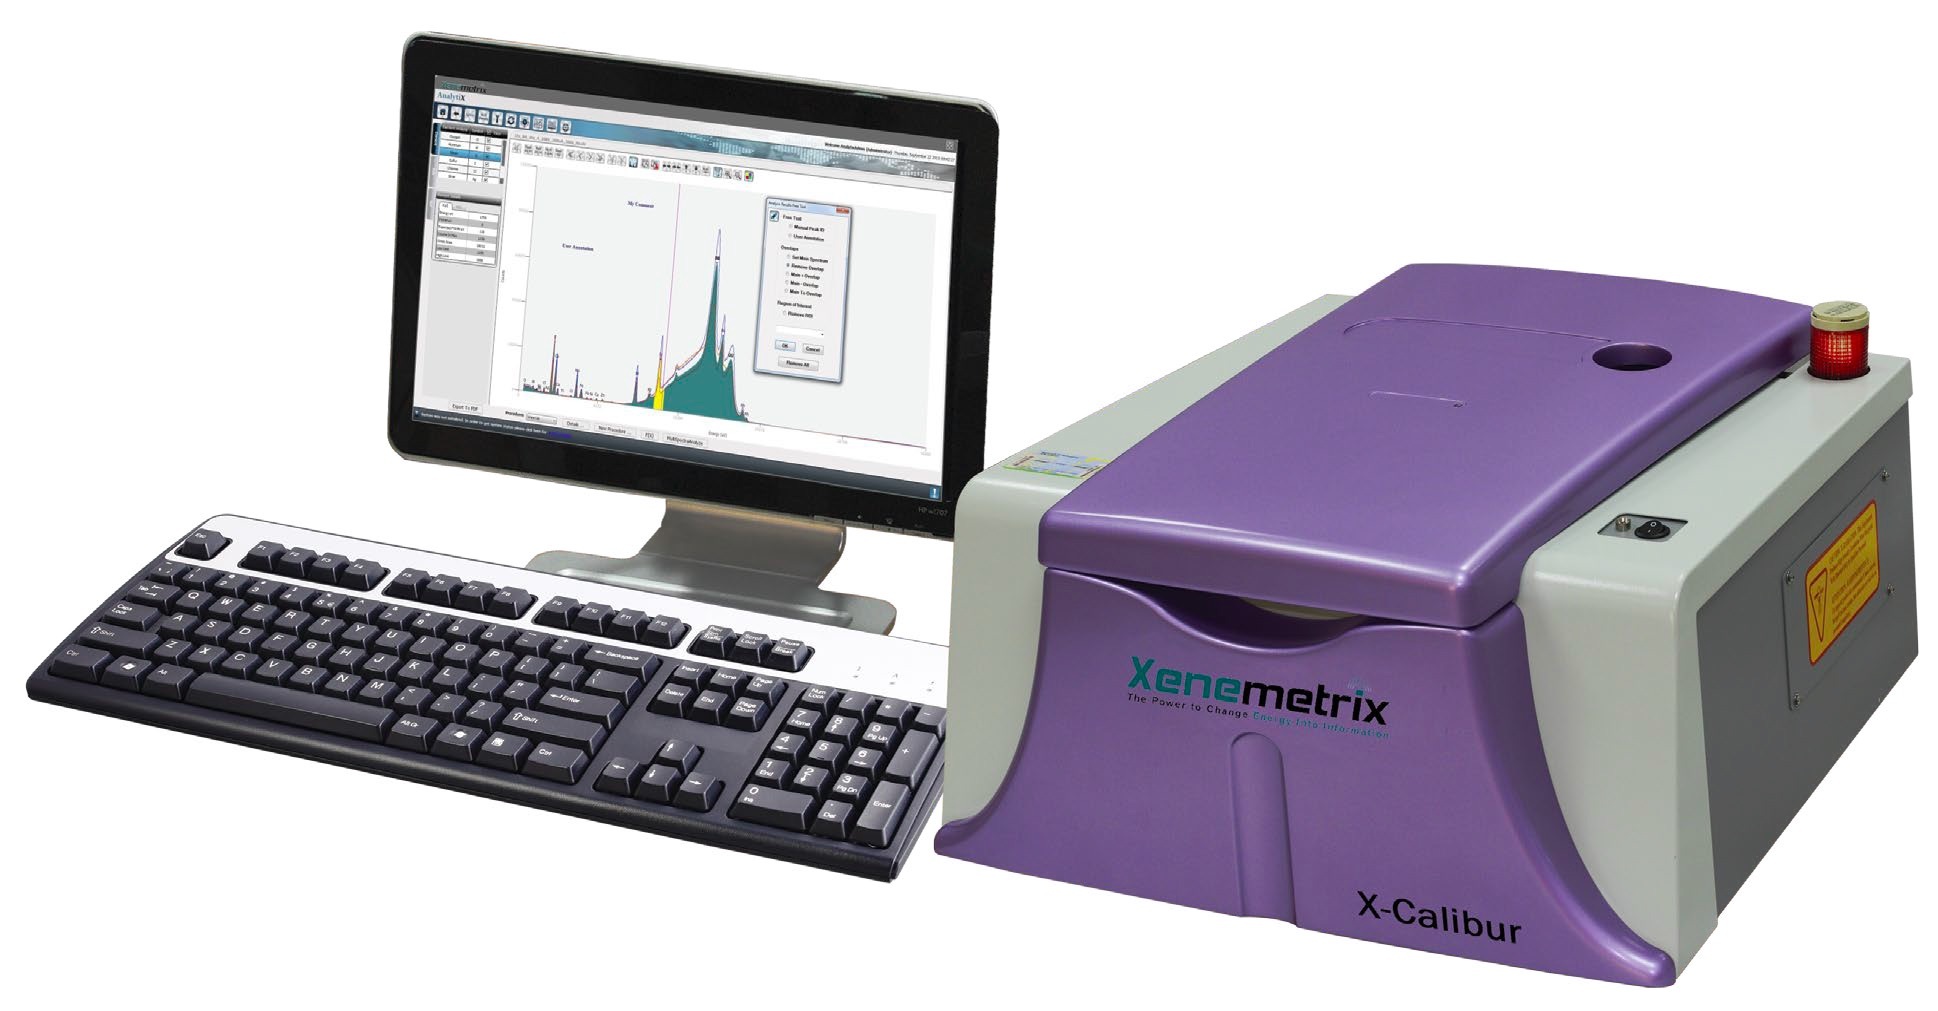
The Power to Change Energy Into Information Xenemetrix Application Note#XE-2016-3324 Quantitative elemental analysis of oxides in cegentpowder performed on the EDXRF Analyzer Limor Halay, M.Sc.Xenemetrix LTD. April 2016 Executive summz Eight type of samples frohtnacemerit prodaction process were received. Each sample type had sixunknown samples for a quantitatve elemental analysis by Energy Dispersive X-ray Fluorescence (ED-XRF) technigye:Ime stone, rawill,in feed, clinker, grinding OPC, packing OPC, grinding PPC, andpacking Ppe fhlepurposeco is application was to determine the different oxides concentrations incement to a high degree:if accuracy and precision. 13 standard samples analysed by wet chemistrywore seht by theclient and used to calibrate X-Calibur SDD for OPC, PPC and clinker samples. Onecertified limestone standard from NIST was used for limestone, raw mill and kiln feed calibration. Allmeasurements except Cl were performed in helium atmosphere to promote the signals from the lightoxides (Na-Si). The chemical compositions of the sample were analysed successfully after performinga simple and fast measurement using the Xenemetrix X-Calibur Bench-top system. The analysedresults are described herein. Xenemetrix 1. Introduction The X-Calibur is an excellent bench-top EDXRF analyzer for qualitative and quantitative elementalanalysis. It offers an accurate, precise, fast, simple and non-destructive analysis technique well suitedfor the quantitative analysis of elements in different types of samples. The X-Calibur emNoys state-of-the-art closed coupled optics, which enable a very powerful and count efficlentanalysis. The highcount rate is translated into excellent precision and low detection levels of all elements. In order to quantitatively establish the elemental composition of the unoyn samples out of the netcounts of each one of the peaks in the spectrum, we choose themost suitable analysis method. Themethod that was chosen here is regression with inter blements eeffectwhich allow us to havequantitative results including the interactions of the deteotabletlements in the matrix. 2.Objective Analyse the different oxides; SiO2,Al2O3,Fe2O3,Cao,Mgo,SCKa iNazO, P2Os, in cement powder sample. 3.Experimental 3.1. Equipment any neasurement Paramgters All measurements were conducted on Xenemetrix X-Calibur tool equipped with a Silicon Drift Detector(SDD). Direct exctation was used to.aanaryse all elements. A Ti filter was used in the analysis of Cl. Themeasurementdarametexsare cummarized in table 1. Xenemetrix Instrument Configuration X-Calibur, Rh Anode x-ray tube,50kV,50W Detector Silicon drift detector Atmosphere Helium Excitation mode Direct excitation with Ti tube filter for Cl analysis Acquisition time 300 sec , 600 sec for Cl and Na analysis Analysis method Regression Table 1: measurement parameters 3.2.Sample preparation No sam preparation was required. The powder samplesvere analysed as is". 4.Results 4.1. Qualitative analysis The spectrum shown in figure 1 descibes the identiledelemants found in the unknown sample. Zoomin sx 息有信技器仪科灵成捷一 Si Ca Rh Rh K Cr Mn FeAl Mg CaTi Ti Cr Fe Figure 1: XRF spectrum using direct excitation with 10kV during 300sec acquisition timeof cement powder sample Xenemetrix Figure 2: XRF spectrum using direct excitation with Tifiker 20ky during 600sec acquisition timeNTement powder sable 4.2.Quantitative analysis Quantitative analysis results of the unknowsamples are presented in the tables below. In eachtable there is a range of vales set by the lientspec.The standard deviation was calculated from10 consecutive measwements on the-same sample without moving it in between the acquisitions.The standard deviadjn obtained yes mhinor for all elements and is presented in table No.11 inparagraph 4.3 time storxawmill, Kiln feed Lime stone, Ray mill and Kiln feed samples were analysed according to lime stone NIST standard1C. SiO2 K20 Na2O MgO CaO Al2O3 Fe203 Range by client [7-151 [0.1-11 [0.1-11 [0.8-1.81 [40-501 [0.5-31 [0.3-2] Sample No.1 11.73 0.20 0.01 1.02 42.53 0.91 0.51 Sample No.2 12.20 0.21 0.03 0.92 43.66 0.94 0.52 Sample No.3 12.45 0.21 0.03 0.98 44.53 0.96 0.53 Sample No.4 12.08 0.19 1.02 42.28 0.93 0.50 Sample No.5 11.94 0.93 41.56 0.49 Table 2: Analysis results ofthe lime stone samples Xenemetrix RAW MILL SiO2 K20 Na20 MgO Cao AI203 Fe203 Range by client [7-15] [0.1-1] 0.1-11 [0.8-1-81 40-50 [2-5] [2-51 Sample No.1 12.66 0.28 0.02 0.74 40.51 1.44 2.564 Sample No.2 12.93 0.28 0.01 0.77 40.34 151 2.709 Sample No.3 13.26 0.29 0 0.86 41.03 2.668 Sample No.4 12.21 0.22 0.01 0.79 37.52 2.450 Sample No.5 12.10 0.20 0.01 0.71 36.59- 1.38 2.565 Sample No.6 13.00 0.23 0 0.83 1.51 2.503 Table 3: Analysis results of the raw mi1l16 KILN FEED SiO2 K20 NasO MgQ Cao Al203 Fe203 Range by client Sample No.1 9.97 0.29 0.01 56 37.45 1.17 2.06 Sample No.2 11.15 0.04 0.37 37.79 1.39 2.17 Sample No.3 12.37 0.5 0.87 38.59 1.52 2.23 Sample No.4 119 0.28 0.02 0.70 38.32 1.44 2.17 Sample No.5 0.25 105 0.68 36.81 1.42 2.14 Sample No.6 96 026 b.02 0.79 37.19 1.46 2.22 able 4. yalyss results of kiln feed samples The NIST standard 1C doesn't have any SO3 oxide in it therefore the 13 standards of clinker wereused to analyserthe SO3 oxidein lime stone, raw mill and kiln feed. CESTONE SC3 Range by client 10.1-1] Sample No.1 0.47 Sample No.2 0.40 Sample No.3 0.39 Sample No.4 0.49 Sample No.5 0.55 RAW MILL SO3 Range by client 0.1-11 Sample No.1 0.38 Sample No.2 0.38 Sample No.3 0.39 Sample No.4 0.52 Sample No.5 0.35 Sample No.6 0.52 KILN FEED SO3 Range by client 0.1-11 Sample No.1 0.47 Sample No.2 0.46 Sample No.3 0.45 Sample No.4 0.53 Sample No.5 0.58 Sample No.6 0.55 Table 5: Analysis results for SO3 oxide in lime stone, raw mill and kiln feed samples Xenemetrix 4.2.2. Clinker, OPC grinding, OPC packing, PPC grinding, PPC Packing Clinker, OPC grinding, OPC packing, PPC grinding and PPC Packing samples were analysedaccording to 13 standards samples (clinker) that were sent by the client. CLINKER SAMPLES SiO2 K2O Na2O SO3 MgO CaO Fe203 CI Range by client [18-241 10.1-11 [0.1-11 10.3-1.51 [0.6-21 61.5-67 [26.5] [2.5-61 10.01-0.51 Sample No.1 22.87 0.47 0.13 2.76 1.20 3.80 3.69 0.00 Sample No.2 22.87 0.48 0.13 2.80 1.18 62.37 3.73 3.91 0.006 Sample No.3 22.96 0.48 0.12 2.80 1.19/ 62.19 3.73 3.85 0.00 Sample No.4 22.95 0.49 0.13 2.79 62.34 3.92 3.89 0.00 Sample No.5 23.34 0.47 0.12 2.68 61.56 3.68 3.66 0.00 Sample No.6 23.28 0.47 0.12 2.63 1.18 61.33 3.52 3.51 0.00 Table 6: Analysis xesults ofchnker samoles RINDINGOPC SiO2 MgO CaO Al2O: Fe2O3 CI Range by client [18-24] 10.1-21 [57-641 [2-5.51 [2.5-6] 10.01-0.51 Sample No.1 0.12 3.08 0.95 61.23 3.77 3.50 Sample No.2 2153 0.N 2.64 0.96 61.13 3.29 3.40 0.008 Sample No.3 012 2.88 0.97 61.83 3.86 3.49 0 Sample No.4 22.1 0.44 6.12 2.77 1.04 3.77 3.38 0.005 Sample No.5 22.90 X44 0.12 2.67 1.03 60.63 3.69 3.13 Sample No.6 22.78 0.44 0.12 2.74 1.03 61.07 3.71 3.29 0 MgO [57-641 22.18 0.14 1.77 3.74 0.45 4.63 61.26 3.63 PACKING OPC SiO2 K2O Na2O SO3 CaO Al2O3 Fe203 CI Range by client [18-241 [0.1-11 [0.1-11 [1-3.51 0.1-21 [2-5.51 [2.5-61 0.01-0.51 Sample No.1 22.17 0.50 1.93 1.31 62.23 4.63 3.86 0.02 Sample No.2 21.55 0.47 0.12 1.20 61.23 3.44 0.02 Sample No.3 21.81 0.51 0.14 2.03 1.33 62.11 3.74 0.02 Sample No.4 22.38 0.49 0.13 1.91 1.29 61.61 4.47 0.03 Sample No.5 22.50 0.48 0.14 1.84 1.32 61.19 4.36 3.50 0.02 Sample No.6 22.41 0.48 0.13 1.90 1.33 61.55 4.40 3.63 0.02 Table 8: Analysis results of packing OPC samples Xenemetrix GRINDING PPC SiO2 K2O Na2O SO3 Mg0 CaO Al2O3 Fe203 Range by client [25-351 [0.1-11 [0.1-11 [1-3] 10.8-1.81 [43-501 18-12 [3-6] Sample No.1 24.39 0.55 0.22 0.93 1.24 56.41 9.24 4.32 Sample No.2 24.57 0.57 0.24 0.93 1.23 56.55 9.97 4.56 Sample No.3 24.99 0.61 0.28 0.92 1.36 56.99 12.40 4.76 Sample No.4 25.00 0.58 0.27 0.91 1.28 56.00 11.76 4.47 Sample No.5 25.22 0.57 0.26 0.90 56.28 11.61 4.30 Sample No.6 25.04 0.58 0.27 0.91 56.64 11.89 4.48 Table 9: Analysis results of grinding PPC soinples [0.8-1.8] PACKING PPC Fe203 SiO2 K2O Na20 8-121 [3-6] Range by client [25-351 [0.1-1] [0.1-11 12.60 4.91 Sample No.1 24.54 0.62 0.28 9.46 4.44 Sample No.2 24.30 0.56 023 12.29 4.75 Sample No.3 24.72 0.62 .28 1 4.60 Sample No.4 24.64 0.27 11.46 4.32 Sample No.5 24.87 0.26 11.97 4.57 Sample No.6 24.69 Taple 10AnalysisAesunslof packing PPC samples器仪成限捷宁 Xenemetrix 4.3. Precision In order to evaluate to precision of the EDXRF in the cement samples, a sample at the same spotwas measured consecutively 10 times. The dispersion of results, i.e. the standard deviation wascalculated per element and the results are presented in Table No.11 Element SiO2 K20 Na20 SO3 MgO CaO 3 Fe203 23.03% 0.41% 0.11% 2.68% 1.00% 59.65% 8.24% 2.77% 23.13% 0.41% 0.11% 2.67% 1.03% 3.33% 2.81% 23.10% 0.42% 0.11% 2.67% 1.00 55971% 3.38% 2.80% 23.08% 0.42% 0.11% 2.72% 1.05% 59.72% 3.37% 2.82% 23.11% 0.42% 0.11% 2.67% 1.03% 59.70% 3.38% 2.81% 23.12% 0.42% 0.11% 2.719 M100% 9972 3.36% 2.81% 23.09% 0.42% 0.11% 2.68% 0.99% 559.79% 3.37% 2.82% 23.06% 0.41% 0.11% 2.73% 0.99% 5977% 3.42% 2.82% 23.07% 0.42% 0.11 2.68% 201% 59.73% 3.40% 2.82% 23.08% 0.42% 0.11% 2.69% 001% 59.69% 3.39% 2.82% Average 23.09% 0.42% 11% 2.69% 1.01% 59.71% 3.36% 2.81% STD 0.029 0.003 0.001 0.022 0.033 0.050 0.015 RSD 0.13% 0.83% 0.96% 0.81% 2.16% 0.06% 1.47% 0.54% Table A:10medy.rements.Xxmming OPC Sample in the same spot 5. Conclusions "All ofthe measured concentrations received for the samples fit to the expected concentrationKL P20 oxide was not present in the standards supplied by the client and could not be quantified.In order to calibrate the system, it is better to use standards of the same matrix as theunknown samples. Since the only received standards were of clinker type, they were used forall samples of clinker type. A NIST lime stone sample was used for all samples from the limestone to Kiln feed in the cement process. To improve the accuracy of the results it is recommended to use more than one standard. Xenemetrix 6.Summarv ED-XRF is a fast and non-destructive technique that can quantify any type of sample: solid, powderor liquid, within a few minutes. ED-XRF spectrometers can play an important role in assuring thatconsistent quality of samples is retained throughout a manufacturing process. ED-XRF is an ideal method for elemental analysis offering the following advantages: √Minimal sample preparation √ Fast and automated analysis process √ Limited or no exposure to corrosive reagents used by otheranalyical techniques √ Ease of use for operation by non-technical or non-specialized personnel. Xenemetrix The Power to Change Energy Into Informatios Ramat Gabriel Industrial Zone, 6 Hatikshoret St., IMigdaHaemek2310901, Israel Email: info@xenemetrix.com Web:www.xenemetrix.com Tel: +972-4-9891313 Fax: +972-4-9891323 www linkedlin.com/comsany/xenemetrix-ltd. w.w.facebook.coox/Xenemetrix yuaa www.youtube.comyuser/Xenemetrix Application Note # XE- 通过使用Xenemetrix公司的X-Calibur能量色散X射线荧光光谱仪对水泥粉末样品进行定量分析,对样品不做任何前处理,并定量分析样品中的各种氧化物含量。所得数据可看出X-Calibur产品在生产行业中的应用前景,并能快速准确的对样品进行定性定量分析,展现了Xenemetrix公司产品的出色性能。
关闭-
1/9
-
2/9
还剩7页未读,是否继续阅读?
继续免费阅读全文产品配置单
辽宁捷成科技有限公司为您提供《水泥粉末样品中氧化物检测方案(能散型XRF)》,该方案主要用于水泥/混凝土中氧化物检测,参考标准《暂无》,《水泥粉末样品中氧化物检测方案(能散型XRF)》用到的仪器有Xenemetrix 能量色散X射线荧光光谱仪 X-Calibur。
我要纠错
推荐专场
X荧光光谱、XRF(能量色散型X荧光光谱仪)
更多

相关方案
 咨询
咨询