

方案详情文
智能文字提取功能测试中
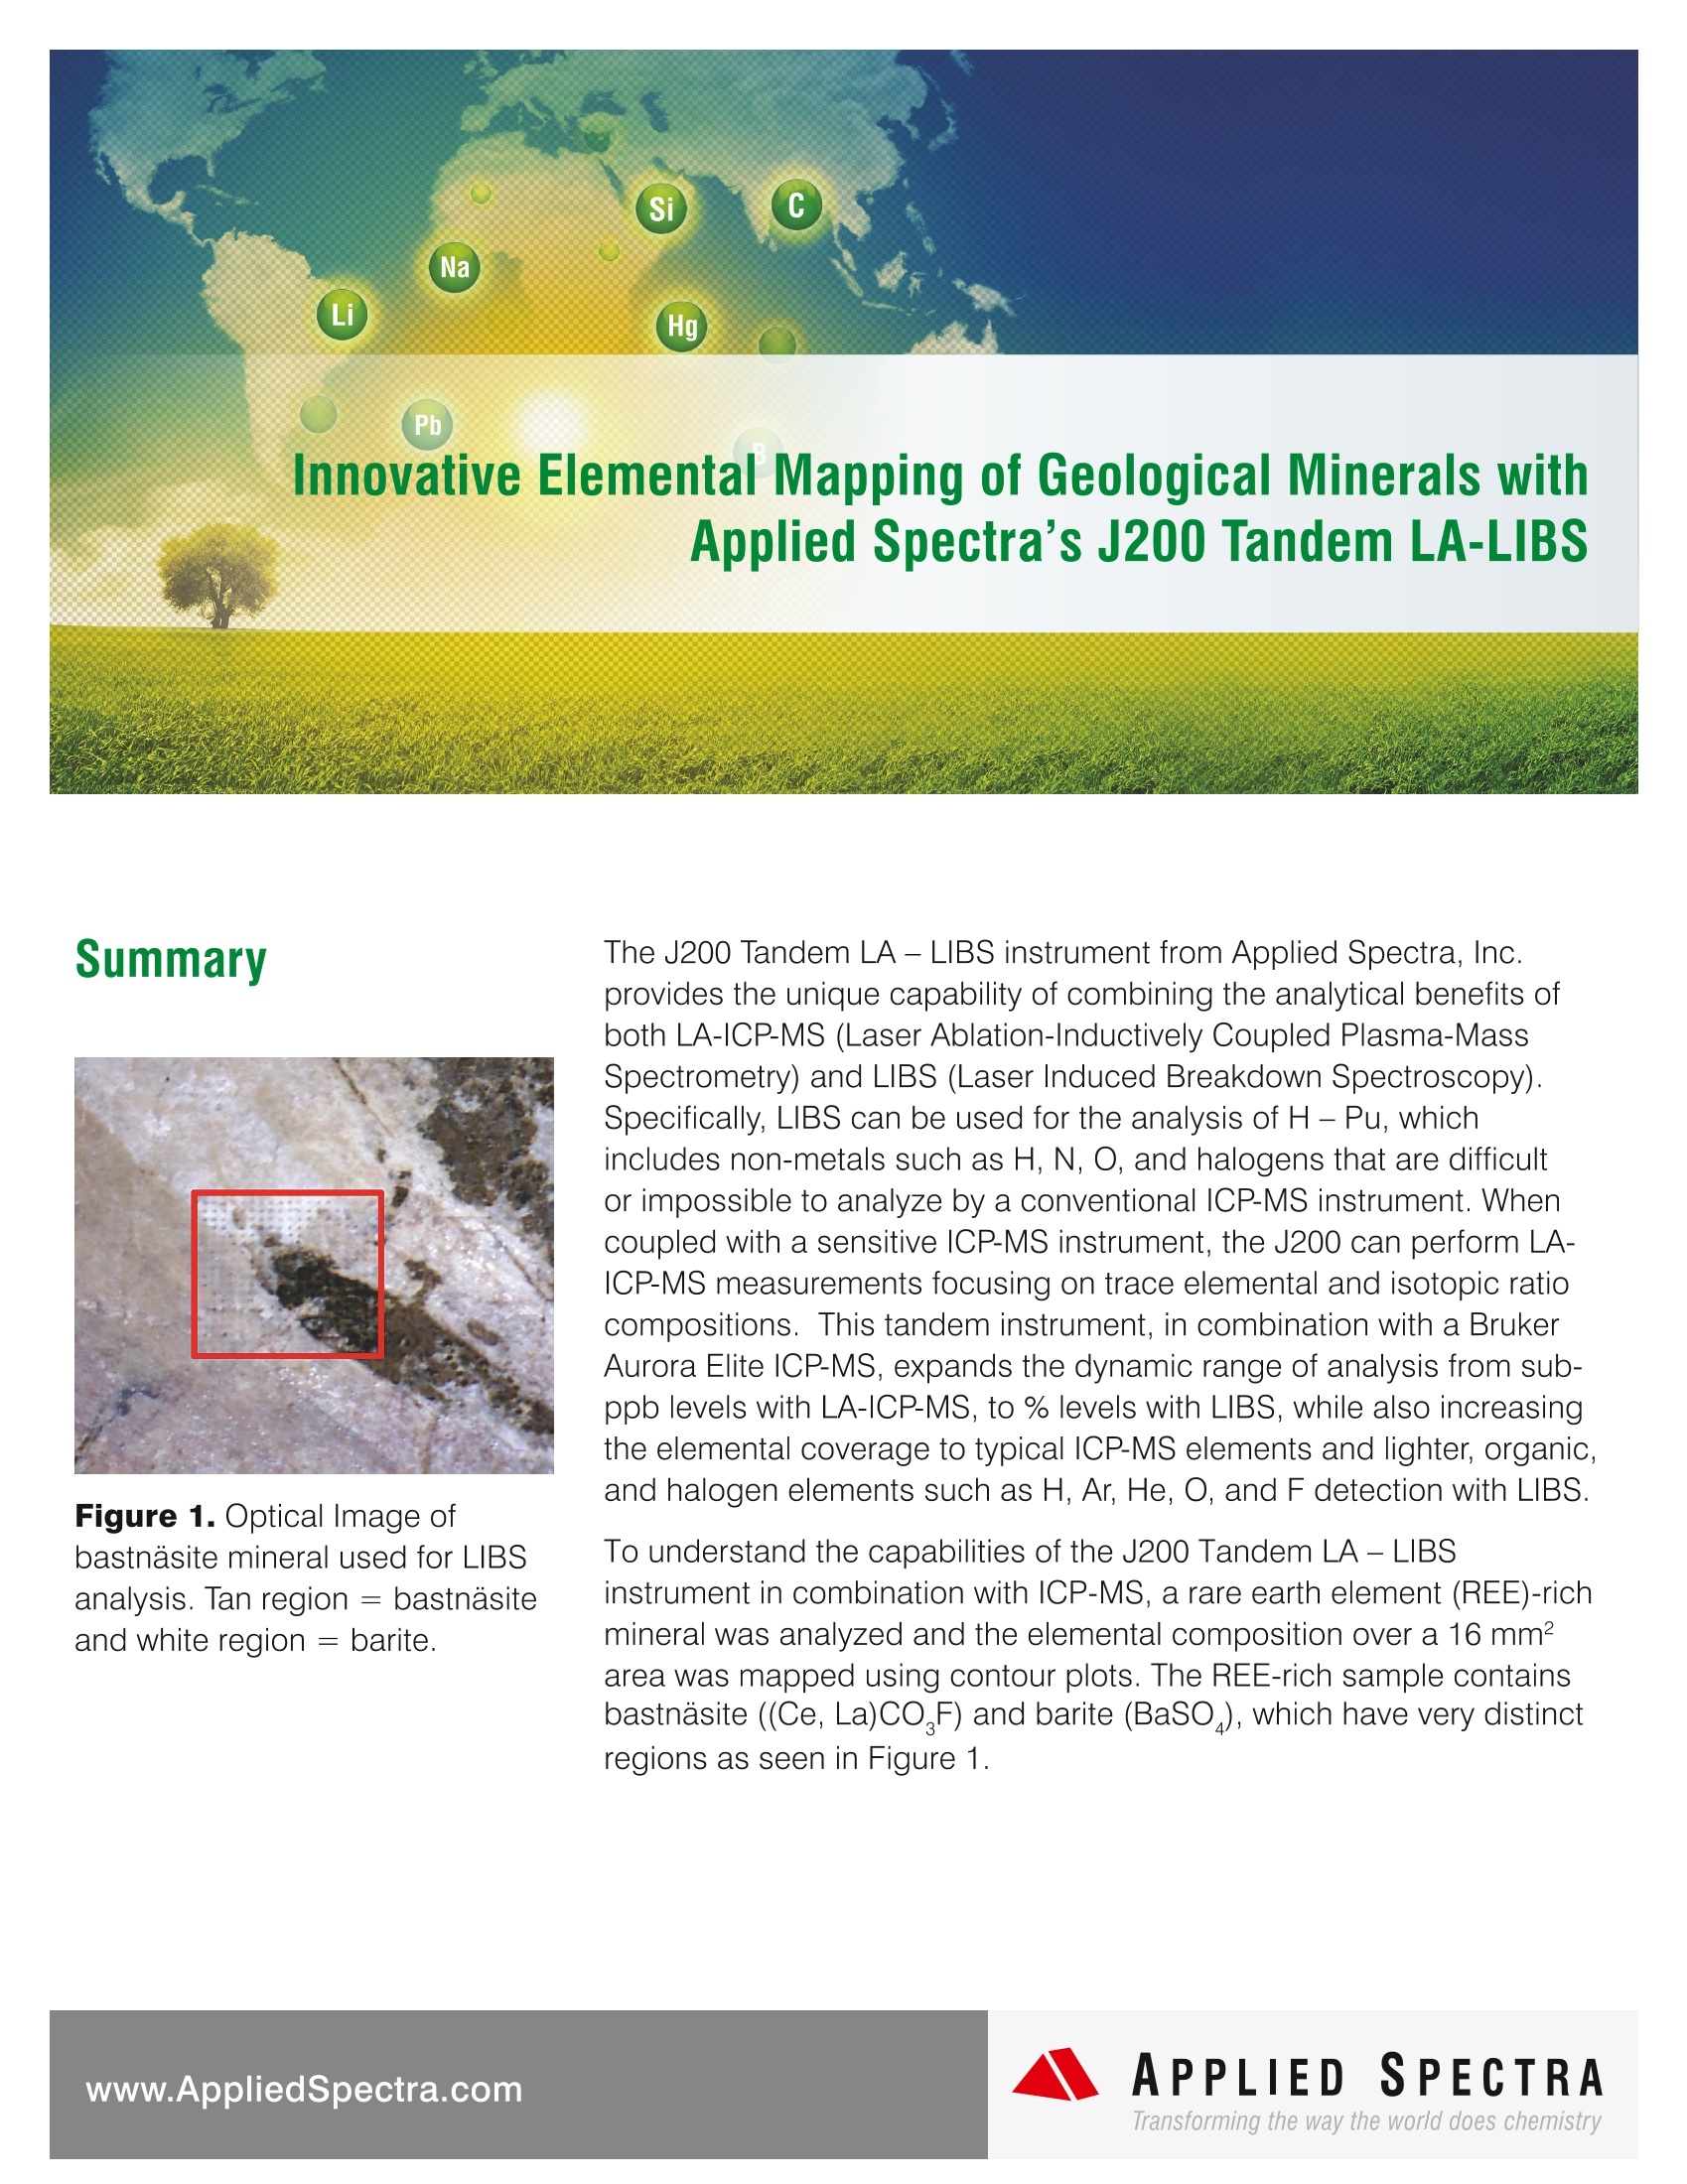
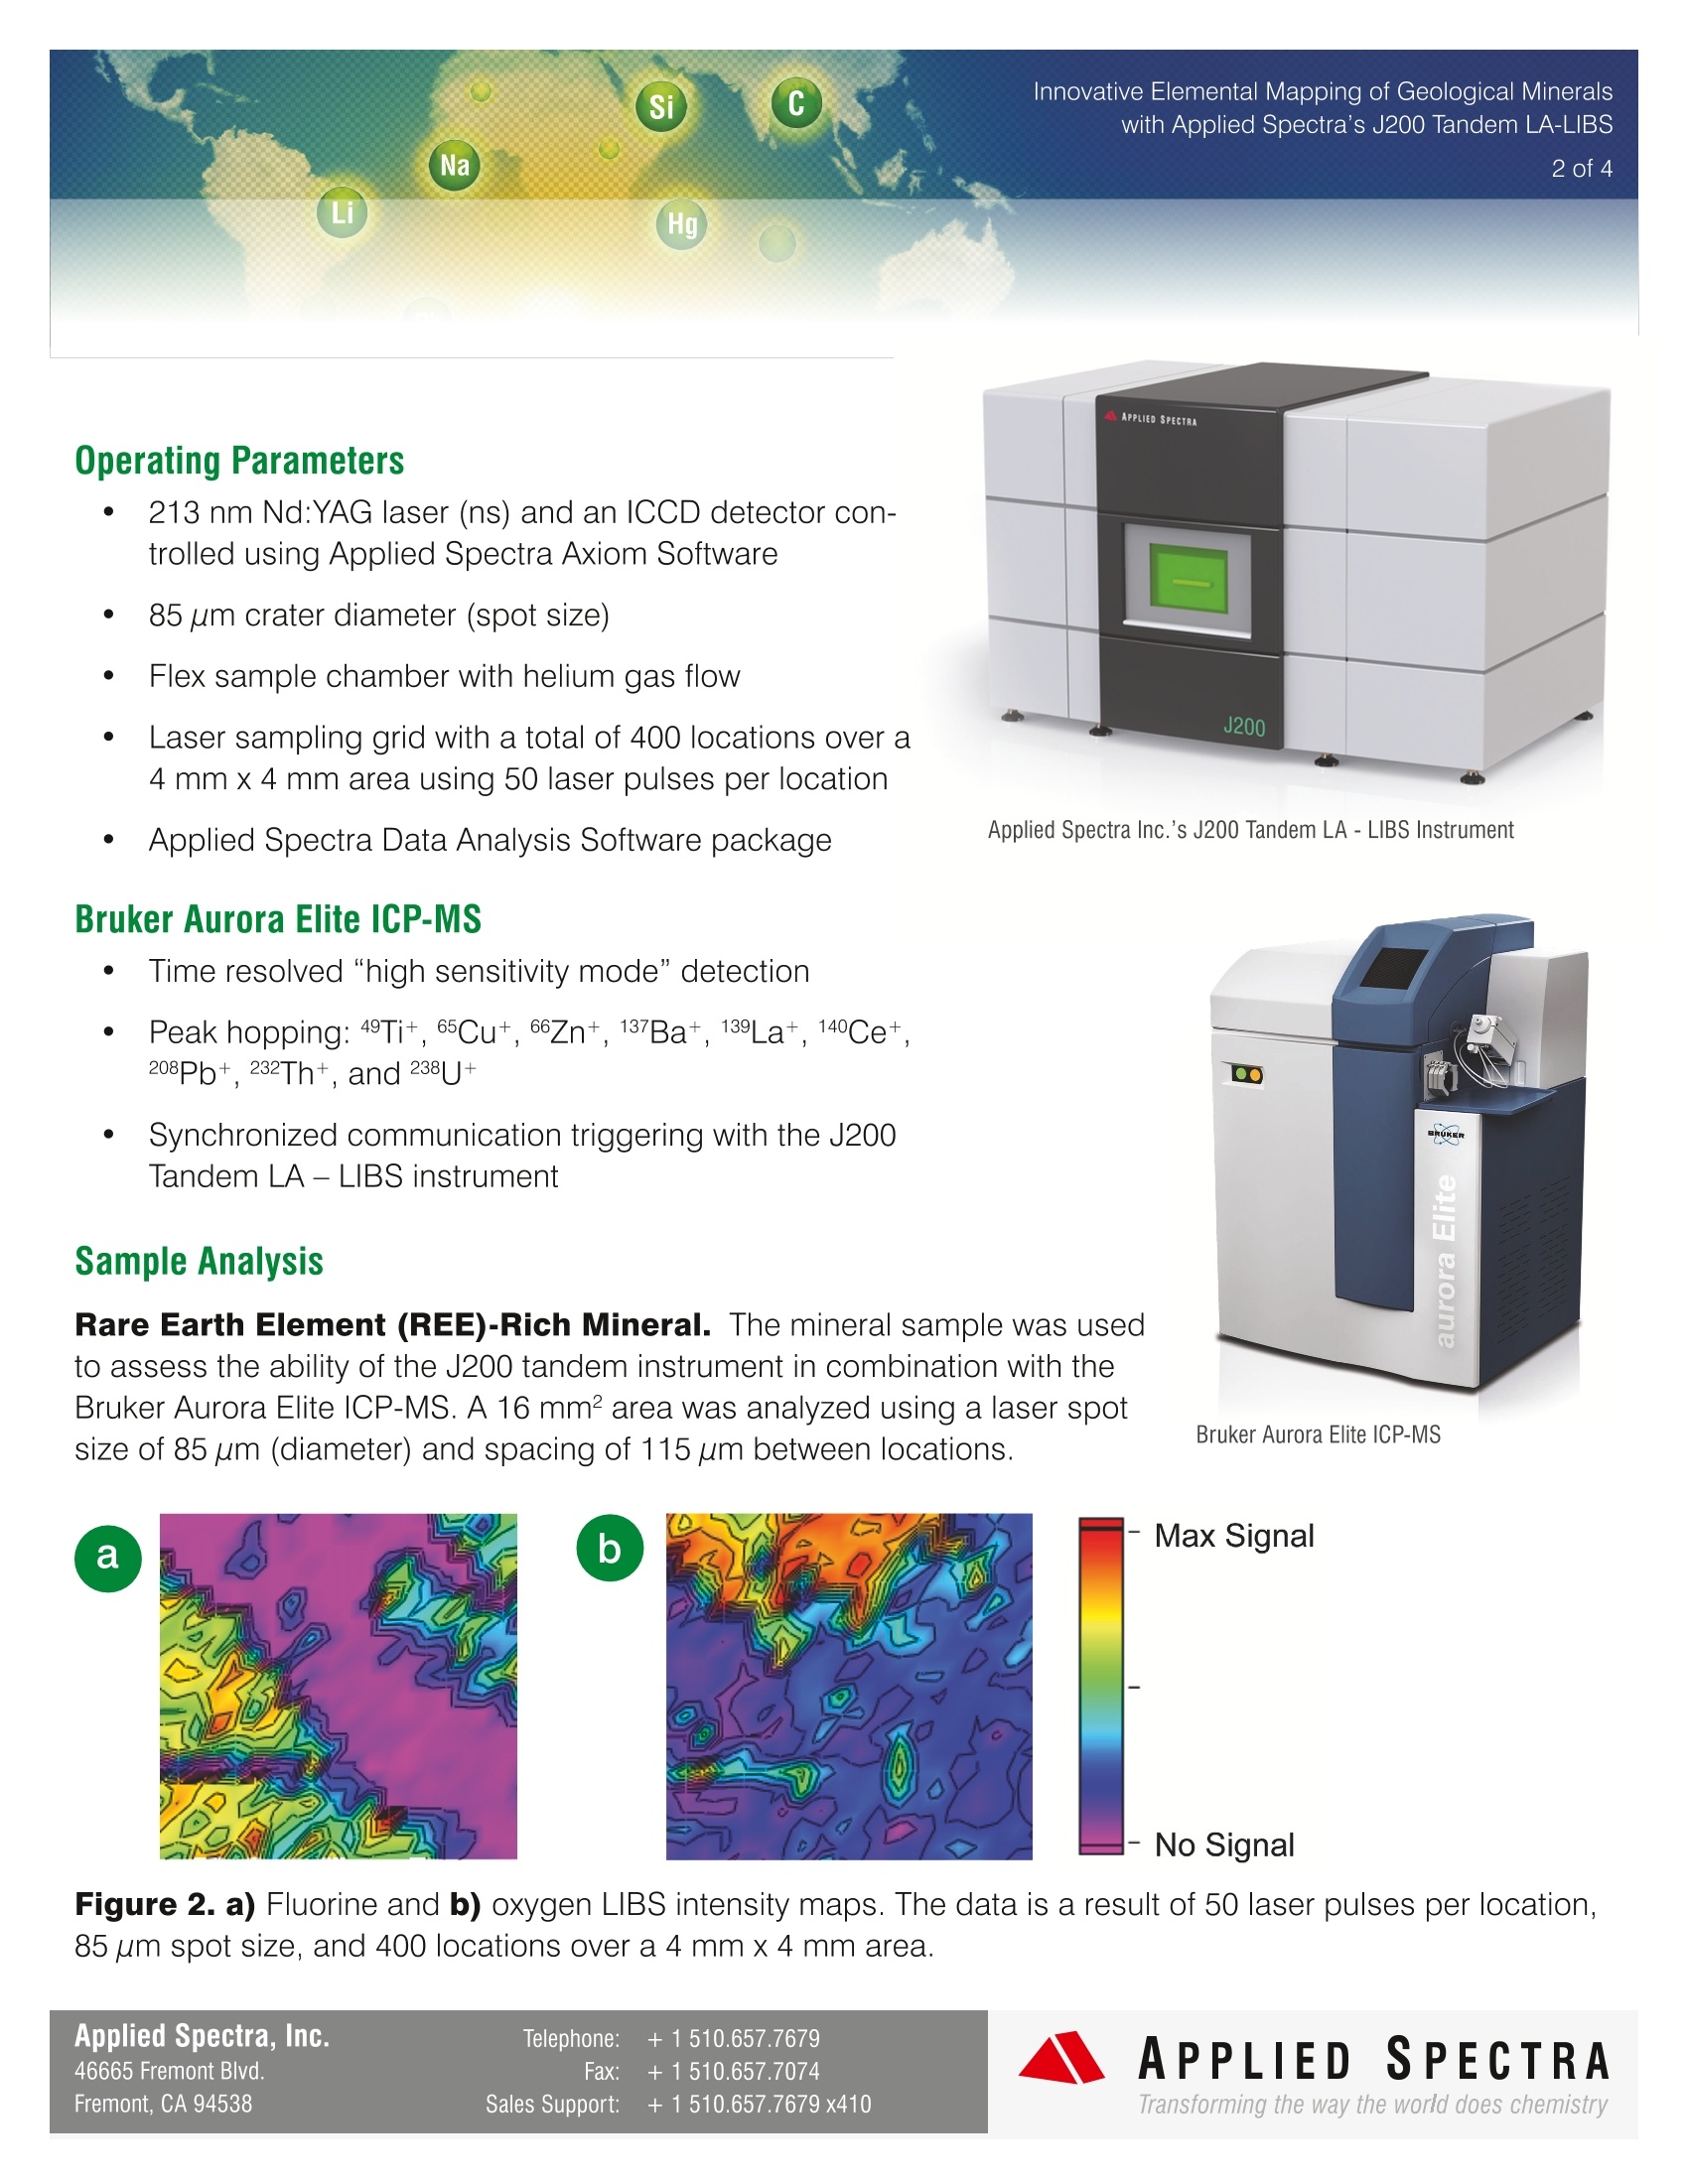
2 of 4 Innovative Elemental Mapping of Geological Mineralswith Applied Spectra's J200 Tandem LA-LIBS3 of 4 APPLIED SPECTRAwww.AppliedSpectra.comTransforming the way the world does chemistry Si C Na Li Hg Pb Innovative Elemental Mapping of Geological Minerals withApplied Spectra's J200 Tandem LA-LIBS Figure 1. Optical Image ofbastnasite mineral used for LIBSanalysis. Tan region = bastnasiteand white region = barite. The J200 Tandem LA - LIBS instrument from Applied Spectra, Inc.provides the unique capability of combining the analytical benefits ofboth LA-ICP-MS (Laser Ablation-Inductively Coupled Plasma-MassSpectrometry) and LIBS (Laser Induced Breakdown Spectroscopy).Specifically, LIBS can be used for the analysis of H- Pu, whichincludes non-metals such as H, N, O, and halogens that are difficultor impossible to analyze by a conventional ICP-MS instrument. Whencoupled with a sensitive ICP-MS instrument, the J200 can perform LA-ICP-MS measurements focusing on trace elemental and isotopic ratiocompositions. This tandem instrument, in combination with a BrukerAurora Elite ICP-MS, expands the dynamic range of analysis from sub-ppb levels with LA-ICP-MS, to %levels with LIBS, while also increasingthe elemental coverage to typical ICP-MS elements and lighter, organic,and halogen elements such as H, Ar, He, O, and F detection with LIBS. To understand the capabilities of the J200 Tandem LA-LIBSinstrument in combination with ICP-MS, a rare earth element (REE)-richmineral was analyzed and the elemental composition over a 16 mm²area was mapped using contour plots. The REE-rich sample containsbastnasite ((Ce, La)CO,F) and barite (BaSO), which have very distinctregions as seen in Figure 1. Innovative Elemental Mapping of Geological Minerals with Applied Spectra's J200 Tandem LA-LIBS Operating Parameters 213 nm Nd:YAG laser (ns) and an ICCD detector con-trolled using Applied Spectra Axiom Software 885 um crater diameter (spot size) Flex sample chamber with helium gas flow Laser sampling grid with a total of 400 locations over a4 mm x 4 mm area using 50 laser pulses per location Applied Spectra Data Analysis Software package Applied Spectra Inc.’s J200 Tandem LA-LIBS Instrument Bruker Aurora Elite ICP-MS Time resolved "high sensitivity mode” detection Peak hopping: 49Ti+,65Cu*, 66Zn+, 137Ba+, 139La+, 140Ce+,208Pb+,232Th+,and 238U+ Synchronized communication triggering with the J200Tandem LA -LIBS instrument Sample Analysis Rare Earth Element(REE)-Rich Mineral. The mineral sample was usedto assess the ability of the J200 tandem instrument in combination with theBruker Aurora Elite ICP-MS. A 16 mm? area was analyzed using a laser spotsize of 85 um (diameter) and spacing of 115 um between locations. Bruker Aurora Elite ICP-MS a b Figure 2. a) Fluorine and b) oxygen LIBS intensity maps. The data is a result of 50 laser pulses per location,85 um spot size, and 400 locations over a 4 mmx 4 mm area. Figure 2 displays the LIBS intensity map for F 685.6 nm and O 700.2 nm from the sample. Based on the opti-cal image from Figure 1, the white region of the sample is richer with oxygen than the other regions based onthe contour plot in Figure 2. The tan region is richer with fluorine suggesting that these tan areas of the sampleare bastnasite. The LIBS intensity maps only tell part of the story. Using the unique tandem feature of the J200, LA-ICP-MSdata can be obtained simultaneously to complement the LIBS data. Figure 3 displays the intensity maps forthe elements that are typically found in barite and bastnasite minerals. LA-ICP-MS and LIBS together showthat the white region is rich in barium and oxygen (aforementioned), which corresponds with barite. The tanregion of the sample is high in lanthanum, cerium, and fluorine (aforementioned), which corresponds withthe bastnasite. These contour plots match nicely with the optical image shown in Figure 1. a b Figure 3. Major elements of the REE-rich sample, a) barium, b) lanthanum, and c) cerium LA-ICP-MS intensity maps. Figure 4 displays the intensity maps of trace elements from the 16 mm? area of the REE-rich mineral sampleanalyzed. These plots display results from intensities of lead, thorium, uranium, titanium, cobalt, and copper(these elements are typically < 0.1 wt. %). Titanium and copper were found to be mainly associated with thebarite mineral (white region). Lead and cobalt were associated with the brown region of the sample. Uraniumand thorium were only associated with the bastnasite. The trace elements detected in this sample match cur-rent literature on these types of REE-rich mineral samples. Applied Spectra, Inc.Telephone:+1510.657.767946665 Fremont Blvd.Fax:+1510.657.7074APPLIEDSPECTRAFremont, CA 94538Sales Support:+1510.657.7679 x410Transforming the way the world does chemistry Figure 4. Trace elements of the bastnasite mineral, a) lead, b) thorium, c) titanium, d) cobalt, e) uranium,and f) copper LA-ICP-MS intensity maps. Conclusion LIBS was demonstrated as a means for detecting fluorine and oxygen in REE-rich mineral samples.These areanalytes that are difficult or impossible to detect through other atomic spectroscopy techniques. Using theJ200 tandem feature to acquire the LIBS data while interfacing the insturment with a sensitive ICP-MS enabledmore complete elemental mapping of the investigated mineral. Elemental mapping of the sample using thedata analysis software from Applied Spectra allowed for easy integration of the LIBS and LA data to createcontour plots as shown in the aforementioned sections. The high sensitivity of the Bruker Aurora Elite ICP-MSwas ideal for trace level elemental and isotopic mapping analysis, since LA-ICP-MS often involves very smallquantity of sampled mass, especially when high spatial resolution is desired. Acknowledgements Applied Spectra would like to thank Bruker for the collaboration and for providing us with an Aurora EliteICP-MS instrument. Also, we would like to thank the Special Technologies Laboratory for supplying thebastnasite mineral for testing. Applied Spectra, Inc.Telephone:+1510.657.767946665 Fremont Blvd.Fax:+1510.657.7074APPLIEDSPECTRAFremont, CA 94538Sales Support:+1510.657.7679x410Transforming the way the world does chemistry LIBS被证明是检测富稀土矿物样品中氟和氧的一种方法。这些是很难或不可能通过其他原子光谱技术检测到的分析物。利用J200复合系统获取LIBS数据,同时将设备与灵敏的ICP-MS连接,可以对所研究的矿物进行更完整的元素分析。使用Applied Spectra的数据分析软件对样品进行元素制图,可以快捷地整合LIBS和LA数据,以创建元素分布图。
关闭-
1/4
-
2/4
还剩2页未读,是否继续阅读?
继续免费阅读全文产品配置单
北京富尔邦科技发展有限责任公司为您提供《氟碳铈矿矿物中多元素及元素分布检测方案(激光诱导击穿)》,该方案主要用于非金属矿产中多元素及元素分布检测,参考标准《暂无》,《氟碳铈矿矿物中多元素及元素分布检测方案(激光诱导击穿)》用到的仪器有美国ASI 激光剥蚀—激光诱导击穿光谱复合系统。
我要纠错
推荐专场
相关方案
 咨询
咨询