

方案详情文
智能文字提取功能测试中
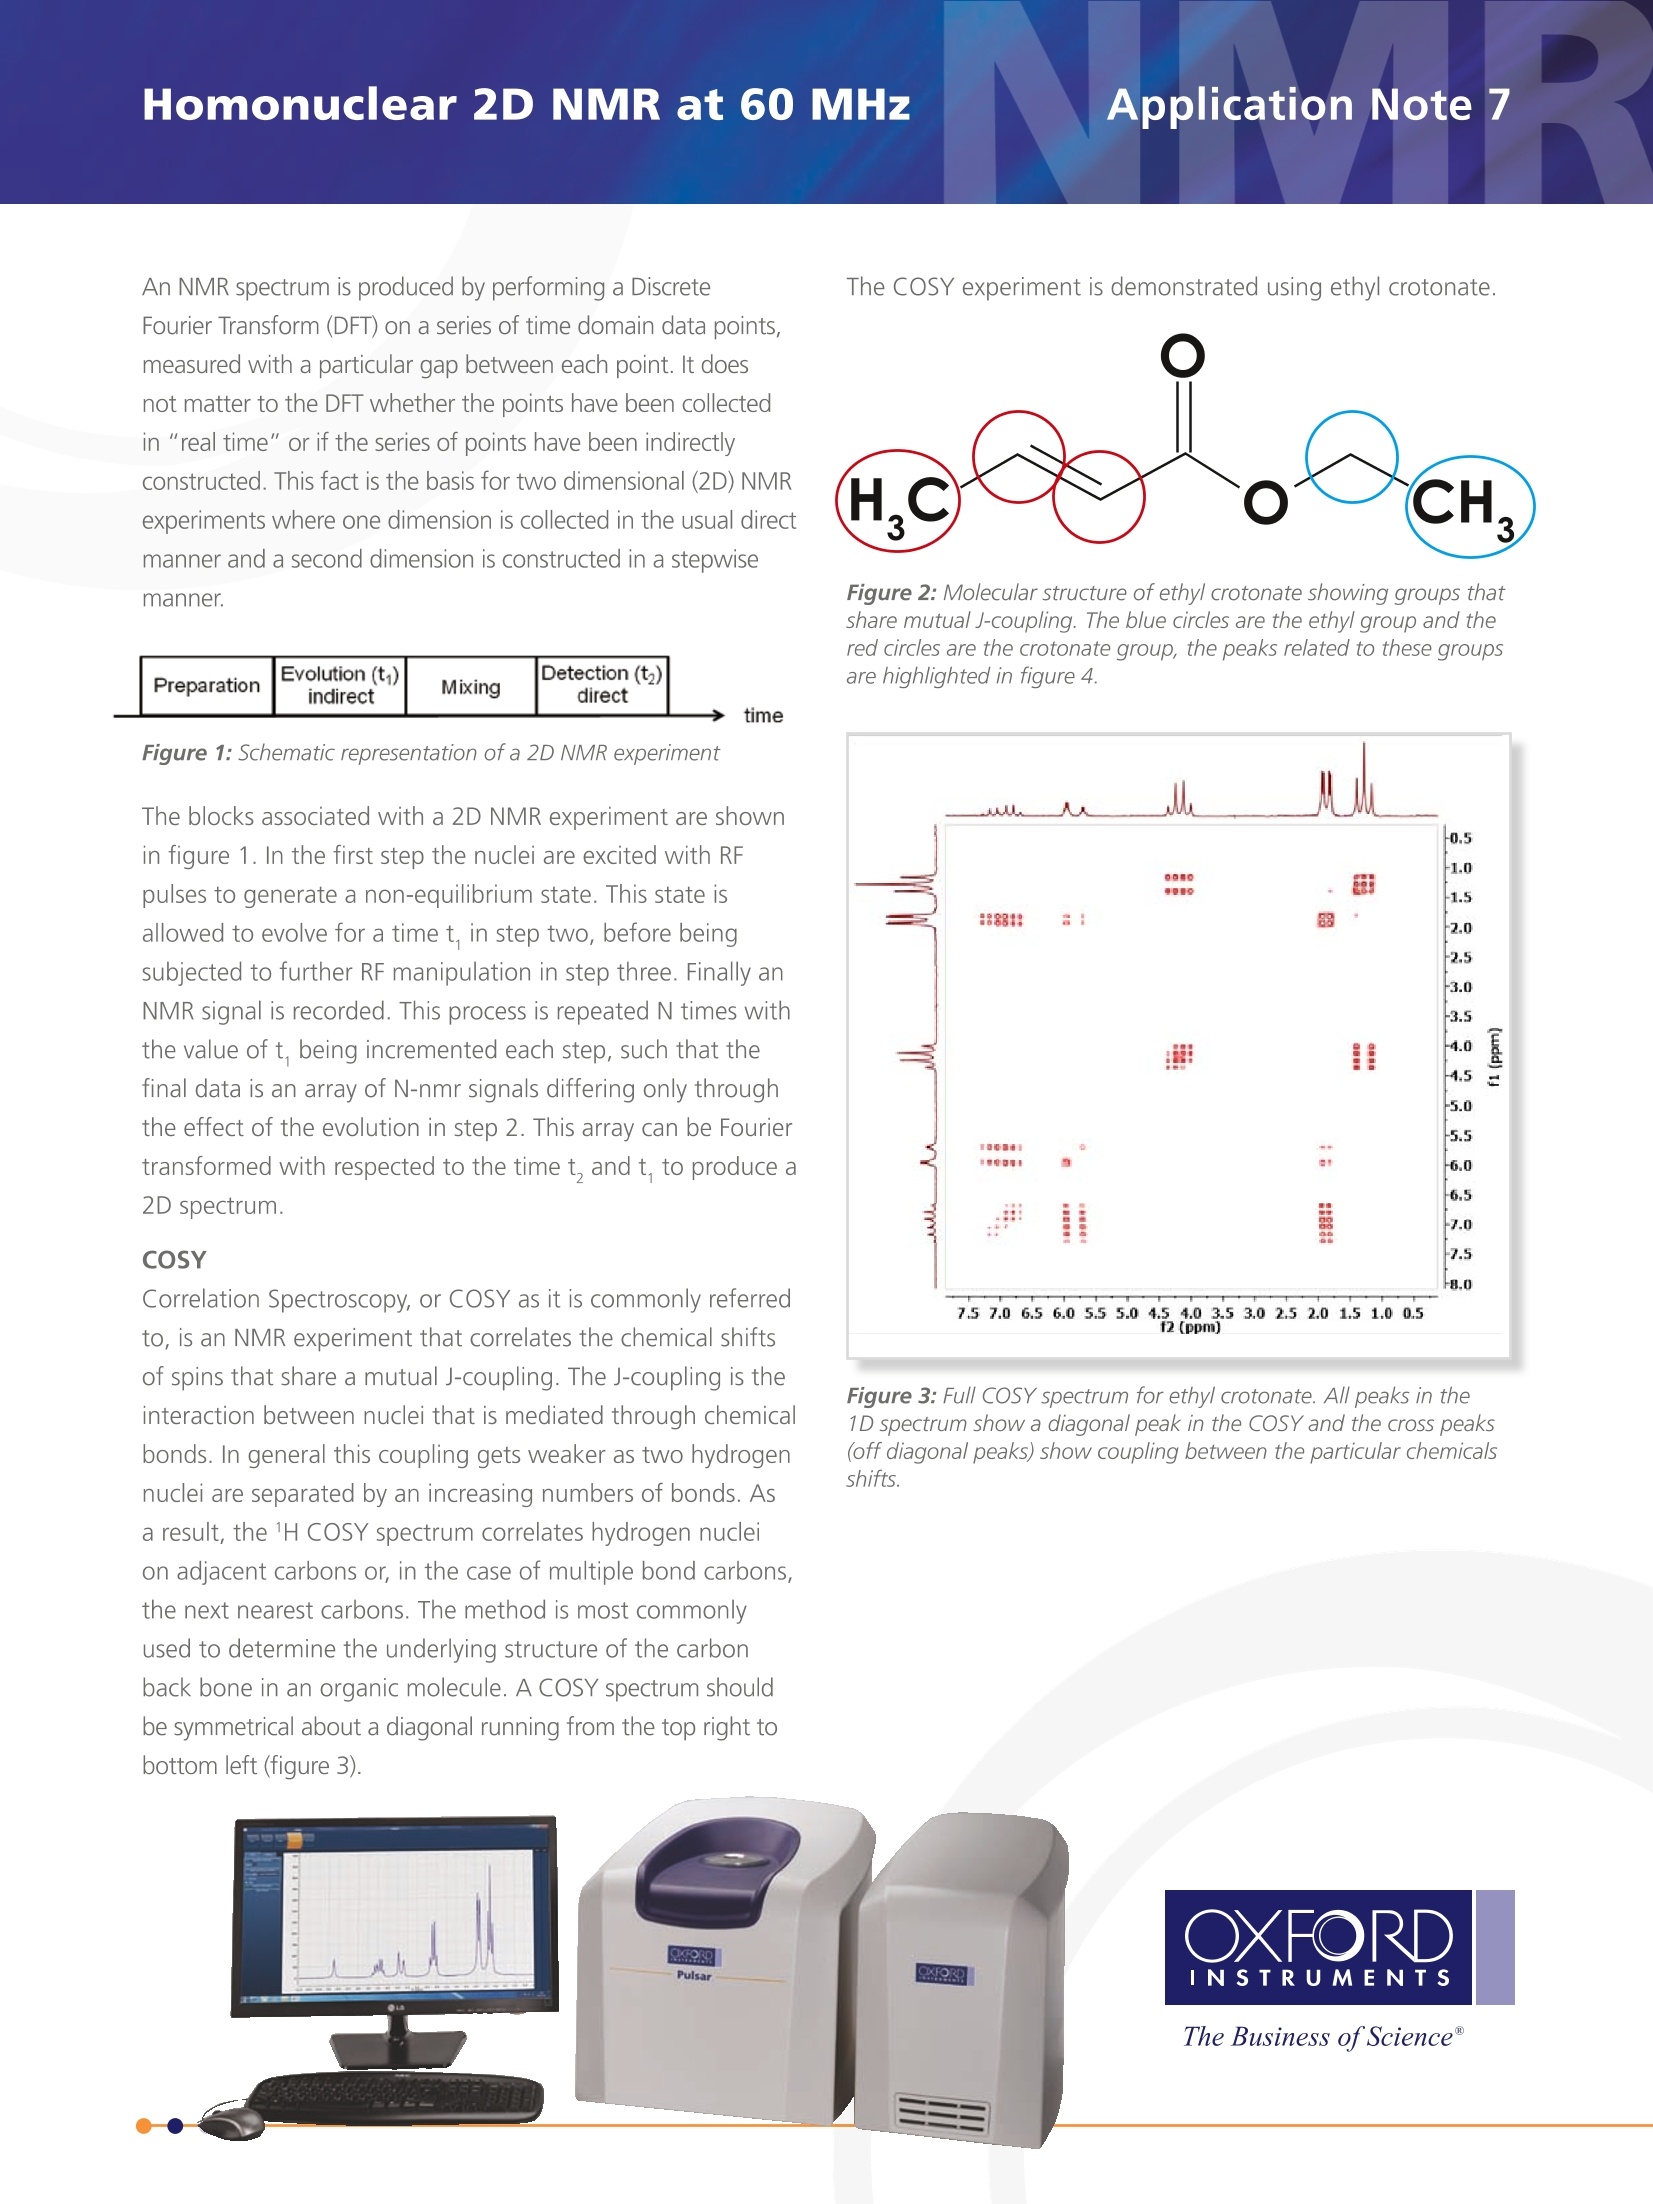
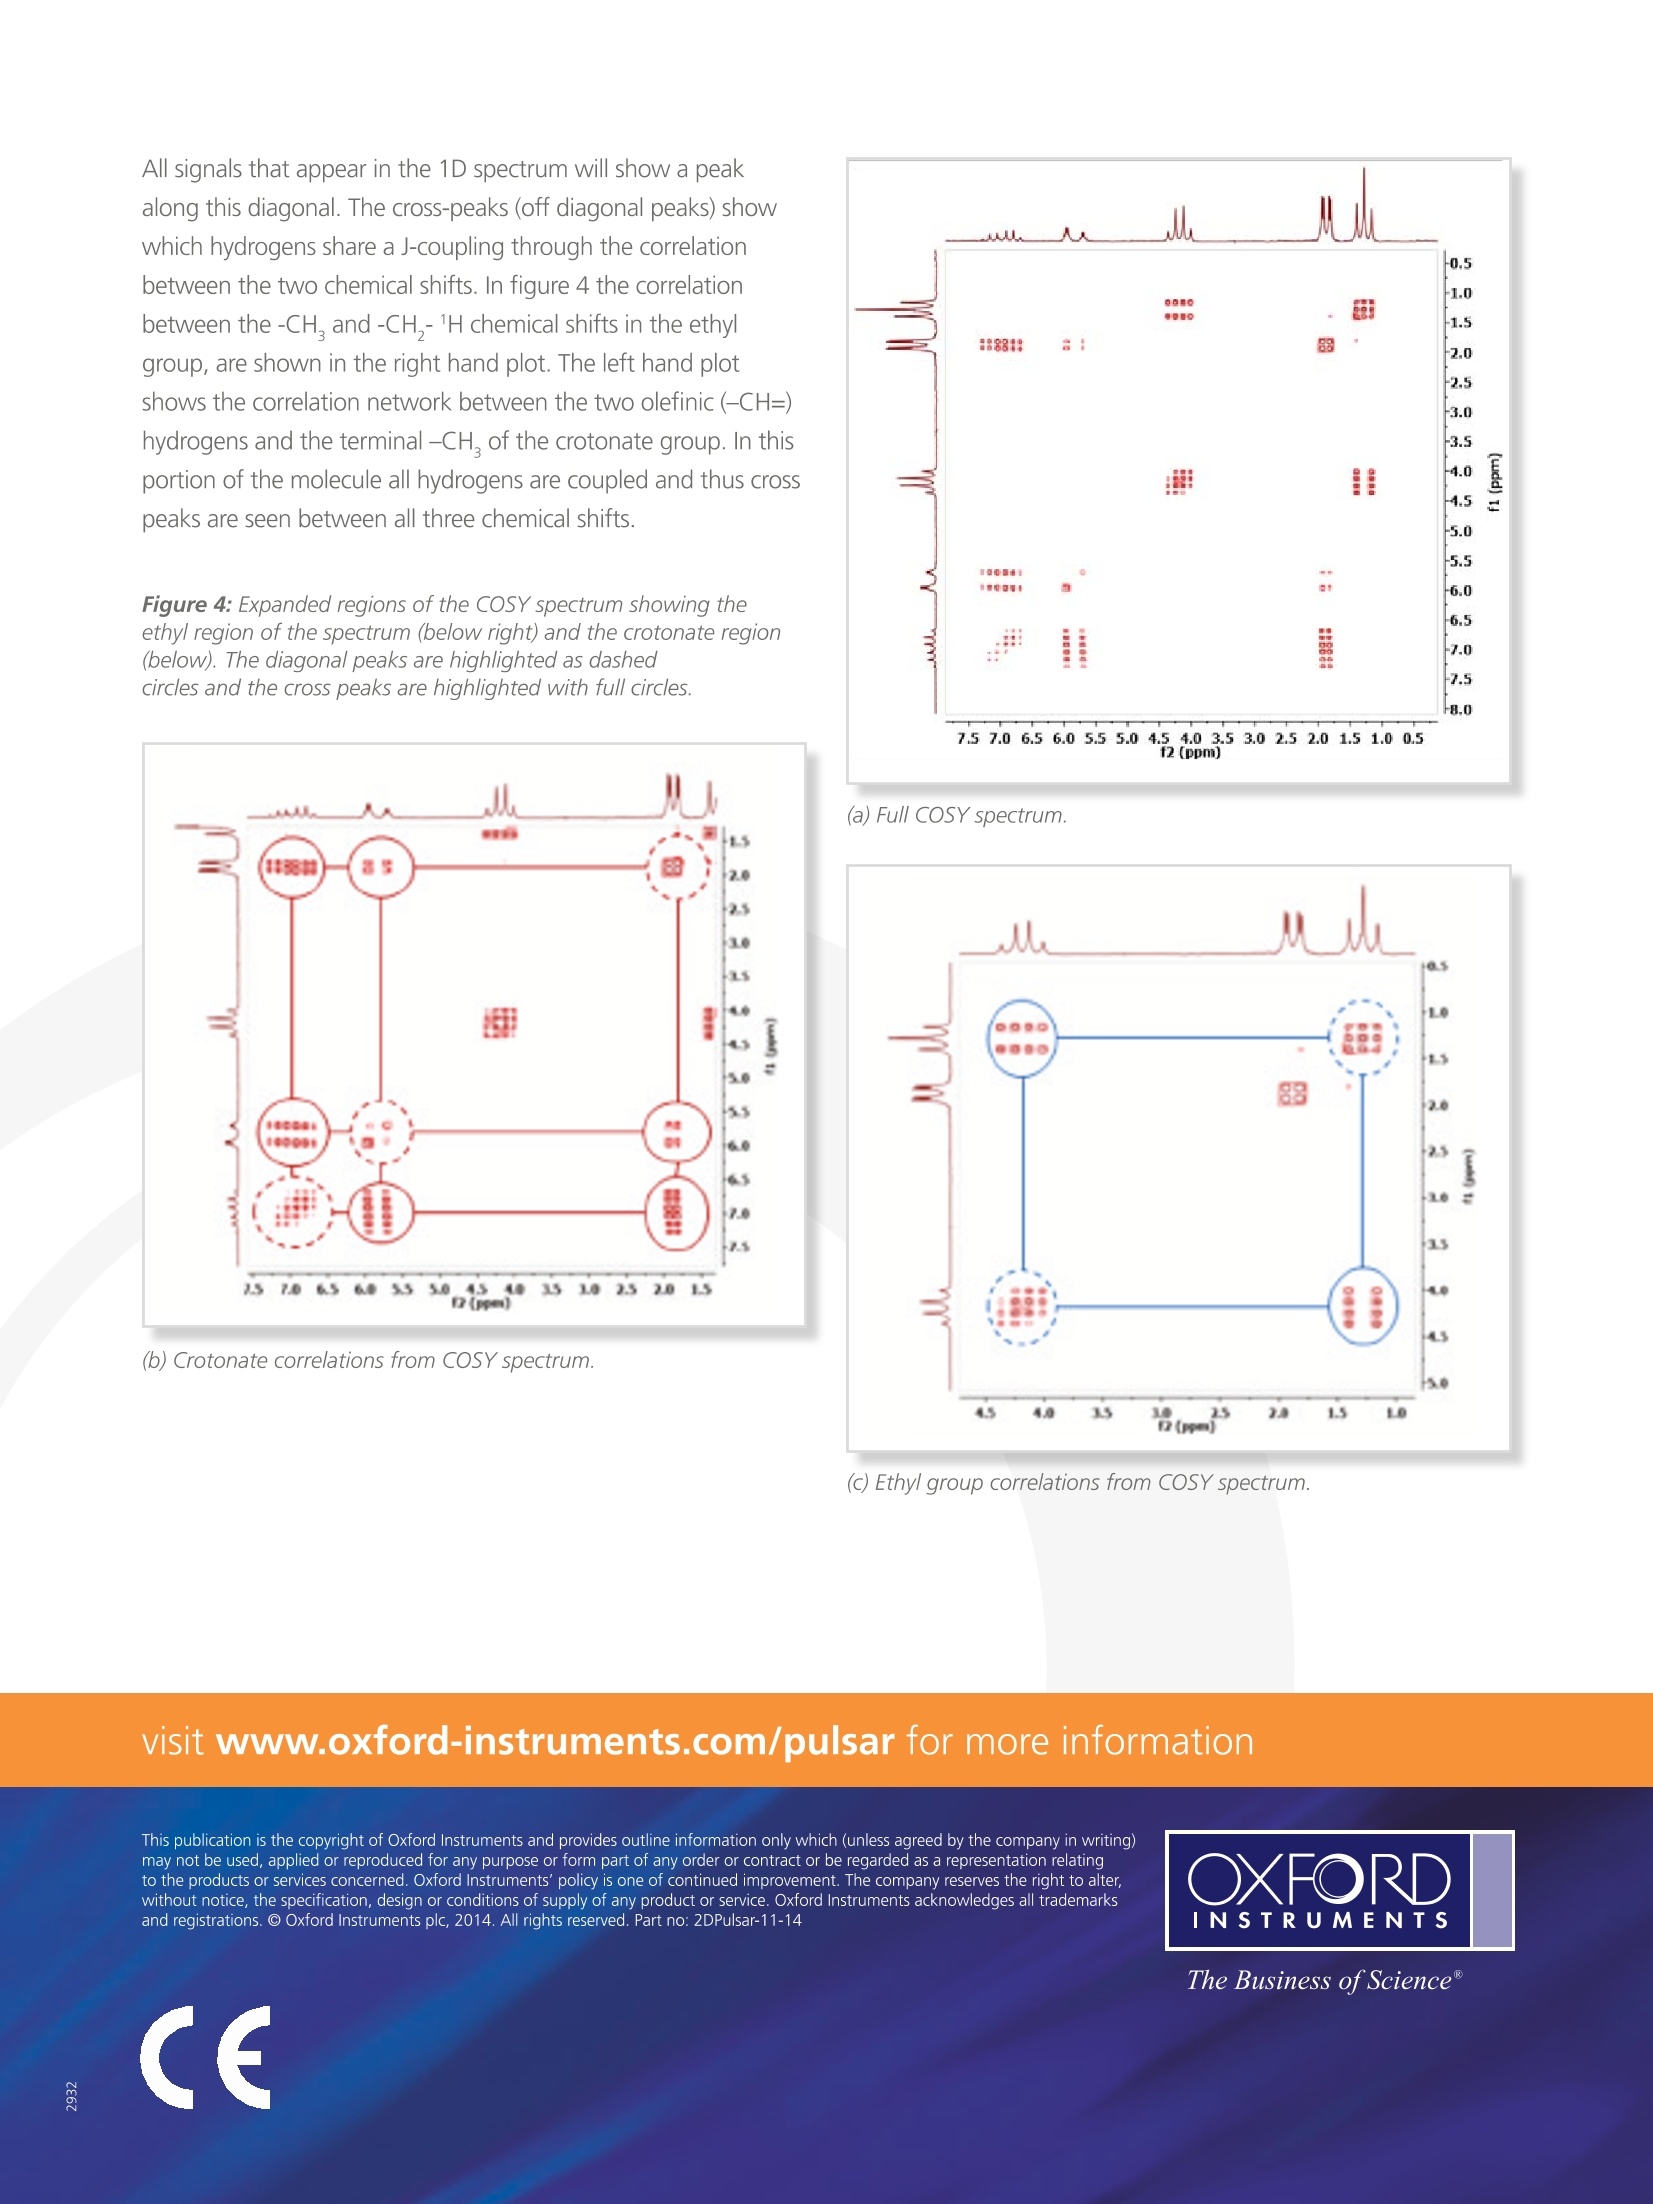
Application Note 7m Homonuclear 2D NMR at 60 MHz An NMR spectrum is produced by performing a DiscreteFourier Transform (DFT) on a series of time domain data points,measured with a particular gap between each point. It doesnot matter to the DFT whether the points have been collectedin "real time" or if the series of points have been indirectlyconstructed. This fact is the basis for two dimensional (2D) NMRexperiments where one dimension is collected in the usual directmanner and a second dimension is constructed in a stepwisemanner. Figure 1: Schematic representation of a 2D NMR experiment The blocks associated with a 2D NMR experiment are shownin figure 1. In the first step the nuclei are excited with RFpulses to generate a non-equilibrium state. This state isallowed to evolve for a time t, in step two, before beingsubjected to further RF manipulation in step three. Finally anNMR signal is recorded. This process is repeated N times withthe value of t, being incremented each step, such that thefinal data is an array of N-nmr signals differing only throughthe effect of the evolution in step 2. This array can be Fouriertransformed with respected to the time t, and t, to produce a2D spectrum. COSY Correlation Spectroscopy, or COSY as it is commonly referredto, is an NMR experiment that correlates the chemical shiftsof spins that share a mutual J-coupling. The J-coupling is theinteraction between nuclei that is mediated through chemicalbonds. In general this coupling gets weaker as two hydrogennuclei are separated by an increasing numbers of bonds. Asa result, the 1H COSY spectrum correlates hydrogen nucleion adjacent carbons or, in the case of multiple bond carbons,the next nearest carbons. The method is most commonlyused to determine the underlying structure of the carbonback bone in an organic molecule. A COSY spectrum shouldbe symmetrical about a diagonal running from the top right tobottom left (figure 3). The COSY experiment is demonstrated using ethyl crotonate. Figure 2: Molecular structure of ethy/ crotonate showing groups thatshare mutual J-coupling. The blue circles are the ethy/ group and thered circles are the crotonate group, the peaks related to these groupsare highlighted in figure 4. Figure 3: Full COSY spectrum for ethy/ crotonate. All peaks in the1D spectrum show a diagonal peak in the COSY and the cross peaks(off diagonal peaks) show coupling between the particular chemicalsshifts. All signals that appear in the 1D spectrum will show a peakalong this diagonal. The cross-peaks (off diagonal peaks) showwhich hydrogens share a J-coupling through the correlationbetween the two chemical shifts. In figure 4 the correlationbetween the -CH, and -CH,-1H chemical shifts in the ethylgroup, are shown in the right hand plot. The left hand plotshows the correlation network between the two olefinic (-CH=)hydrogens and the terminal -CH, of the crotonate group. In thisportion of the molecule all hydrogens are coupled and thus crosspeaks are seen between all three chemical shifts. Figure 4: Expanded regions of the COSY spectrum showing theethyl region of the spectrum (below right) and the crotonate region(below). The diagonal peaks are highlighted as dashedcircles and the cross peaks are highlighted with full circles. (b) Crotonate correlations from COSY spectrum. (a) Full COSY spectrum. 核磁共振波谱是通过对一系列时域数据点执行离散傅里叶变换(DFT),测定每个数据点之间的特定间隙而得到的。
关闭-
1/2
-
2/2
产品配置单
牛津仪器科技(上海)有限公司为您提供《二维核磁中核磁共振检测方案(核磁共振)》,该方案主要用于其他中核磁共振检测,参考标准《暂无》,《二维核磁中核磁共振检测方案(核磁共振)》用到的仪器有牛津仪器宽带多核台式核磁共振谱仪X-Pulse。
我要纠错
相关方案
 咨询
咨询