方案详情文
智能文字提取功能测试中
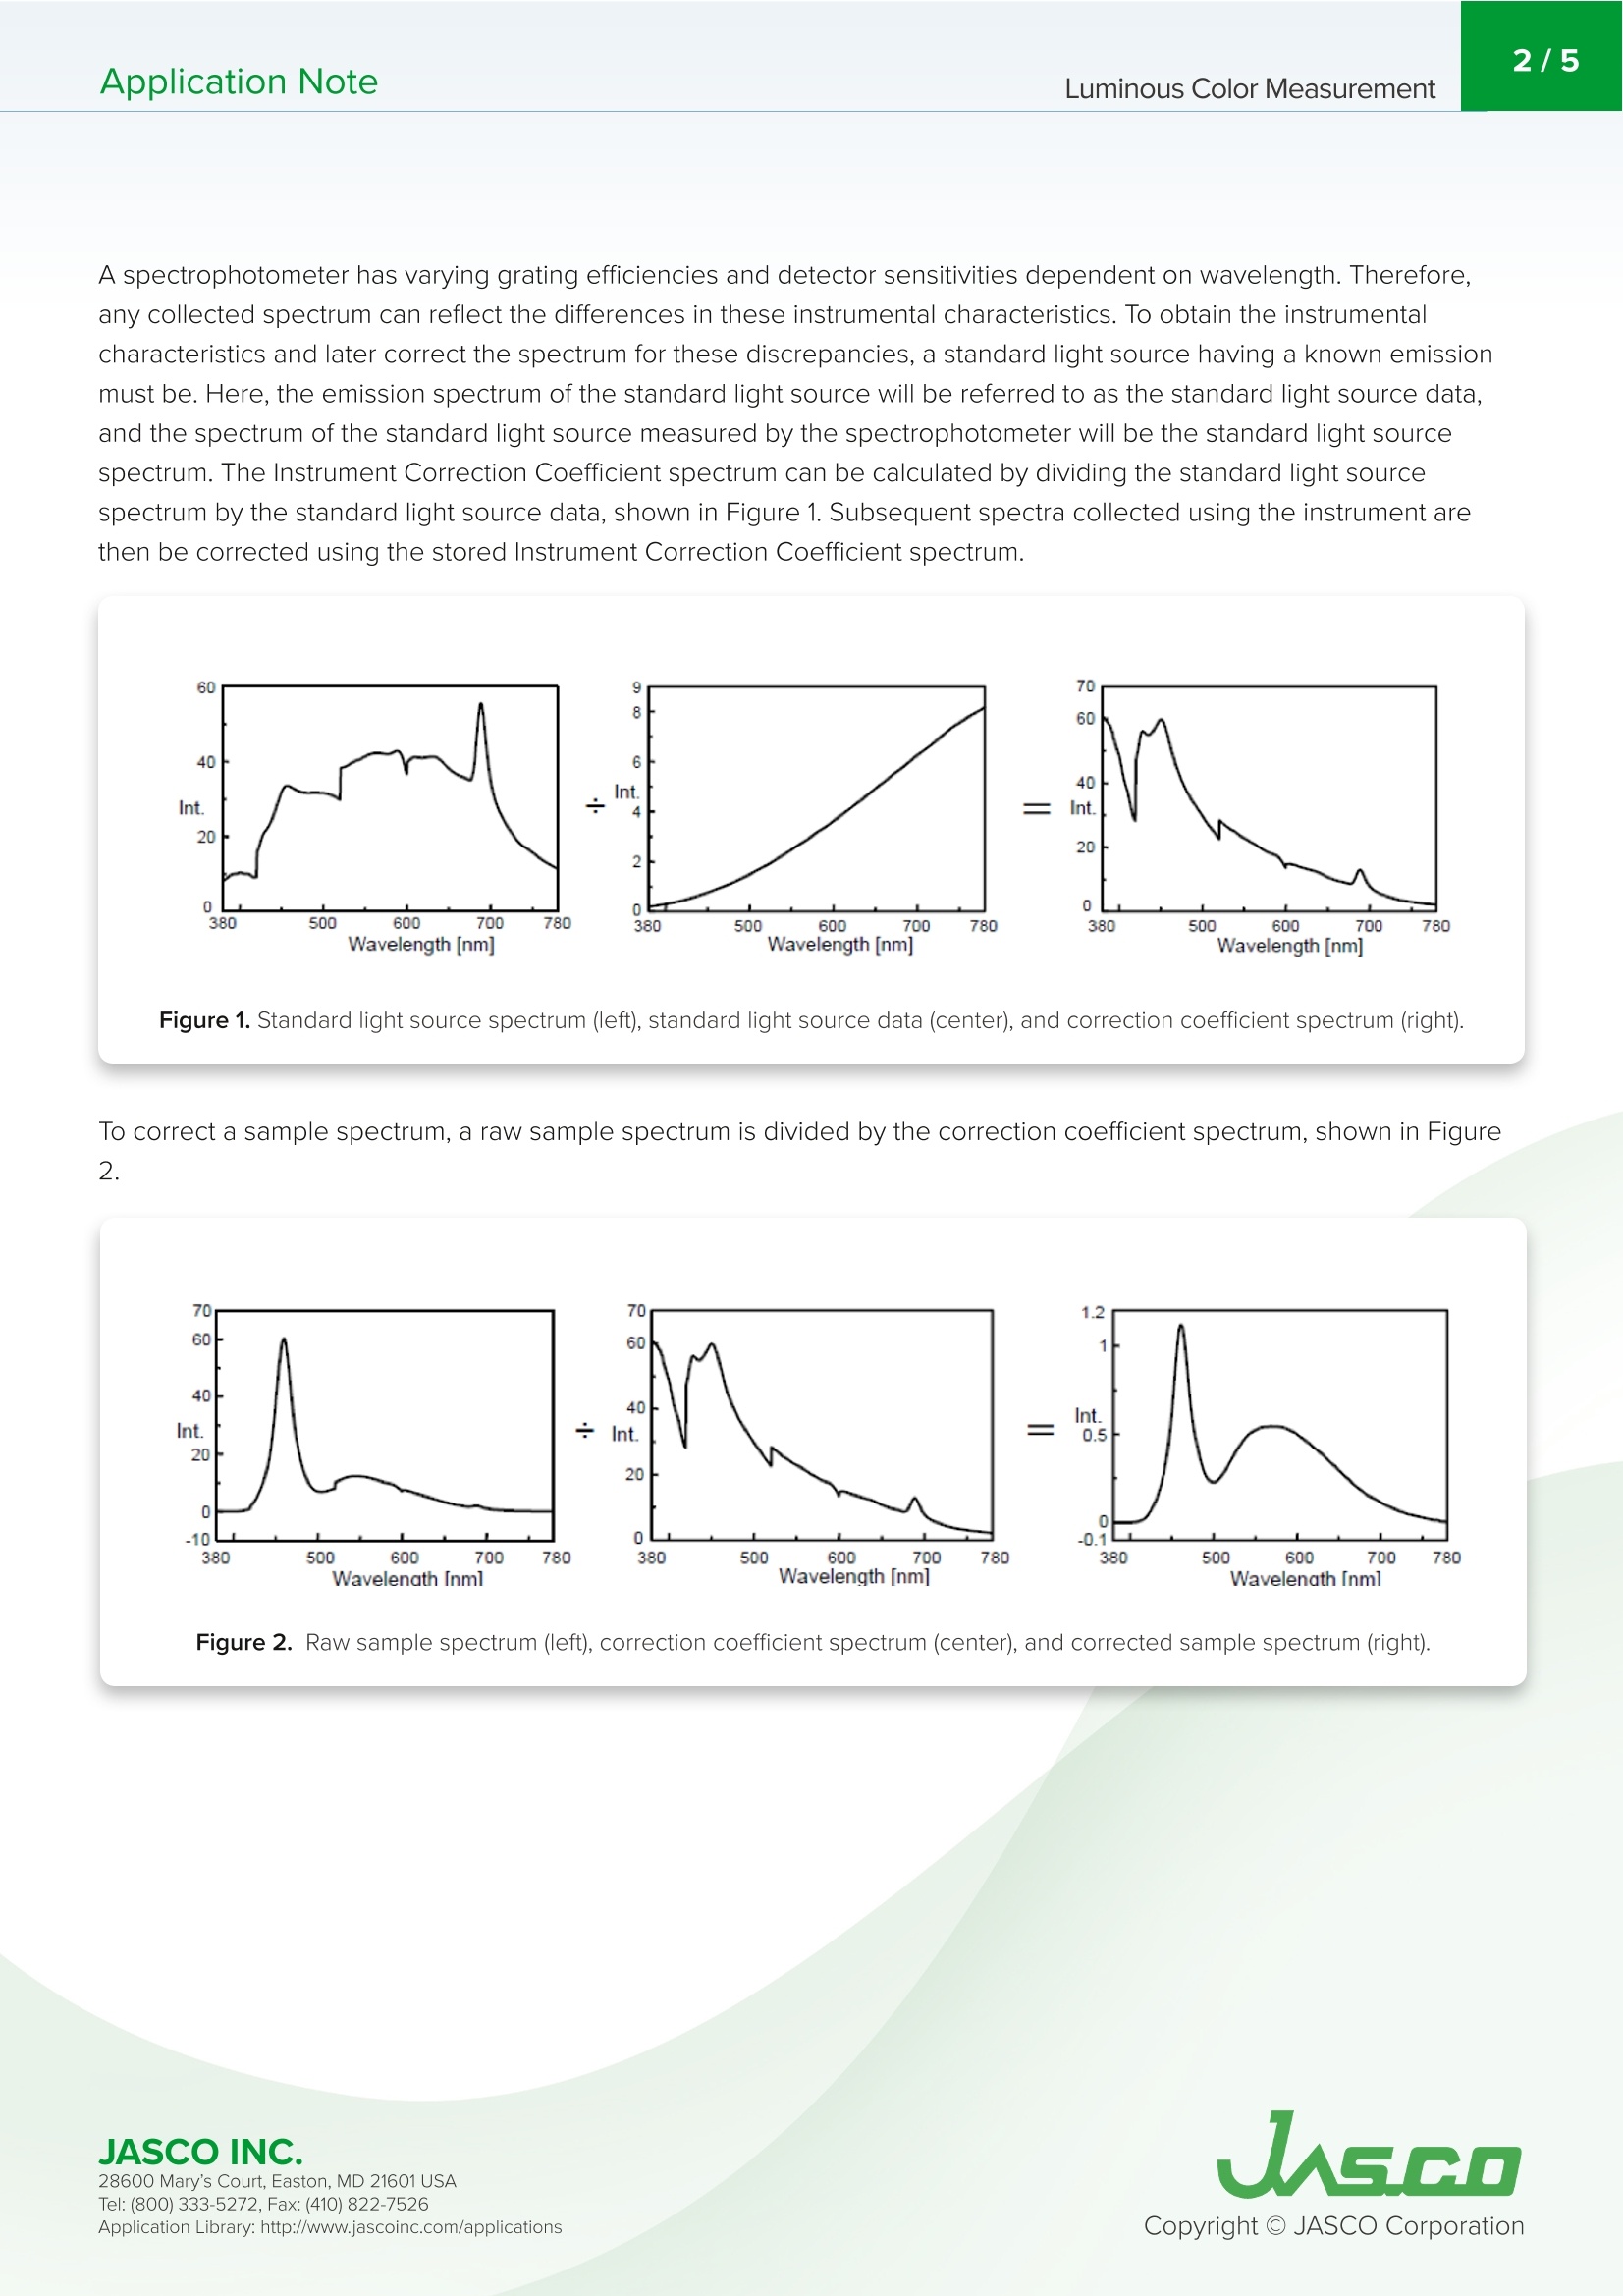
发出自身光的物体被称为发光材料,并且越来越多地被用作发光二极管(LED)、有机电致发光(EL)显示器和等离子体显示面板(PDP)中的材料。1993年引入蓝色LED后,工程师们开发了一种白色LED,它现在是手机背光和LED手电筒的主流照明器。诸如平板有机EL显示器的商用屏幕显示器具有优异的发光效率和较低的功耗性能。这些发光材料的开发要求制造商获得显示器颜色的数值评估,以及发光体本身和制造的显示器的显色性。Application NoteUV-0006 2/5Application NoteLuminous Color Measurement Luminous Color Measuremen t In t roduc t ion Obj e c t s that give of f t h e ir own light a r e k nown as l uminous materials and are incr e asin g ly being us e d as mate r ials in L i ght Em i t t i ng Diodes (LED), Organic Elec t r i ca l Lumi ne scen t (EL)displays, and P l asma Dis p lay Pa n e l s (PDP). After the int r oduct i o n of t h e blu e LED in 1993,engineers deve l oped a wh i te LED that is n ow the mainstream i llumi n ator of t h e mobi l e phone backlight and LED flashl i g h ts. Commercial screen d i splays such as fl at -screen org a nic EL displays have s u per i or pe r formance fo r lum i nous eff i c i ency and lower power consumpt i on . T h e developmen t of t hese luminous mater i als r equire manufacturers to obtain nume r ical eva l uations of the display colors, as we l l as the color render in g of the luminous body i tself and of t h e ma n ufactured display. UV-V i s i b l e Spectrophotometer In t h is application note, met h ods for e valuating lumi n o u s colors and color rend e r i ng by a JASCO spectrophotometer are int r oduc e d f or t h e dev e lopment of L ED, Organic EL , and PDP displays. Mor e over , a method for evaluat in g the colors of liquid crysta l displays (LCD) us in g the same syst e m is also i ntroduced. Keywords V-650/660/670,UV-Vi s ibl e /NIR, VW LU -788 L umin ous Co l or M e asurem e nt /An a ly sis Pr o g ram, E L M-742 Extern a l Sou r ce Fiber O p tic , Luminous color, Mat e ri a l s Exper i mental Wavelength Range 380-780nm Excitation Wavelength 350nm Excitation Bandwidth 5nm Emission Bandwidth 6nm Response 0.2 sec Sensitivity Manual PMT Voltage 350V Scan Speed 1000 nm/min A spectrophotometer has va r ying grating effic i encies and detector sensitivities d e pendent on wavelength . T h erefore,any collected spectr u m can reflect the differences in t hese i nstrumental characte r istics. T o obtain the inst r umental cha r acteristics and later cor r ect the spectrum for t h ese discrepancies, a sta n dard li ght source ha v ing a known emission must be. Here, the emission spectrum of t h e standa r d l i g h t source wi l l be r eferred to as t h e standa r d l i g h t source data,and the spectrum of t he standard l i ght source measu r ed by t h e spect r ophotometer will be the standard light source spectrum. The Instrume n t Cor r ection Coeff i cient spectrum can be calculated by div i ding t h e standa r d l i ght source spectrum by the standard light source data, shown i n Figu r e 1. Subsequent spect r a collected using the instrument are then be corrected using the stored Instrument Correction Coefficient spectrum. Figure 1. S t an d ard li gh t so u rc e s p e ct r um (le f t), s t anda r d li gh t sourc e da t a (cen t e r ), an d cor re ctio n c o effic i e nt sp e c t r um (rig h t). To correct a sample spectrum, a raw sample spec t ru m is d i vided by the cor r ect i on coeff i cient spectru m , shown in F i gure 2. 70 60 40 I n t . 20 0 -10 380 500 600 700 780 Wav e l e n a t h I n ml Figure 2. Raw s amp l e sp e ctr um (lef t), cor r e c t ion c o ef fi c ien t s p ect r u m (center), an d co r r e c t ed s a mp l e s p ect r um (right). JASCO INC. 28600 Mary's Cour t , E a s to n , M D 21601US A UASGO R esul t s Three white LED's, a f l uorescent lamp, and sunl i g h t were measured to calculate th e Color Rendering I n dex and the Cor r e l ated Color Temperature o f i lluminat i on sources. The Color Rendering Index quant i tative l y determines how accurately a l i ght source r enders all colors and is reported on a scale of 0 to 100%. The Correlated Color Temperature measures the color character i stics of the ligh t at vary i ng wavelengths, suc h as warmt h o r coolness. The Color Rendering and Correlated Color Temperature results are shown i n Figure 3 and Table 1. The white LED's showed good Color Rendering Index (R ) wi t h a h igh Correlated Co l or Tempe r ature (T ,) wh i ch indicate that the color of the white LEDs d i f fered according to thei r types, some of which demonstrated a deeper blue color. Sunlight provides a R of almost 100, while the f l uorescent lamp demonstrates a slight l y smal l er R Figure 3. E mi t t ing sp ec tra of i l l umi n ant s (lef t ) and th e c o r r e s p on di ng c hr o ma t i ci ty d i agra m (r ight). Table 1. E mitti ng sp e ctra o f i l l u min a nts (lef t ) an d the cor r e spo n di n g c hroma tic ity dia g ram (r i g h t). Illumination Spectrum T,(K) d 入。(nm) P(%)3 Reference Illuminants R Classification of FL 1 White LED 1(Blue) 9055 -0.013 469.37 19.28 D9055 86 2 White LED 2 (Light Blue) 8563 0.003 482.54 17.62 D8563 80 3 White LED 3 (Yellow) 19359 -0.014 470.37 31.23 D19358 80 4 Fluorescent Lamp(Green) 4632 0.005 572.78 19.05 P4632 82 N 5 Sunlight (Red) 5158 0.003 566.74 9.1 D5158 98 N 28600 Mary's Cour t , E a s to n , M D 21601US A The sc r een of a liqu i d c r ystal display was measured when i t was programmed to i l l uminate as white, r ed, blue, green,yellow, l ight blue, and deep r ed. The spect r a were calculated by the color calculation prog r am and are s h own in Figure 4and Table 2. Figure 4. S p ect r a for ea c h screen color (l ef t) an d the cor r e spo n di n g ch r oma t i c i t y d i a g r a m (r i g h t ). Table 2. C olor c a l c ula t i on r esul ts f or p la sma s c ree n di s p la y s a t v a ry i ng il lumi n a t ion colo r s. Illumination Spectrum X1 Y1 Z1 x2 y² T,(K) 1 White 18.95 20.56 22.01 0.308 0.3342 6714 2 Red 8.66 4.51 0.19 0.648 0.3376 3 Blue 3.56 1.95 19.37 0.1431 0.0784 4 Green 1.37 2.9 0.67 0.277 0.5868 5 Yellow 15.3 18.54 2.82 0.4173 0.5057 6 Light Blue 10.2 15.96 22.06 0.2115 0.331 7 Deep Red 2,74 1.4 5.1 0.2963 0.1518 ) Tr i st imu l u s valu es 2Chrom a tic i ty coordinat es T h e tristimulus XYS values desc r ibe the lumi n a n ce of the color while the chromaticity v a lues describe t he qual i ty of the color. T hese val u es, a lo n g wit h t h e color s p ace ma p , quan t i t a tive l y correlate color sensation with physical color on the elec t romagnet i c spectrum. The XYZ va lu es were co n verted into t h e RGB values and compared with the values of the display settings (Table 3)Al t hough the calcu l a t ed RGB values demonstra t ed relat i vely different values than those set for the display, we considered that the res u lts were a reasonable match , based on the predominant values for the RGB calculations vs. the display set t ings. 28600 Mary's Cour t , E a s to n , M D 21601US A USGO Display RGB Settings Converted from XYZ Values Color R G B R G B White 255 255 255 247 262 256 Red 255 0 269 0 Blue 0 0 255 0 57 256 Green 0 128 0 0 127 32 Yellow 255 255 254 257 30 Light Blue 0 255 255 0 263 259 Deep Red 128 128 128 11 139 28600 Mary's Cour t , E a s to n , M D 21601US A
关闭-
1/5
-
2/5
还剩3页未读,是否继续阅读?
继续免费阅读全文产品配置单
佳士科商贸有限公司为您提供《紫外可见光谱法测量发光颜色》,该方案主要用于光电材料中光色测量、显色性、紫外、材料、显示器检测,参考标准《暂无》,《紫外可见光谱法测量发光颜色》用到的仪器有jasco紫外可见分光光度计 V-700。
我要纠错
推荐专场
紫外、紫外分光光度计、紫外可见分光光度计、UV
更多
相关方案
 咨询
咨询