方案详情文
智能文字提取功能测试中
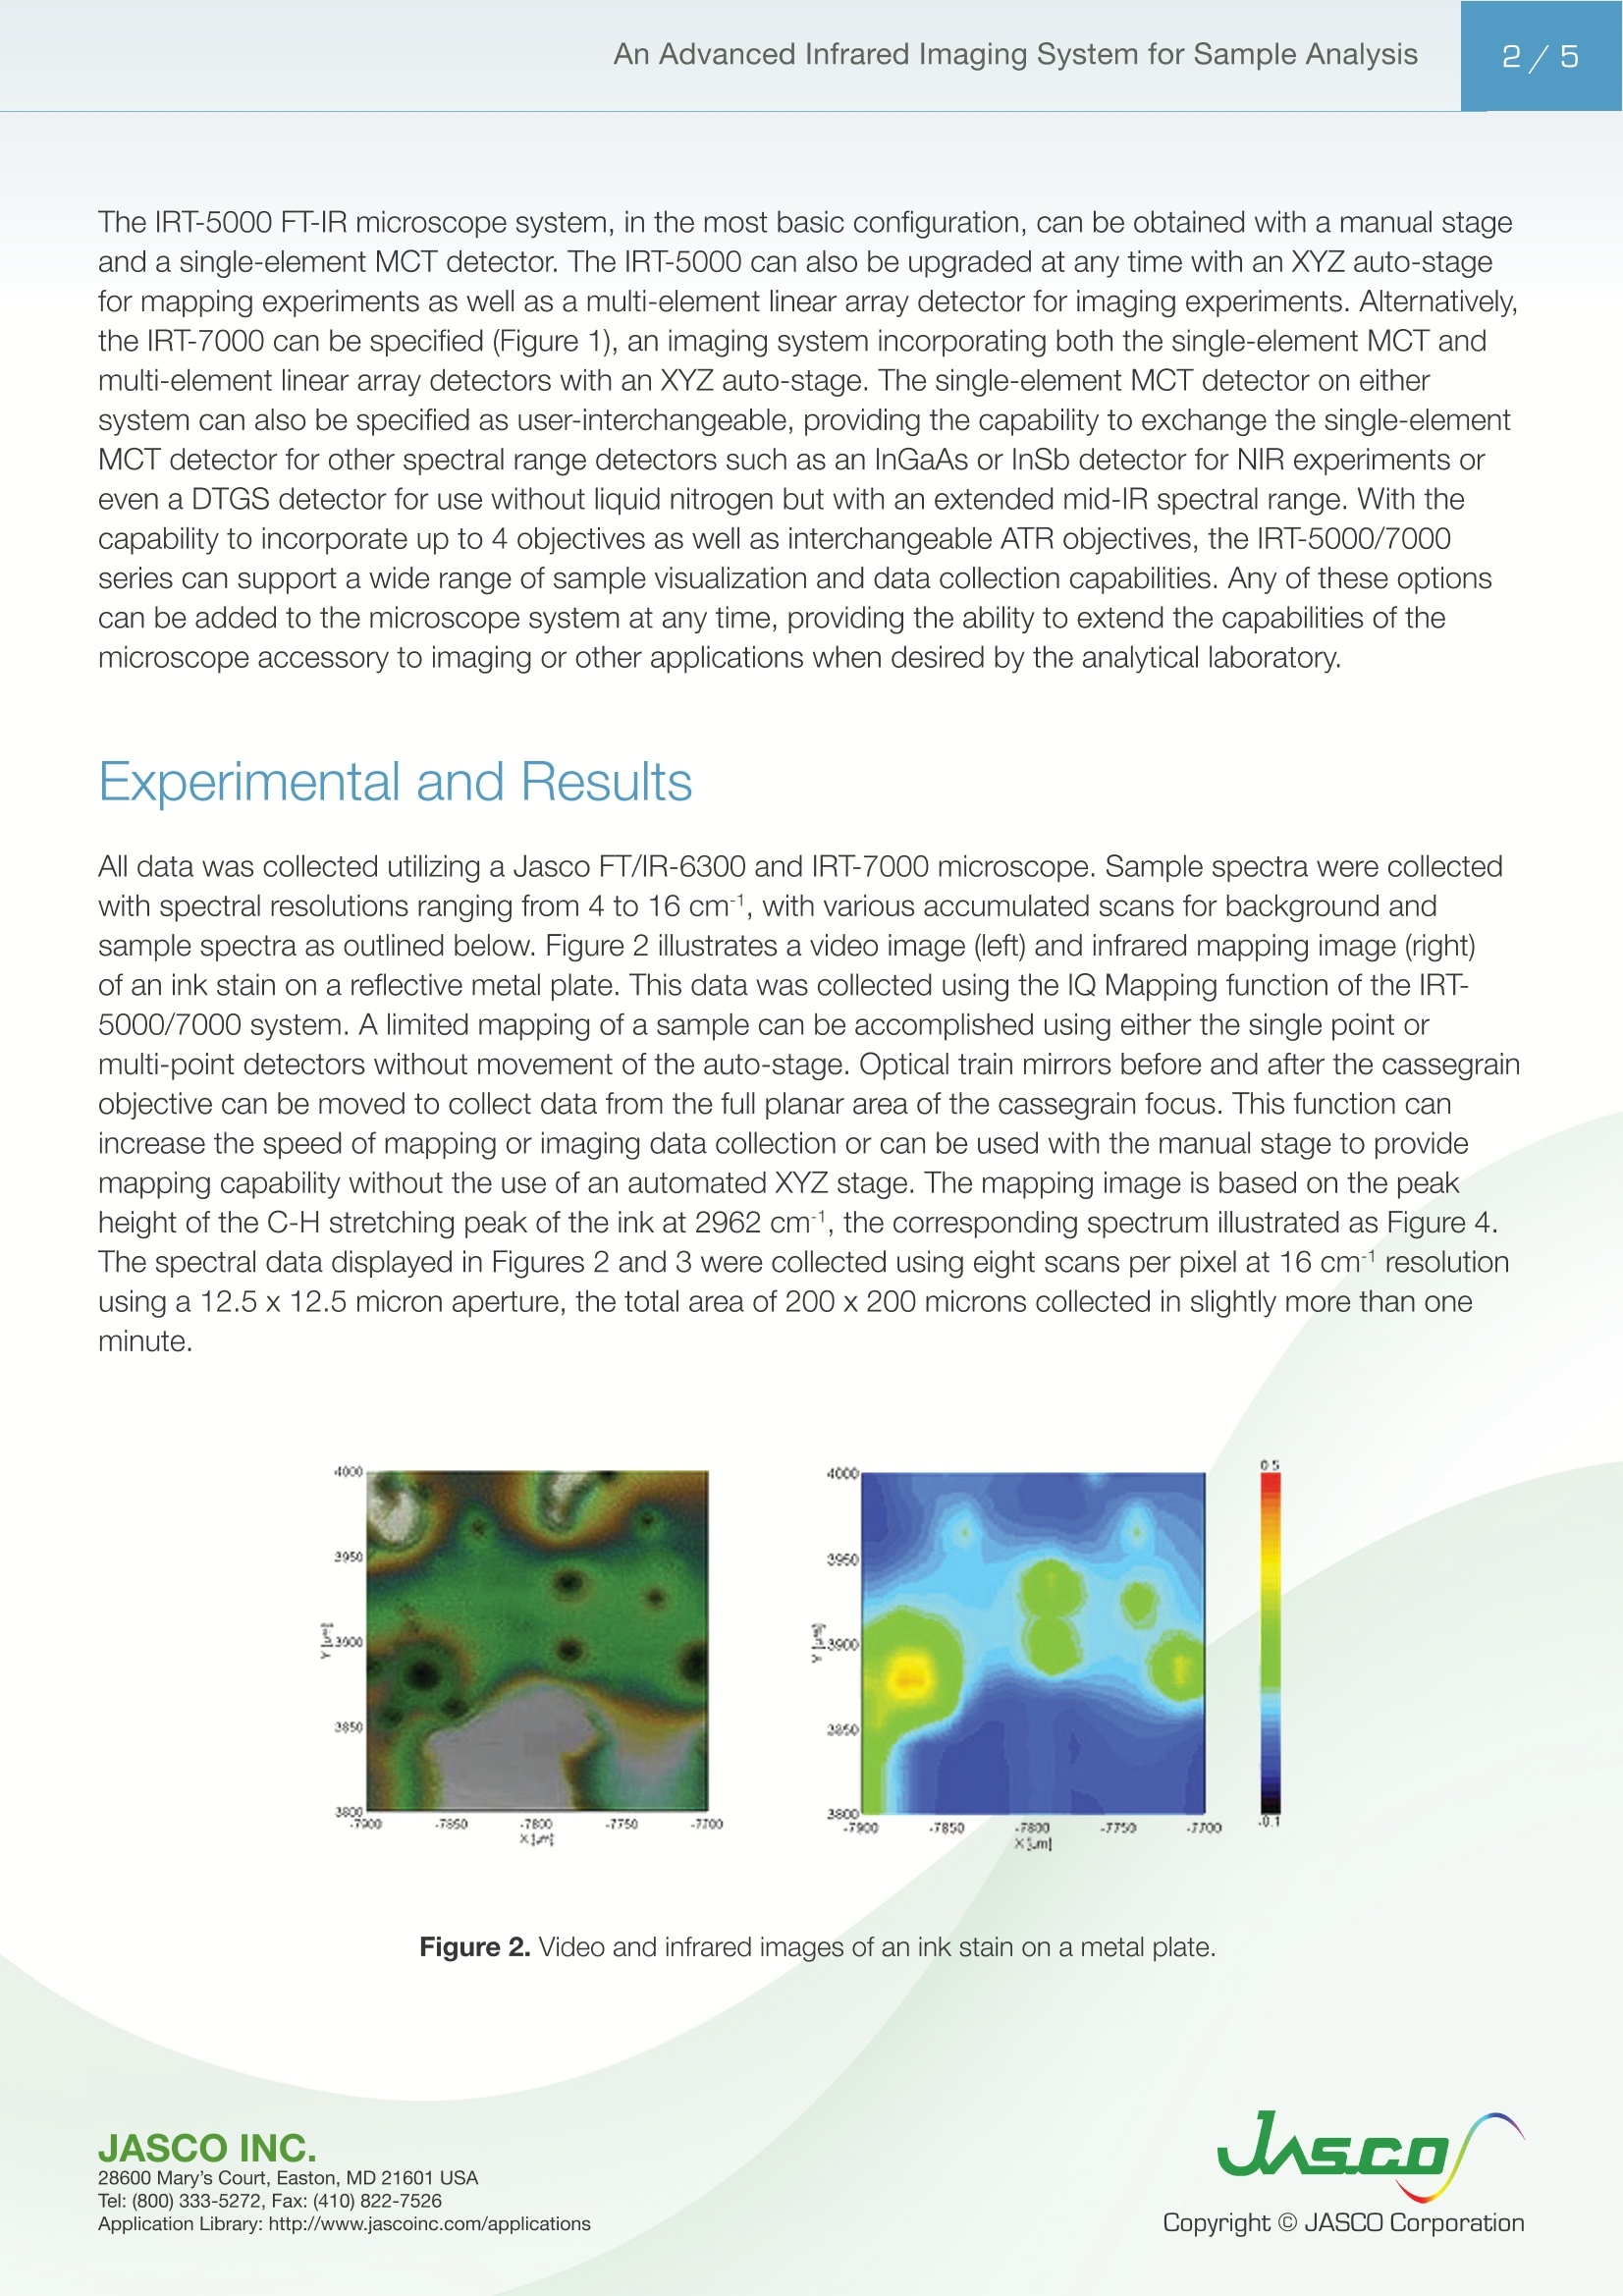
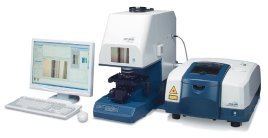
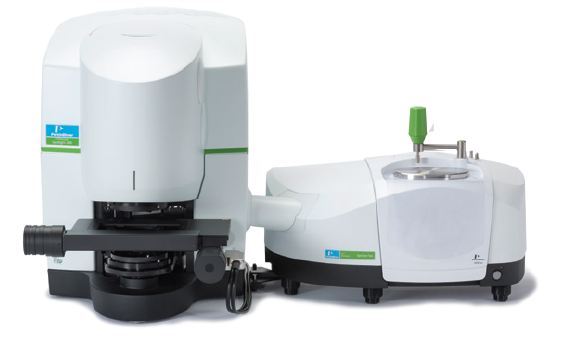
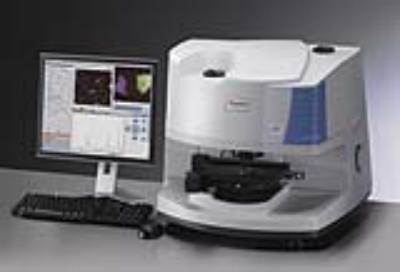
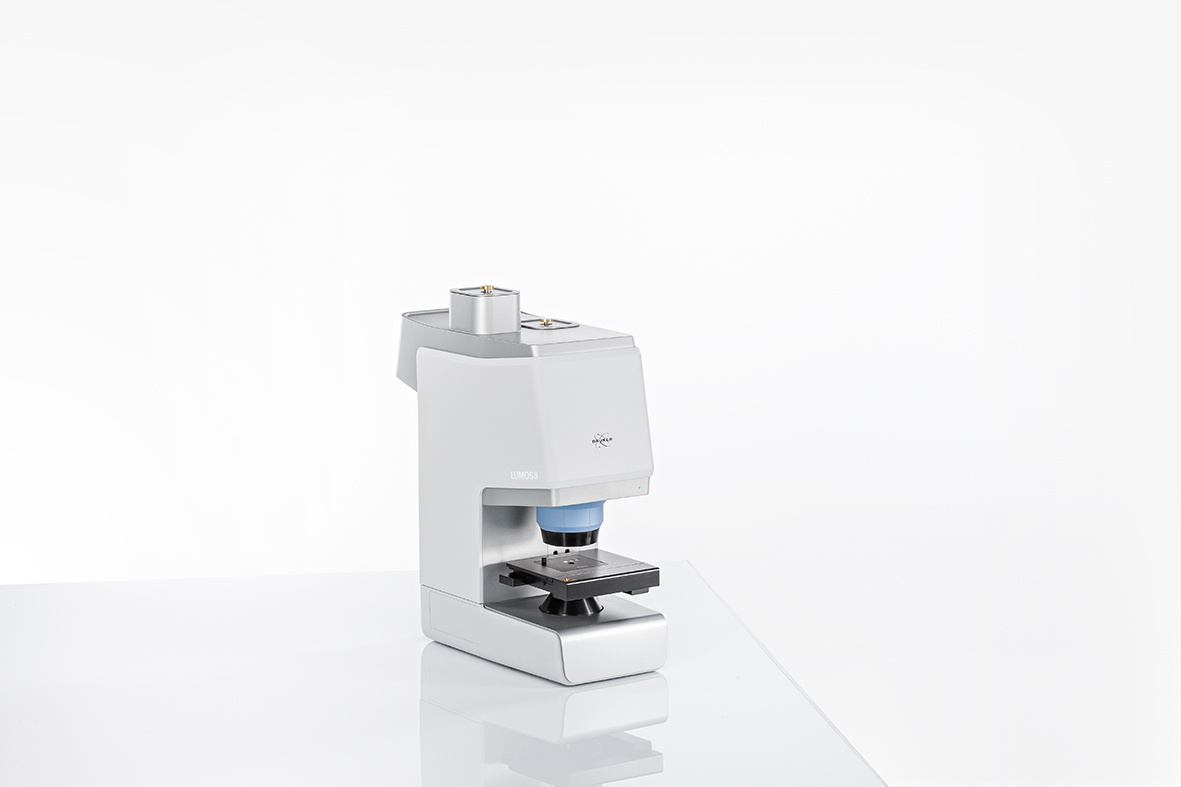
近年来,红外成像的应用和成像系统产生的数据呈爆炸式增长。从材料研究到癌症细胞和疾病的成像,以及作为聚合物和药物质量控制工具的使用,红外成像几乎应用于全球所有类型的实验室。随着样品分析出现新的挑战,红外成像系统必须为这些类型的分析提供额外的能力。带有集成线性阵列(LA)探测器的成像FT-IR显微镜系统为检测广泛的样本阵列提供了强大的工具,将这种灵活的成像系统与先进的图像处理软件相结合,可以轻松地为实验室科学家提供视觉相关的数据。FT-IR显微镜成像系统可以提供较大基质中非常小的污染物的简单光谱,或者提供关于化学成分分布的详细信息或其他类型的空间信息,即聚合物层压板中层的变化和分布。过去,FT-IR显微镜和成像系统一直是在红外光谱方面具有丰富经验的研究实验室或用户的领域。然而,JASCO IRT-5000/7000系列能够将FT-IR显微镜集成到最低级别的FT-IR仪器中,即使是普通用户也能获得FT-IR显微镜。降低拥有成本使允许任何能力的用户使用FT-IR显微镜。此外,该软件界面为操作提供了简单性,并为成像应用提供了高级功能。通过设计功能可升级的FT-IR显微镜系统,并满足所有类型用户的需求,IRT-5000/7000系列不仅可以提供购买时所需的功能,还可以随着实验室需求的增长提供扩展功能。IRT-5000 FT-IR显微镜系统在最基本的配置中,可以通过手动台和单元件MCT检测器获得。IRT-5000还可以随时升级,带有用于映射实验的XYZ自动载物台以及用于成像实验的多元线性阵列检测器。或者,可以指定IRT-7000,该成像系统结合了具有XYZ自动载物台的单元件MCT和多元件线性阵列检测器。任一系统上的单元件MCT检测器也可以指定为用户可互换的,从而提供将单元件MCT检测器与其他光谱范围检测器交换的能力,例如用于NIR实验的InGaAs或InSb检测器,或者甚至在没有液氮但具有扩展的中红外光谱范围的情况下使用的DTGS检测器。IRT-5000/7000系列能够包含多达4个目标以及可互换的ATR目标,可以支持广泛的样本可视化和数据收集功能。这些选项中的任何一个都可以随时添加到显微镜系统中,从而在分析实验室需要时将显微镜附件的功能扩展到成像或其他应用中。JASCO IRT-5000/7000系列FT-IR显微镜系统能够将系统从基本的单元件探测器显微镜附件不断升级为多元件探测器成像系统。数据收集和分析软件包为从各种类型的样本中收集数据提供了广泛的选项,并提供了大量的样本数据可视化功能。显微镜可以添加到JASCO FT/IR-4000或FT/IR-6000系列仪器中,提供从最基本的仪器平台到研究级光谱仪的显微镜或成像能力。IRT-5000/7000有多种选择,可以根据用户的指定提供显微镜和/或成像,只提供购买时所需的物品,但可以随时升级以扩展显微镜系统的功能。Application Note An Advanced Infrared Imaging System for Sample Analysis2/5 An Advanced Infrared Imaging System for Sample Analysi s Recent years have seen an explosive growth in the applications of infrared imaging and the data resulting from imaging systems. From materials research to the imaging of cancer cells and disease as well as uses as a quality control tool for polymers and pharmaceuticals, infrared imaging is being used in virtually every type of laboratory around the globe. As new challenges emerge for the analysis of samples, the infrared imaging system must provide additional capabilities for these types of analyses. An imaging FT-IR microscope system with an integrated linear array (LA) detector provides a powerful too l for the examination of a wide array of samples and combining this flexible imaging system with advanced image processing software can easily provide visually relevant data for the laboratory scientist. F T -IR microscope imaging systems can prov i de a simp l e spectrum of a very small contaminant i n a larger matrix or detailed i n formation about the distribution of the ch e mical constituents or other types of spatial information, i .e., the variation and distribution of layers in a polymer laminate.In the pas t, FT-IR microscopes an d imaging systems have been the realm of research laboratories or users with extens i ve experience in infrared spectroscopy. However,with the ability to integrate an FT -IR microscope to even the lowest level FT-IR instrument, the JASCO IRT-5000/7000se r ies brings FT-IR microscopy within reach of even a casual user . Figure 1. The JASCO IRT-7000 FT-IR microscope imaging system attac h ed to a JASCO FT/IR-6100inst r ument. The decreased cost of ownership allows users of any capability access to an FT-IR microscope. As we l l, the software interface provides simplicity for operation as well as advanced capabilities for i maging applications.By designing an F T -IR microscope system t hat is func t ionally upgradeable as well as accommodating the needs of all types of users, the IRT-5000/7000 series can provide not only those capabilities desi r ed at the t ime of purchase, but offer extended capabi l i ti es as l aboratory needs grow. The IRT -5000 FT -IR microscope system, i n t he most basic configuration, can be obtained with a manual stage and a single-element MCT detector. The IRT -5000 can also be upgraded at any time with an XYZ auto-stage for mapping exper i ments as well as a mult i -element l inear array detector for i maging experiments . Alternatively,the IRT -7000 can be specified (Figure 1), an imaging system incorporating both the single-element MCT and m ulti -element linear array detectors with an XYZ auto-stage. The s i ngle-element MC T detector on either system can also be spec i f i ed as user-interchangeable, providing t he capabi l ity to exchange the single-element MCT detector for other spectral range detectors such as an InGaAs or InSb detector for NIR experiments or even a DTGS detector for use without l iquid nitrogen bu t with an extended mid-IR spectral range. With the capabil i ty to incorporate up to 4 objectives as well as interchangeable ATR objectives , the IRT-5000/7000series can support a wide range of samp l e visualization and data collection capabilities. Any of these options can be added to t he m icroscope system at any ti me, providing the ability to extend the capabilities of the microscope accessory to i maging or o t her applications when desired by the analytical laboratory. All data was collected utilizing a Jasco FT/IR-6300 and IRT -7000 microscope . Sample spectra were collected with spectral resolutions ranging from 4 to 16 cm-1, with various accumulated scans for background and sample spectra as outlined below. F i gure 2 illustrates a video i mage (left) a n d infrared mapping image (righ t )of an ink stain on a reflective metal plate. Th i s data was collected using the IQ Mapping f unction of the IRT -5000/7000 system. A l i mited mapping of a sample can be accomplished using either the single point or multi-point detectors without movement of the auto-stage. Optical train mirrors before and after the cassegrain objective can be moved to collect data from the f ull planar area of the cassegrain focus. T his function can increase the speed of mapping or i maging data collection or can be used with the manual stage to provide m apping capabi l ity without the use of an automated XYZ stage. The mapping image is based on the peak height of the C-H stretching peak of the ink at 2962 cm-1, the corresponding spec t rum il l ustrated as Figure 4.The spectral da t a displayed in F i gu r es 2 and 3 were collected using eight scans per pixel at 16 cmresol u tion using a 12.5x12.5 micron aperture, t he total area o f 200 x200 microns collected in slightly m ore than one minute. 05 Figure 2. Video an d infrared i m ages of an ink stain on a met a l plate. Figure 3. I nfrare d spectrum of i n k stain The infrared spectral image data can be displayed as ‘false color' i m age maps based on peak intensity,calcu l ations of peak height /ratio data or peak area/ratio data. Additional calculations can also prov i de i mages based on peak shift or full-width at half maximum values . Image data from these various calculations can also be displayed as contour maps, ‘bird's eye'views of the peak informat i on and 3-D images to prov i de image contrast f or information purposes. These var i ous opt i ons are all available in the microscope data processing software (Figure 4). This software interface displays the automatically collected video i mages as well as individual spectra, image maps and calculated data for easy interpretation of t he collected data. If multi-point data is collected f rom m ultiple sample sites, t he individual spectra can be selected with the corresponding video images for each sample area. The analys i s sof t ware is available for use while the data collection is occurring within the data collec t ion package, providing simultaneous operation of t he microscope system and analysis of previously col l ected data . The image data displayed in Figure 4 is obtained f rom the area around the m int i ng date of a penny coin, the ‘yellow'i m age areas due to the skin proteins embedded around the raised m etal of t he date stamp. The imaging data was collected with the mult i -element linear array detector using 16 scans at 16 cm°1 resolution per 12.5 x12.5 micron pixel, the total area of 2 x 4 mm collected in about 35minutes for a total of 50,560 i n dividual spectra . Another example of the data display capabili t ies is demonstrated in F i gures 5 and 6, the ATR spectral images collected from a polymer laminate. The individual spectral images are represented in Figure 5, the i mage data based on specif i c absorption peaks in the polyethyl e ne, nylon and polyvinyl alcohol components of the l aminate. Overlaying the i ndividual images provides the ‘composite'image outlined within Figure 6,which provides a clea r display of t he margins of the individual components and any overlap of t he spectral data obtained by the ATR mapping experi m ent. Data f rom the 68x 44 um area was collected using the IQ m apping mode, mapping the i nterior of t h e Ge ATR element using t he linear array detector with 64spectral accumu l ations at 8 cmresolution. The 672 spectra of 2.2x2.2 micron spatial resol u tion required approximately eight minutes for collection of the displayed sample image data. Applicatio n Library: http://www.j ascoinc .com/appl i c a t i ons Figure 4. AT R spectral image data collected from a polymer l am i nate Figure 5. Microscope d a ta analysis software d ialog Figure 6. Composite ATR spectral image data of a polymer laminate;red - polyethy l ene , green -nylon, bl u e- polyamide/polyvinyl alcohol Applicatio n Library: http://www.j ascoinc .com/appl i c a t i ons For the a n alysis of polymer l aminates, i nformation concern i ng the identity and spatial distribution of the various layers can be of critical importan c e, verifying the prod u ction of the laminate or providing information on a compe t itive product . Collection of the ‘line-map'data using a very small aperture can provide th e desired information for the lami n ate layers and their spat i al arrangement . Fig u re 7 outlines the various spectr a of a polymer l aminate cross-sec ti on col l ected in transm i ssion mode. The 3-D display of the spectra as shown were collected with a 5 x50 micron aperture, using 8 cmresolution and 128 accumulations per spectrum with the single-point MCT detector on the IRT-7000 i maging system. Th e various spectra in t he f igure provided iden t i f ication of t he polyethylene, polypropyl e ne and nylon layers of the laminate as well as the spat i al distribution of the indiv i dual polymer layers. Indivi d ual spectra from the image map were selected and ver i fied with the use of a spectral search library while the spatial distribution of the laminate layers was determined from cross-section calculations of the signi f icant spectral peaks o f each component. T he figure readily demonstrates the di f ferent spectra and spatial distribution and can be easily rotated with the mouse within the microscope analysis software dialog, providing the ability to rapidly visualize features of interest within the i m a ge. Figure 7. 3-D display of l i ne-map spectra for a polymer l a minate of 5 individual l ayers Conclusions The JASCO I RT -5000/7000 series F T-IR m icroscope systems provide the capability to continually upgrade the system from a basic, single-element detector microscope accessory to a mult i -e l ement detector imaging system. The data co l lection and analysis software packages provide a wide range of options for data collection from various types of samples as well as numerous capabili t ies for sample data visualization. The microscope can be added to either t he JASCO FT/IR-4000 or FT /IR-6000 series instruments, provid i ng microscopy or imagi n g capability from the most basic i nstrument platform to a research-grade spectrometer. With numerous options availab l e, the IRT -5000/7000 can provide microscopy and/or i maging as specified by the user, offering only those items required at the t ime o f purchase, but upgradeable at any t i m e to extend the capabilities of the microscopy system. Applicatio n Library: http://www.j ascoinc .com/appl i c a t i ons
关闭-
1/5
-
2/5
还剩3页未读,是否继续阅读?
继续免费阅读全文产品配置单
佳士科商贸有限公司为您提供《具有线性阵列MCT检测器的先进FTIR成像系统》,该方案主要用于生物药品药物研发中多元件探测器成像系统检测,参考标准《暂无》,《具有线性阵列MCT检测器的先进FTIR成像系统》用到的仪器有JASCO FTIR-4000傅立叶变换红外光谱仪、jasco红外显微镜(IRT-5200)、JASCO红外显微镜IRT-7200。
我要纠错
推荐专场
其它光谱仪
更多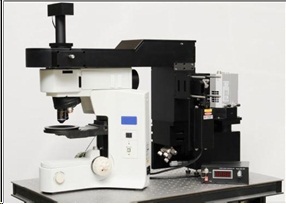
相关方案
 咨询
咨询