
摆度
第1楼2014/09/17
First some questions back to you and some fundamental comments.
- The above 2 curves from journal paper or they are your data?
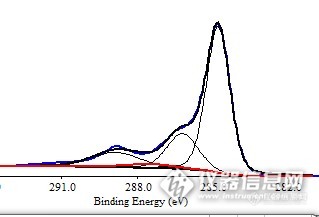
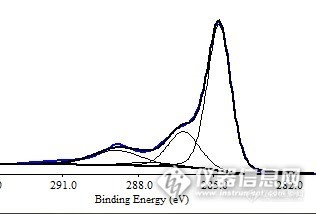
- The fit on the right spectrum, there is a peak at ~289eV. That peak seems to have much bigger FWHM than other 2 peaks?
- For C1s peak fitting, usually you would expect "similar" FWHM amongst all fitted peaks, e.g. C-O, C=O, -COO >> BUT important is usually C-C/C-H peak is a little fatter (bigger FWHM) than other C1s-chemical state peaks. It is because this peak actually contain 2 forms (C-C and C-H) which cannot resolve by XPS, so due to this overlap this peak is a bit fatter always.
Next is answers to your questions:
- Using the above 2 spectrum as example, I think we can start with shifting the righter-most peak to 284.8eV as assigning it to be C-C/C-H peak.
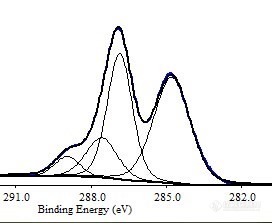
- From there onward, you can start with for example the left spectrum and perform fitting. The fit shown above left spectrum looks quite reasonable. Make sure the FWHM are similar with C-C/C-H peak could be with a little bigger FWHM.
- Then for right spectrum, you can try using same 4 peaks to fit. From above fit with 3 peaks, the peak at 289eV seem fatter than C-C/C-H peak > which mentioned above base on fundamental it may indicate the fit is not correct. There should be a 4th peak inside this C1s peak.
- The fitted 4 peaks parameters should be same if you are assigning them to be same 4 chemical state. So expect them to be exact SAME peak position and do NOT allow even a few eV difference. (This is ideal case, but if smaller than 0.1~0.2eV difference can make better fit it can be tolerable but it also means your data is not good. It means if your data is good it should be no problem for fitted 4 peaks to fall at exactly same peak energy)
- You should NOT perform SMOOTH on the spectrum. If the spectrum is not smooth, it means your original data S/N is bad so you should go back and re-run your analysis to get good enough S/N spectrum. After SMOOTH, data can be a little change so always NOT suggested.
摆度
第3楼2014/09/17
I understand your questions.
Let me ask some questions:
1. Are these 2 data using same analysis parameters (e.g. X-ray spot size, Pass Energy, step size.... all same)???
2. I hope you understand that your target should NOT just think you want to "fit 4 peaks". First, for example start from left spectrum, the fit result gave 4 peaks. Can you comment each of the 4 peaks Chemical state? You should be able to assign Chemical state of each of these 4 peaks if you believe this fitted result is correct.
> Then next is if exactly same 4 Chemical state of Carbon (you assigned from left spectrum sample) also confirm to appear on the other sample (right spectrum). If the answer is YES, then you should be able to use same fitting parameters to fit the curve.
***But from your data, the spectrum shape seems quite different between the 2 samples.
> After all, the objective for doing curve fit = separating overlapping peaks and in your case the overlapping peaks meant for different Chemical state of Carbon. So you need to assign them first and prove your fitting is making sense.
3. Can you attached your raw data files? What software do you use to fit the spectrum? I can possibly try to fit your data too.
摆度
第6楼2014/09/23
I do not know why but I cannot download your data files (shown as 未验证). Anyway, base on your Chemical state assignment, I try to give more of my suggestion:
When assigning Chemical, my experience for C1s peak is:
C-C = 284.8eV Binding Energy (BE)
C-O > +1.5eV shifting to high BE
C=O > +2.75~3.2eV shifting to high BE
-COO > ~3.95~4.4eV shifting to high BE
Looking back to your spectrum.
(1) First on left spectrum above
It seems to have high C=O bonding peak (the highest peak), and it is about ~2.5V shifting from main C-C peak (so quite close to above C1s Chem state shift). I think there exist some C-O in this spectrum too. So I think you need to make curve fit of this with peaks at:
284.8 C-C
286.3 C-O
~287.5 C=O
~289 -COO (COOH)
(2) Then to the right spectrum
If you believe they should carry the same 4 Chemical state and both data run at same analysis condition, you should use same 4 peaks to fit the spectrum (fixed the peak position).
Honestly speaking I am not expert in your material but from your spectrum, your left spectrum is showing much higher C-O and C=O, and also a little more -COO also. While right spectrum seems more of the C1s is of C-C/C-H bonding.
m3168899
第10楼2018/04/11
复制的吧?