

方案详情文
智能文字提取功能测试中
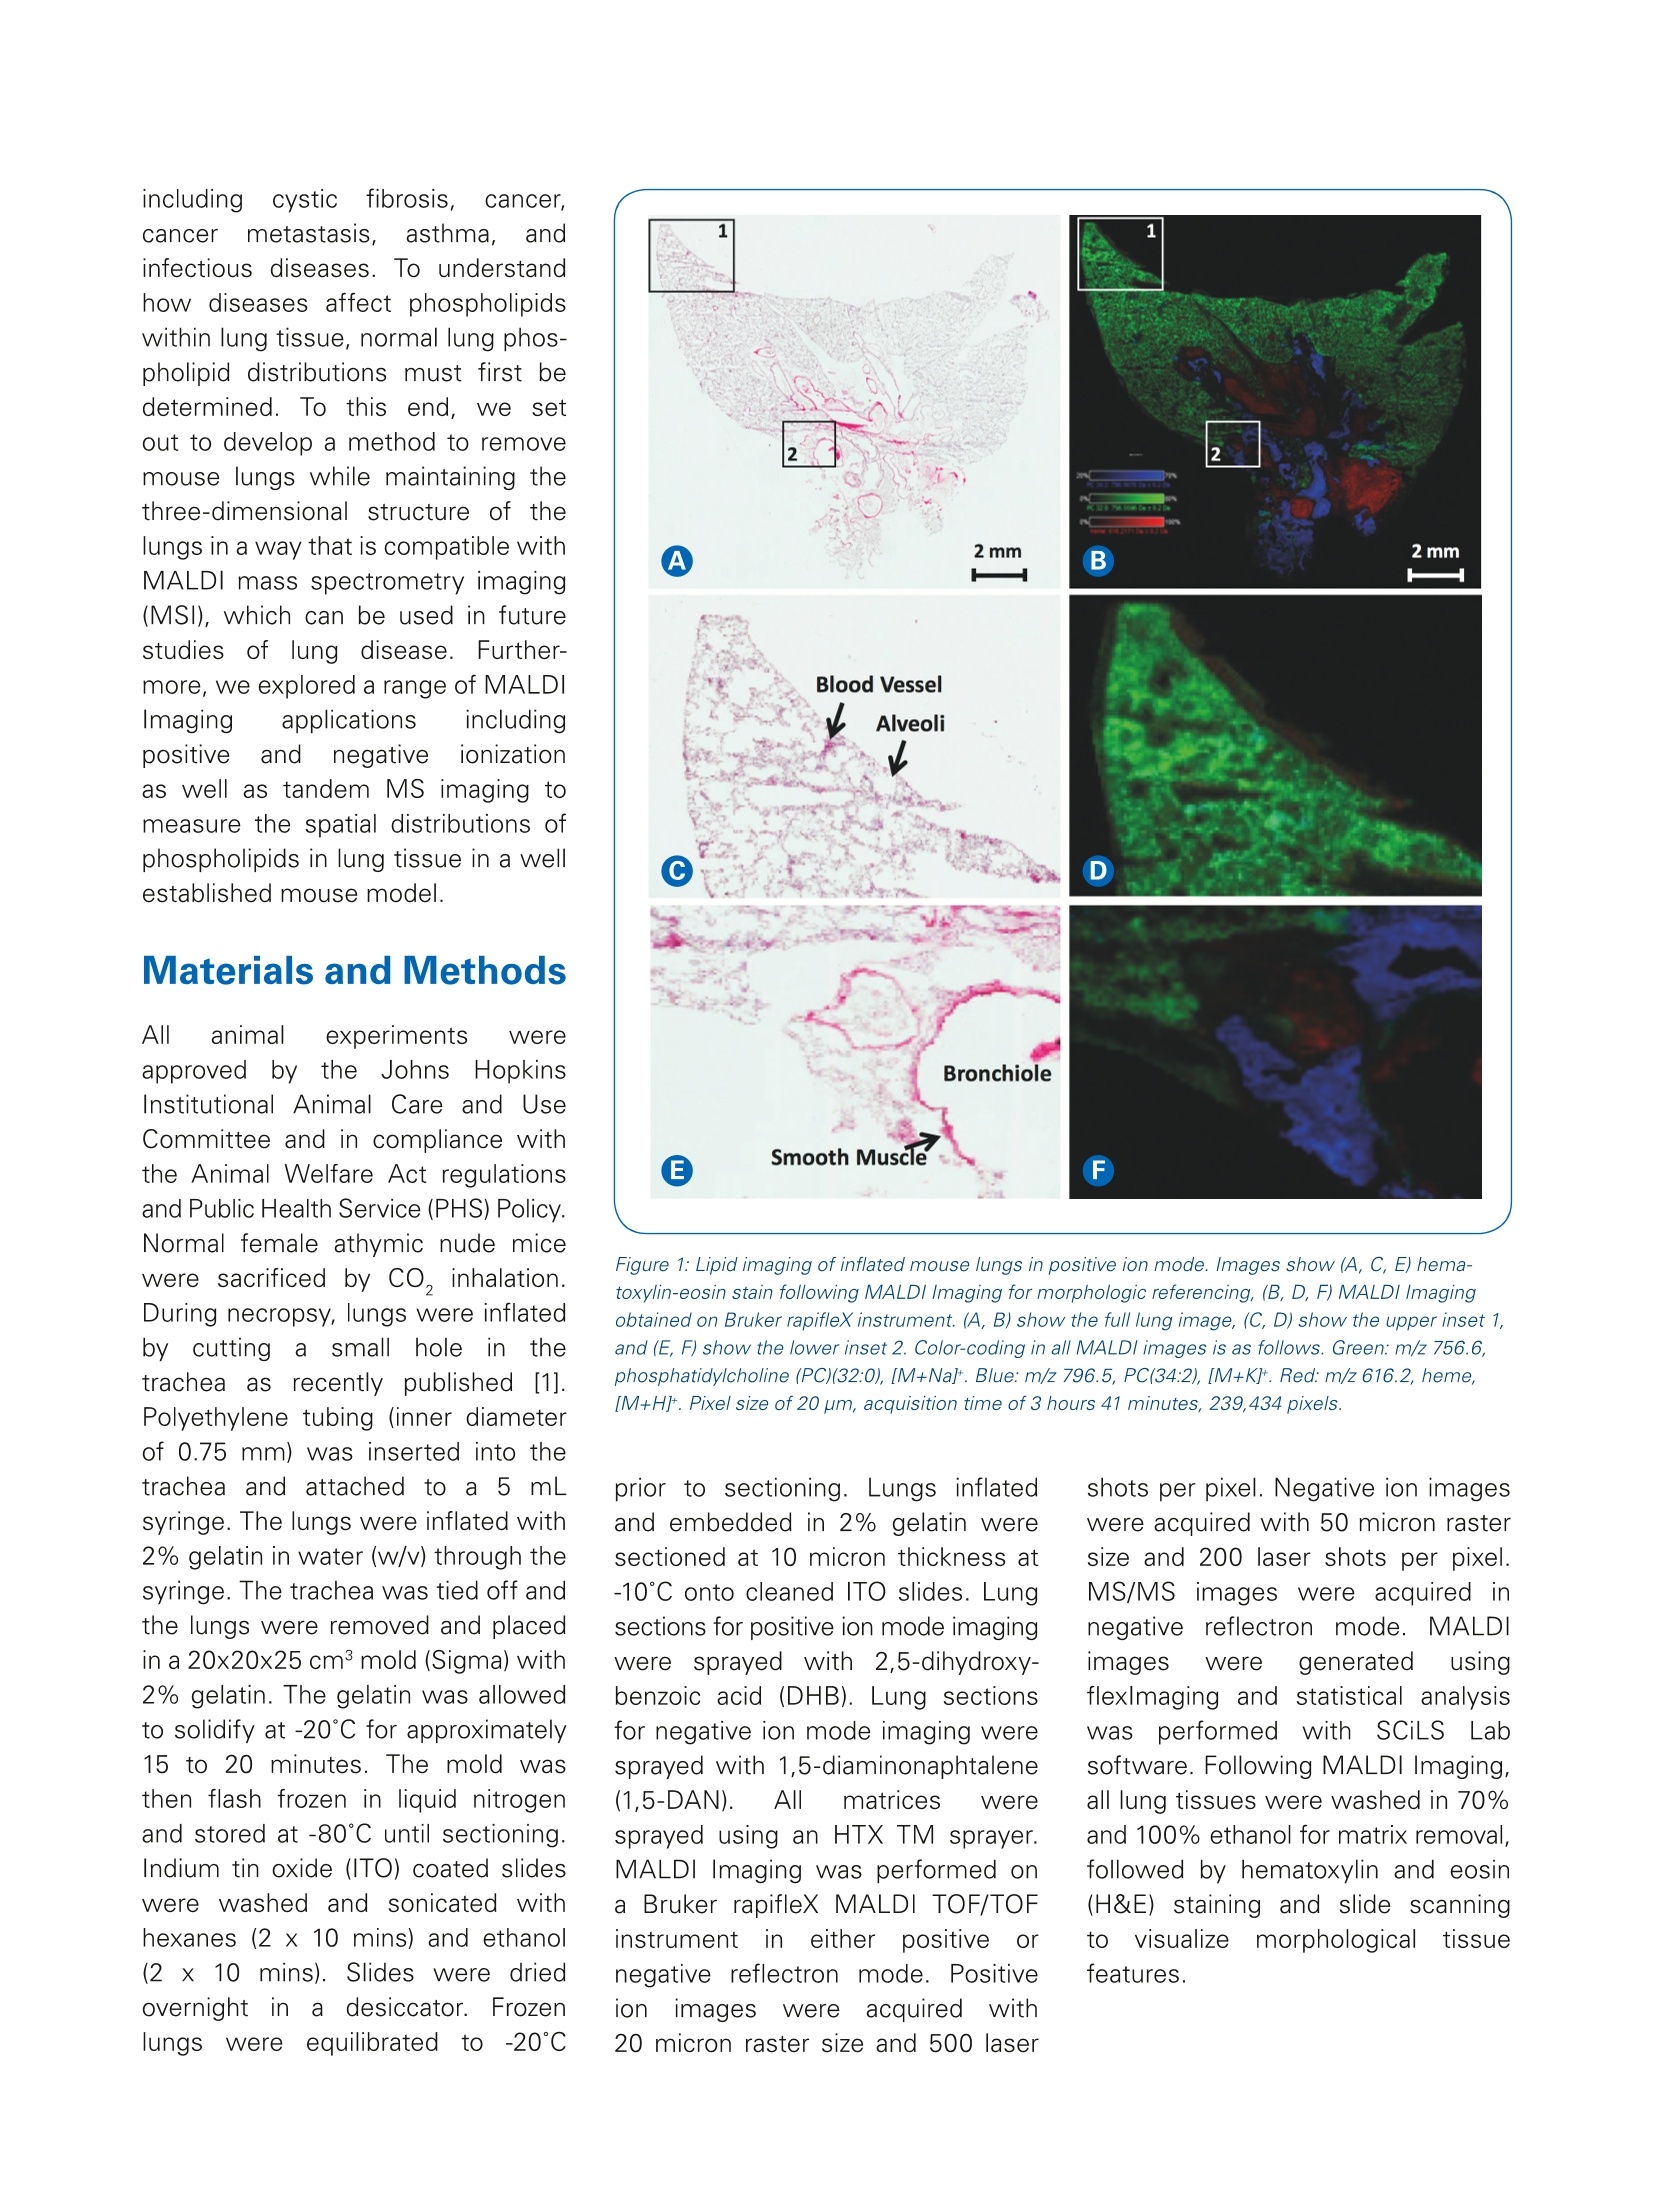
MALDI Mass Spectrometry Imaging RevealsDistinct Spatio-Molecular Phospholipid Distributionsin Mouse Lungs While phospholipids play key roles in lung physiology and pathology, the complexcomposition and function of the lipidome in the lungs is poorly understood.We applied MALDI mass spectrometry imaging to characterize the spatial distributionof phospholipid molecules in mouse lungs. Introduction Keywords:MALDIMSI, lungs,lipid imaging Using a combination of MALDIImaging and on-tissue MS/MS innegative ion mode, we imagedand identified phosphatidylinositol(Pl), phosphatidylglycerol((PG),andphosphatidicaacid (PA)species that weredistinctlydistributed in spatial subregions of normalmouselungs.Theobtained results will be useful forfuture studies that seek to maplipid alterationsin pulmonarydisease, including tuberculosis,asthma, pulmonary fibrosis, lungcancer, and metastatic spread tothe lungs, among others. Phospholipids play acriticalrole in structure and function oflung tissue; however, the spatialdistributions of these lipids arenot well characterized. Lungsare a common site of disease ( A u tho r s : Ca i tli n M . T r essl e r , C ri s tina l . Silvescu , S h a nnon C o r n ett , K a n c h an S o n k a r ',Olu wa t ob i Ade l aj a ' , R u o q i ng C ai, Vi na y A y y ap pa n ' , K ri s t i n e G l u nde1 3 ; R u s s el l H . M organ D e p ar tment o f R a d iolo g y a n d R a d io l o gica l S c ie n c e, D i v is i o n of C a nce r I ma gin g R ese a r c h , J o h n s H o p k in s U n i v ers i ty S ch o o l of M ed i cin e, B al t imor e , MD, U S A ; 2 B ru ke r D alt o ni c s , B i l l eri c a , MA , U S A; 3 S i d ne y K i m mel C om pr e he ns i ve C a n c e r Ce n t er , J oh n s H o p ki ns U n i v e r sit y Sch o o l o f M ed i ci n e, B alt i more, MD , U S A ) including cystic fibrosis, cancer.cancermetastasis. asthma.andinfectious diseases. To understandhow diseases affect phospholipidswithin lung tissue, normal lung phos-pholipid distributions must first bedetermined. To this end,we setout to develop a method to removemouse lungs while maintaining thethree-dimensional structure of thelungs in a way that is compatible withMALDI mass spectrometry imaging(MSI), which can be used in futurestudies of lung disease. Further-more, we explored a range of MALDIImaging applications includingpositive andnegativeionizationas well as tandem MS imaging tomeasure the spatial distributions ofphospholipids in lung tissue in a wellestablished mouse model. Materials and Methods All anima experiments wereapproveddbby theJohnssHopkinsInstitutional Animal Care and UseCommittee and in compliance withthe Animal Welfare Act regulationsand Public Health Service (PHS) Policy.Normal female athymic nude micewere sacrificed by CO, inhalation.During necropsy, lungs were inflatedbycuttingasmallholeein thetrachea asrrecently published[1].Polyethylene tubing (inner diameterof 0.75 mm) was inserted into thetrachea and attached to a 5 mLsyringe. The lungs were inflated with2% gelatin in water (w/v) through thesyringe. The trachea was tied off andthe lungs were removed and placedin a 20x20x25 cm mold (Sigma) with2% gelatin. The gelatin was allowedto solidify at -20C for approximately15 to 20 minutes. The mold wasthen flash frozen in liquid nitrogenand stored at -80℃ until sectioning.Indium tin oxide (ITO) coated slideswere washed and sonicated withhexanes (2x 10 mins) and ethanol(2 x 10 mins).Slides were driedovernight inadesiccator. Frozenlungswere eequilibrated to -20℃ Figure 1: Lipid imaging of inflated mouse lungs in positive ion mode. Images show (A, C, E) hema-toxylin-eosin stain following MALDI Imaging for morphologic referencing,(B, D, F) MALDI Imagingobtained on Bruker rapifleX instrument. (A, B) show the full lung image, (C, D) show the upper inset 1,and (E, F) show the lower inset 2. Color-coding in all MALDIimages is as follows. Green: m/z 756.6,phosphatidylcholine (PC)(32:0),[M+Nal. Blue: m/z 796.5, PC(34:2), [M+K]. Red: m/z 616.2, heme,[M+H]t. Pixel size of 20 um, acquisition time of 3 hours 41 minutes, 239,434 pixels. prior to sectioning. Lungs inflatedand embedded in 2% gelatin weresectioned at 10 micron thickness at-10°℃ onto cleaned ITO slides. Lungsections for positive ion mode imagingwere sprayed with2,5-dihydroxy-benzoic acid (DHB). Lung sectionsfor negative ion mode imaging weresprayed with 1,5-diaminonaphtalene(1,5-DAN). All matrices weresprayed using an HTX TM sprayer.MALDI Imaging was performed ona Bruker rapifleX MALDI TOF/TOFinstrumentirineither positive (ornegative reflectron mode. Positiveionimageswereacquiredwith20 micron raster size and 500 laser shots per pixel. Negative ion imageswere acquired with 50 micron rastersize and 200 laser shots per pixel.MS/MS images were acquired innegative reflectron mode. lMALDIimages were generated usingflexlmaging and statistical analysiswasperformed withSCiLSLabsoftware. Following MALDI Imaging,all lung tissues were washed in 70%and 100% ethanol for matrix removal,followed by hematoxylin and eosin(H&E) staining and slide scanningtovisualize morphological l tissuefeatures. Figure 2: Tissue segmentation analysis of mouse lungs imaged in positive ion mode. Using the automated spatial segmentation feature of the SCiLS Labsoftware, prominent features were annotated in the obtained MALDI Imaging data. The same MALDI Imaging data from gelatin-inflated mouse lungsas in Figure 1 is shown here following automated tissue segmentation analysis, highlighting several distinct spatial features, which are extracted fromcharacteristic spectral features. Figure 3: Lipid imaging of inflated mouse lungs in negative ion mode. lmages show A optical image of inflated lung tissue and B segmentation map andhierarchical clustering obtained in SCiLS Lab. Unsupervised segmentation analysis revealed several distinct lung regions with specific lipid compositions,which included muscle tissue, trachea, bronchioles of various sizes, alveoli, connective tissue, and small blood vessels. Pixel size of 50 pm, acquisition timeof 37 minutes, 79,425 pixels. Positive lon Imaging Positive ion lung images revealedunique distributions of phospholipids,based on different structures withinthe lung.The MALDI images irinFigure1 show that m/z 756.6,identified as sodiated phosphatidyl-choline (PC)(32:0), surrounds alveoliin the lobes of the lungs (Figure 1C,D, shown in green). In the morecentral part of the lungs, m/z 796.5,assigned to) potassiatedPC(34:2)wasmore abundant, surroundingbronchioles and the trachea (Figure 1E,F, shown in blue). Heme at m/z616.2 was visible in the central part of the lungs (Figure 1E, F, shown inred). These data demonstrate thatdifferent phosphatidylcholinesandheme outline unique morphologi-cal structures in the lungs. Thesephophatidylcholine distributions co-localize with structures visible in theH&E images showing little to nodelocalization. The positive ion lung image wasimported into SCiLS Lab, and seg-mentation analysis was performed(Figure 2). 1The segmentation wasable toddifferentiate prominentanatomicallung structures, whichwere also observeddinthe H&Eimage.C.The centralarea ofthelungs contained relatively uniformly segmented lipid components, whilethe lobes of the lungs were seg-menteddinto tfinelydifferentiatedanatomical structures composed ofdifferent phospholipids.The bron-chioles and trachea were the firststructures to be segmented.Thelobes of the lungs were segmentedinto areas containing alveoli and bloodvessels, which were composed ofdifferent phospholipid distributions. Negative Ion Imaging and MS/MSExperiments Depending on their molecular compo-sition, specific classes of phospholipidsionize only in negative reflectronmode. Negative ion images were also Figure 4: Overall negative ion lipid spectrum from lung tissue. Several high (m/z 885.5, m/z 687.5), intermediate (m/z 797.5, m/z 857.5), and low(m/z 909.5, m/z 861.5, m/z797.5) abundance m/z signals, as indicated by red asterisks, were analyzed in MS/MS mode. Inset shows the overall structure ofphosphatidylinositols (PIs). The red arrow points out m/z 857.5, which was analyzed by MS/MS imaging. Figure 5: The parent ion m/z 857.6 was selected for MS/MS imaging on an adjacent section to determine identity and spatial distribution of all fourphosphatidylinositol (PI) species. The inset shows the image of m/z 857.6. acquired, and the data was used forunsupervised segmentation in SCiLsLab (Figure 3). Different distributions寸phospholipidsvwere observedmnspecific anatomicalstructures.including muscle tissue from the heartor diaphragm, bronchiole, and alveoli.Notably, the muscle tissue was one of the first tissues to be revealed inthe segmentation analysis, followedby the lobes of the lungs, showinguniqueephospholipid distributionsin different types oftissue(i.emuscle vs. lung), as well as specificlocalization of different phospholipidsto different parts of the lung. Several m/z signals were selectedfrom the overall negativeeiionspectra for MS/MSsexperiments(Figure4.+,redasterisks).MS/MSimages revealed a number ofpeaks, which were analyzed in bothflexlmaging and usinggtthe gly-cerophospholipidprecursor/product Figure 6: Selected fragment ion images obtained by MS/MS imaging of the parent ion m/z 857.6, highlighting unique fragmentation patterns of different lipidspecies that are constituting the parent ion of m/z 857.6. Insets are enlarged by a factor of 3. M/z 571.4, shown in yellow, corresponds to the loss of thesn1 acy/ chain as (RCH=C=O) from [M-H] of P/(20:4/16:0), localizing to the periphery of the lung. M/z 577.4, shown in green, corresponds to the neutral lossof the sn2/sn1 RCOOH group from [M-H|of P/(18:2/18:2),localized to muscle tissue. M/z 581.4, shown in magenta, corresponds to the neutral loss of thesn2 RCOOH group from [M-H] of PI(18:0/18:4), localizing to connective tissues throughout the lungs, and with highest intensity in muscle tissue. M/z 593.3,shown in red, corresponds to the loss of the sn1 acy/ chain as (RCH=C=O) from [M-H] of PI(18:1/18:3), which is spatially distributed throughout the lungs. ion database in Lipid Maps [2]. Weidentified m/z 909.5 to be composedof a mixture of PI(22:6/18:0) andPI(20:4/20:2),). localizedtoimuscletissue, connective tissue, andaveoli. M/z 885.5 was identified tobe PI(20:4/18:0) and was nonspe-cifically distributed throughout thelung. M/z 861.5 was localized to themusclee 1tissue and was identifiedasPI(18:2/18:0).M/z797.5wasidentified as PG(18:0/20:4) and m/z687.5as PA(O-18:1/18:1), both ofwhich localized to connective tissuein the lungs. Negative lon MS/MS Imaging ofm/z 857.6 On-tissue MALDI ionization generatescomplex spectra, often containingmultiple isobaric lipid species. Spe-cific tissue distributions of theseisobaric lipids can be identified byacquiring images in MS/MS mode.The fragment ion spectrum of m/z857.6 (Figure5) identifieddffourdifferent phosphatidylinositol isomers,all of which displayed different distri-butions throughout the lung (Figure 6).Selected fragment ion images obtained by MS/MS imaging of theparent ion m/z 857.6, highlight uniquefragmentation patterns of differentlipid species constituting the parention of m/z 857.6 (Figure 6). Insets areenlarged by a factor of 3. Fragmention m/z 571.4, shown in yellow,corresponds to the loss of the sn1 acylchain as (RCH=C=O) from [M-H].Neutral loss of the sn2 RCOOH groupand inositol from [M-H]-(m/z 391.2)and the sn1 RCOO- ion (m/z 303.2)wereobserved with the samespatial distributionnas m/z 571.4.This fragmentation pattern identified PI(20:4/16:0), which is localized tothe periphery of the lung. Fragment ion m/z 577.4, shown ingreen, corresponds to the neutral lossof the sn2/sn1 RCOOH group from[M-H]. The sn2/sn1 RCOO· ion (m/z279.2) was observed with the samespatialddistribution asm/z 577.4,which was identified as PI(18:2/18:2)and localized to muscle tissue aswell as the periphery of the lung.Fragment ion m/z 581.4, shown inmagenta, corresponds to the neutralloss of the sn2 RCOOH group from[M-H]. The loss of the sn2 acyl chainas(RCH=C=O) from[M-H](m/z599.3), neutral loss of the sn1 RCOOHgroup andinositol ffrom [M-H]-(m/z 411.2), and the sn1 RCOO ion(m/z 283.3) were observed with thesame spatial distribution as m/z581.4.This fragmentation pattern wasidentified as PI(18:2/18:2) and loca-lized to connective tissues throughoutthe lungs, and with highest intensityin muscle tissue. Fragment ion m/z593.3, shown in red, correspondsto the loss of the sn1 acyl chain as(RCH=C=O) from [M-H]. The neutral loss of the sn1 RCOOHgroup from [M-H] (m/z 579.3), neu-tral loss of the sn2 RCOOH groupand inositol from [M-H]-(m/z 417.2),and the sn1 RCOO ion (m/z 281.3)were observed with the same spatialdistributionnas m/z5593.3. Thisfragmentation pattern identifiedPI(18:1/18:3) and was spatiallydistributedthroughoutthe lungs.Morphological structures werevisualized by H&E staining and slidescanning of the same tissue sectionsfollowing MS/MS imaging. TheseMS/MS images clearly demonstratethe power of image acquisition inMS/MS mode to identify and differ-entiate isobaric phospholipids basedon theirffragmentationn Kpatternsand the tissue distributions of eachfragment ion. The ability to visualizethe tissuedistributionof ieachTragmentt ionngaveusadditionalconfidence in their identification, asfragment ions generated from thesame Pl species showed the sametissue distribution patterns. and negative ions detected are mostly phosphatidylinositols. Segmentation in SCiLs Lab can be applied to the data analysis of both positive and negative ion images to visualize prominent anatomical structures from phospholipid images. On-tissue MS/MS profiling or MS/MS imaging of lung tissue can be utilized to differentiate phospholipids with overlapping or Learn More You are looking for further Information?Check out the link or scan the QR code for more details. www.bruker.com/rapiflex References [1]] Scott AJ, Chandler CE, Ellis SR, Heeren RMA, Ernst RK (2019). Maintenance of deep lung architecture and automatedairway segmentation for 3D mass spectrometry imaging. Scientific Reports 9, 20160. [21Fahy E, Sud M, Cotter D, Subramaniam S (2007). LIPID MAPS online tools for lipid research. Nucleic Acids Research 35,W606-12. For Research Use Only. Not for Use in Clinical Diagnostic Procedures. Bruker Daltonik GmbHBru ker Sc ien tif ic LLC Bremen· GermB il l er ic a , M A · U SA a ny Phone +49 (0)421-2205-0 Phone +1 (978) 663-3660 ms.sales.bdal@bruker.com-www.bruker.com While phospholipids play key roles in lung physiology and pathology, the complexcomposition and function of the lipidome in the lungs is poorly understood.We applied MALDI mass spectrometry imaging to characterize the spatial distributionof phospholipid molecules in mouse lungs.
关闭-
1/8
-
2/8
还剩6页未读,是否继续阅读?
继续免费阅读全文产品配置单
布鲁克·道尔顿(Bruker Daltonics)为您提供《老鼠肺中分子磷脂检测方案(液质联用仪)》,该方案主要用于其他中生化检验检测,参考标准《暂无》,《老鼠肺中分子磷脂检测方案(液质联用仪)》用到的仪器有布鲁克 timsTOF fleX 组学和成像质谱系统。
我要纠错
推荐专场
相关方案
 咨询
咨询