乳腺癌患者的肿瘤组织中深度蛋白组分析检测方案(液质联用仪)
检测样品 其他
检测项目 生化检验


方案详情文
智能文字提取功能测试中
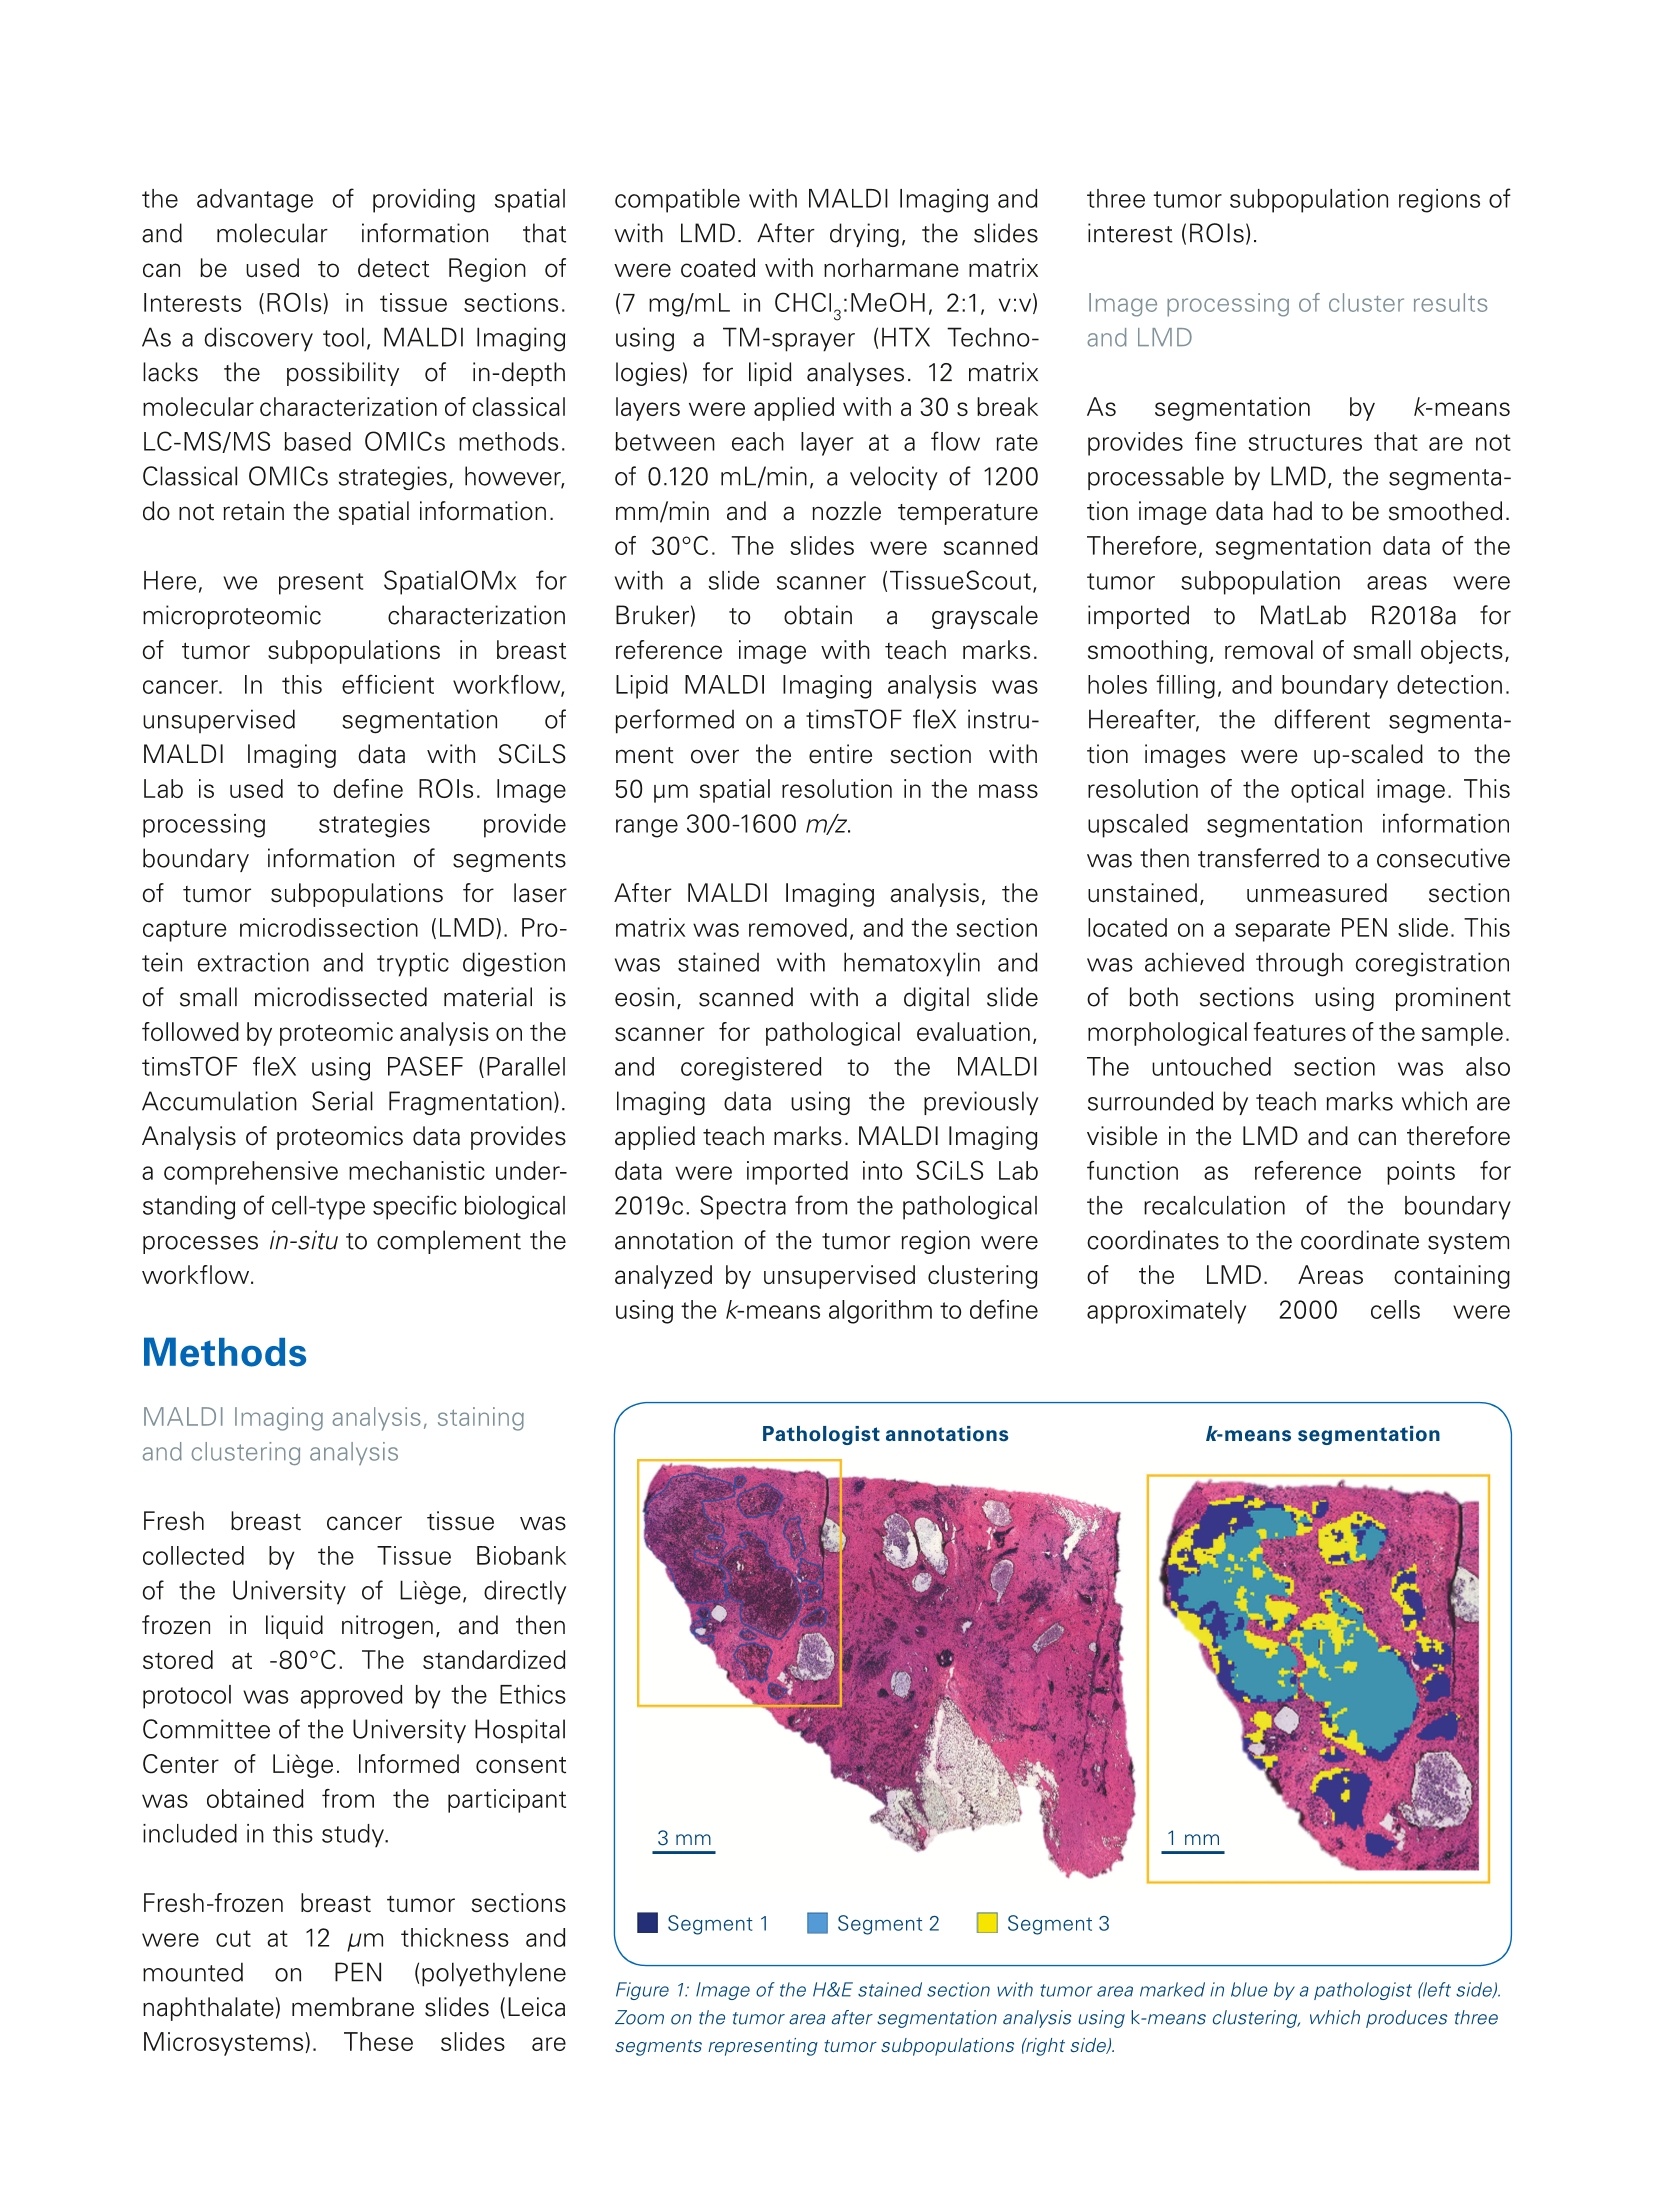
Authors: Janina Oetjen', Romano Hebeler’, Frederic Dewez, Corinna Henkel', Benjamin Balluff?, Ron Heeren?; MALDI Guided SpatialOMx uncovers proteomicprofiles in tumor subpopulations of breast cancer MALDI Guided SpatialOMx provides an excellent possibility to discover deepproteomics insights into heterogeneous tumor subpopulations by retaining theregiospecific information of an imaging technique. Abstract Introduction Keywords:SpatialOMx, MALDIImaging, ProteomicsPASEF The timsTOF fleX system bridgesa current gap by providing MALDIImaging and in-depth proteomicsanalysis in just one instrument.The instrument offers all ben-efits of a timsTOF Pro for time-efficient and sensitive proteomics,combined with a high-resolution MALDI source and stage. UsingPASEF technology, it is possibleto retrieve high protein ID rateswith smallsample amounts.Hereewe present the newSpatialOMx workflow to identifydistinct proteomic profiles fordifferent tumor subpopulations inbreast cancer as an example forthis powerful approach. Since tissue and disease are cor-related, SpatialOMx provides theunique opportunity to combineregiospecific informationfromMALDI Imagingwithdeepproteomic coverage for biomarkerdiscovery and molecular charac-terization. MALDI Imaging has ( ' Bruke r D alt o n i k G m b H, B rem e n, G e rm a ny;2 Ma as tri c ht Mu l t iMo da l Mo l e c ul ar I m a g in g In s t i t u te (M 4I ) , U n i ver sit y o f M aastr ic ht, M aastr ic ht, The N e t he r la n ds ) the advantage of providing spatialand molecularrinformation thatcan be used to detect Region ofInterests (ROls) in tissue sections.As a discovery tool, MALDI Imaginglackstheepossibility offin-depthmolecular characterization of classicalLC-MS/MS based OMICs methods.Classical OMICs strategies, however,do not retain the spatial information. Here, we present SpatialOMx formicroproteomic characterizationof tumor subpopulations in breastcancer. In this efficient workflow,unsupervised segmentation ofMALDI Imaging data with SCiLSLab is used to define ROls. Imageprocessing strategies provideboundary information of segmentsof tumor subpopulations for lasercapture microdissection (LMD). Pro-tein extraction and tryptic digestionof small microdissected material isfollowed by proteomic analysis on thetimsTOF fleX using PASEF (ParallelAccumulation Serial Fragmentation).Analysis of proteomics data providesa comprehensive mechanistic under-standing of cell-type specific biologicalprocesses in-situ to complement theworkflow. Methods MALDI Imaging analysis, stainingand clustering analysis Freshbreastccancerttissue wascollected byytheTissueeBiobankof the University of Liege, directlyfrozen in liquid nitrogen, and thenstored at -80°C. The standardizedprotocol was approved by the EthicsCommittee of the University HospitalCenter of Liège. Informed consentwas obtained from the participantincluded in this study. Fresh-frozen breast tumor sectionswere cut at 12 um thickness andmountedConPEN (polyethylenenaphthalate) membrane slides (LeicaMicrosystems). These slides are compatible with MALDI Imaging andwith LMD. After drying, the slideswere coated with norharmane matrix(7 mg/mL in CHCI:MeOH, 2:1, v:v)using a TM-sprayer (HTX Techno-logies) for lipid analyses. 12 matrixlayers were applied with a 30 s breakbetween each layer at a flow rateof 0.120 mL/min, a velocity of 1200mm/min and a nozzle temperatureof 30°C. The slides were scannedwith a slide scanner (TissueScout,Bruker) to obtain a grayscalereference image with teach marks.Lipid MALDI Imaging analysis wasperformed on a timsTOF fleX instru-ment over the entire section with50 um spatial resolution in the massrange 300-1600 m/z. After MALDI Imaging analysis, thematrix was removed, and the sectionwas stained with hematoxylin andeosin, scanned with a digital slidescanner for pathological evaluation,andd coregisteredto ttheMALDIlmaging data using the previouslyapplied teach marks. MALDI Imagingdata were imported into SCiLS Lab2019c.Spectra from the pathologicalannotation of the tumor region wereanalyzed by unsupervised clusteringusing the k-means algorithm to define three tumor subpopulation regions ofinterest (ROIs). Image processing of cluster resultsand LMD As segmentation by k-meansprovides fine structures that are notprocessable by LMD, the segmenta-tion image data had to be smoothed.Therefore, segmentation data of thetumor subpopulationareas wereimported to MatLabbR2018aforsmoothing, removal of small objects,holes filling, and boundary detection.Hereafter, the different segmenta-tion images were up-scaled to theresolution of the optical image. Thisupscaled segmentation informationwas then transferred to a consecutiveunstained, unmeasured sectionlocated on a separate PEN slide. Thiswas achieved through coregistrationof both sections using prominentmorphological features of the sample.The untouched section wasSalsosurrounded by teach marks which arevisible in the LMD and can thereforefunction as reference pointsforthe recalculation of the boundarycoordinates to the coordinate systemof the LMD.. Areasiscontainingapproximately 2000 cells were Figure 2: Image processing pipeline to produce ROI boundary information as x,y-coordinates for laser capture microdissection from segmentation raw data.The workflow includes smoothing, removal of small objects, holes filling, boundary detection and up-scaling to the optical image. dissectedfromeeach segmentedtumor subpopulation with aaLeicaLMD7000 and directlyttmransferredto reaction tubes for microextractionand tryptic digestion. Sample preparation for proteomics Samples for protein identification byPASEF on the timsTOF fleX wereprocessed as described [2]. Briefly,extraction solution was added, andsamples were heated at 99°C for1 h. The pH was adjusted to 7.4,samples were reduced and alkylatedand digested overnight at 37°C withtrypsin. After digestion, sampleswere dried and desalted using ZipTippurification. Proteomics data acquisition usingPASEF technology on the timsTOFfleX Microextracted peptide samples wererun on a Bruker nanoElute systemusing a one column setup equippedwith an Aurora 25 cm x 75um1.7pm C18 column (lonOpticks,Parkville, Australia). 0.1% formic acid, 2% acetonitrile in water was usedas eluent A, and 0.1% formic acidin acetonitrile as eluent B with a400 nL/min gradient at 50°C oven tem-perature. The Bruker CaptiveSpraynano source was used as inlet into thetimsTOF fleX system using 3.0 L/mindry gas at 180℃ and 1.6 kV capillaryvoltage. Data were acquired in themass range of 100-1700 m/z and themobility range was set to 0.6-1.6 1/k .For MS/MS fragment spectra acqui-sition, 10 PASEF scans at 100 mswere run, from which each containsaround 12 MS/MS events resulting ina >100 Hz acquisition rate. Analysis of proteomics data PEAKS X (Bioinformatics SolutionsInc, Waterloo, Canada) wasSIusedfor protein identification. Databasesearches were carried out against aSwissProt human database using aparent mass error tolerance of 15 ppmand aftragmentmass toleranceof 50 mDa. Trypsin was used asproteolytic enzyme and maximally2 missed cleavages were allowed.Carbamidomethylation1Vwas set as fixeddmodification.cacetylation atthe protein N-terminus, deamination(NQ) and oxidation (M) were allowedas variable modifications. For biolo-gical process characterization of thedifferent tumor subpopulations, thegene ontology tool PANTHER V.13.1was used. MALDI Imaging defines tumorsubpopulation ROls Lipid imaging on the timsTOF fleXfrom tumor sections was used todefine ROls by segmenting intratumorheterogeneity for laser microdissection(LMD))) based microproteomics.The workflow is supported by thecompatibility of PEN (polyethylenenaphthalate) membrane slides withMALDI Imaging on the timsTOF fleX.These slides also support histologi-cal staining and are compatible withLMD. Lipid MALDI Imaging has theadvantageethatthe same tissuesection can be used for imaging,staining and LMD based micropro-teomics. Moreover, discernible lipid profiles are the basis for segmentingintratumor heterogeneity. The breast tumor section was stainedwith hematoxylin and eosin (H&E)after MALDI Imaging data acquisitionand tumor areas were annotated bya pathologist. MALDI Imaging datawith 50 pm spatial resolution wereimported into SCiLS Lab 2019c andthe annotated tumor areas analysedby unsupervised clustering using theSCiLS Lab segmentation algorithm.K-means segmentation highlightedthree subpopulations in the annotatedtumor region (Figure 1). ROI boundary coordinates are thebasis for precise LMD Fine structure segmentation ROlsrequire image processing to allowviability of LMD. Currently, the seg-mentation image raw data containssmall objects or edged segmentboundaries that prevent direct usageof the coordinates for LMD. Afterimageepprocessing, bboundaries ofthe tumor subpopulation areas weretransferred to a coregistered opticalimage of a consecutive section andreferenced to teach marks that werescanned together with the section(Figure 2). This allows co-registration oftheeMALDI Imaging segmentboundaries to the LMD for preciseexcision of the defined areas. Proteomics of microextractedMALDI Imaging segments byPASEF technology implemented intimsTOF fleX The timsTOF fleX system supportsPASEF (Parallel Accumulation SerialFragmentation) technology for timeefficient and sensitiveeX-omicsanalysis. PASEFiFttakes advantageofthe dualTIMS device whichseparatessincoming ion packagesfrom one scan according to their ionmobility and elutes these ions in atime focused manner. While ionsfrom the continuous ESl process areseparated and eluted in the secondTIMS device, ions are accumulatedin parallel in the first part of the dualTIMS cartridge allowing for a 100%duty cycle. Alternatingprecursorand fragment ion scans completeassignment of fragment ion spectrato their respective precursor spectra.PASEF allows for scan rates of morethan 100 Hz without losing sensitivityor resolution andisthe optimalsystem for small sample amountsand therefore for SpatialOMx. Irypti;c digests ot theeextractedproteins from the excised MALDIImaging tumor subpopulation areaswere run on the timsTOF fleX using100)Dmingradientsona BrukernanoEluteLC.TheexciseddFROIsconsistedof approximately2000cells per sample. On average, about3500protein11IDswereobtainedfrom the three microextractions toprovide a deep insight into the pro-teome from just 160 ng (estimated)of sample. The molecular propertiesof the different tumor subpopulationswere characterized and representedas Venn diagrams (Figure 3). Interestingly, the proteomicpro-files of the tumor subpopulationdiffered largely. The gene ontologytermss "Biological regulation” and“Developmentalprocesses" wereunderrepresented in subpopulations1 and 2, respectively, while"cellularcomponent organization" was over-represented in tumor subpopulation 3. linn summary, SpatialOMx providesguidance to specific regions of interesttor microextraction andin-depthproteomics analysis to characterizeregiospecific molecular changes indetail. Figure 3: Proteomics of tumor subpopulations and biological process characterization. Proteins from microdissected tissue (approx. 160 ng) were extracted,digested with trypsin and peptide extracts were run on the timsTOF fleX using PASEF. Number of protein IDs per tumor subpopulation segment A andbiological process characterization per segment as revealed by PANTHER B. Conclusion SpatialOMx is a new workflow for in-situ characterization of tissuesubtypes. ●MALDI Imaging provides guidance for laser-capture microdissection. eSpatialOMX, combining MALDI Imaging and LC-MS/MS, can beperformed in just one instrument: timsTOF fleX. timsTOF fleX allows for in-depth proteomic analysis of smallmicrodissected tissue pieces using PASEF technology. Learn More You are looking for further Information?Check out the link or scan the QR code for more details. www.bruker.com/timstofflex References [1] Meier F et al., (2015), J. Proteome Res., 14, 5378-5387 [2] Longuespee R et al., (2016), Methods, 104, 154-162 [3] Dewez F et al., (2019), Anal. Bioanal. Chem, 411, 5647-5633 For Research Use Only. Not for Use in Clinical Diagnostic Procedures. Bruker Daltonik GmbHBru ker Sc ien tif ic LLC Bremen· GB il l er ic a, MA · USA erma ny Phone +49(0)421-2205-0 Phone +1 (978) 663-3660 ms.sales.bdal@bruker.com-www.bruker.com 荷兰马斯特里赫特大学的Ron M.A. Heeren教授实验室利用空间定位组学工作流程,对来自于乳腺癌患者的肿瘤组织,进行了蛋白质分子特征的深度研究。在对组织切片进行化学基质喷涂之后,利用布鲁克timsTOF fleX质谱系统,针对脂质成分进行成像数据采集。在洗去基质之后,对该组织切片实施H&E染色得到如图1所示的染色结果,用于后续的病理学评估和目标微区ROI的锁定。MALDI成像数据经过布鲁克成像软件SCiLS Lab 2019c的聚类分析,结合对肿瘤区域的病理学标注,确定了三个肿瘤亚细胞群的目标微区ROI,即图1中的Segment 1-3。先由MatLab R2018a软件对上述的微区数据进行初步的处理和优化,然后导入Leica LMD7000中,分别对三个目标微区ROI实施了激光微切割。将所获得的细胞簇(约2000个细胞)分别进行还原、烷基化、酶切,再经过布鲁克nanoElute液相系统分离,最后进入布鲁克timsTOF fleX质谱仪,在PASEF模式下进行了一级质谱和二级质谱的数据采集。所获得的数据被导入到PEAKS X中进行数据库检索,最后将检索结果用基因肿瘤学软件PANTHER V.13.1进行分析。实验结果表明,三个肿瘤亚细胞群表现出不同的蛋白组学特征:肿瘤亚细胞群1和2的“生物调控”和“发展进程”呈现为明显的低表达,而肿瘤亚细胞群3的“细胞组织”呈现了明显的高表达。布鲁克timsTOF fleX质谱仪同时具备MALDI成像功能和LC-MS/MS组学分析功能,成功地实现了空间定位组学工作流程中的关键步骤。与传统组学的“整体匀浆方法”相比,空间定位组学充分地考虑到乳腺癌组织中不同的肿瘤亚细胞群之间的差异性,并分别对各个肿瘤亚细胞群体进行了有针对性的、深度的蛋白组分析。以上的众多优点使得空间定位组学为精准地揭示乳腺癌的致病机理奠定了坚实的基础。
关闭-
1/6
-
2/6
还剩4页未读,是否继续阅读?
继续免费阅读全文产品配置单
布鲁克·道尔顿(Bruker Daltonics)为您提供《乳腺癌患者的肿瘤组织中深度蛋白组分析检测方案(液质联用仪)》,该方案主要用于其他中生化检验检测,参考标准《暂无》,《乳腺癌患者的肿瘤组织中深度蛋白组分析检测方案(液质联用仪)》用到的仪器有布鲁克 timsTOF fleX 组学和成像质谱系统。
我要纠错
推荐专场
相关方案
 咨询
咨询