

方案详情文
智能文字提取功能测试中
OPENNPG Asia Materials (2016) 8, e296; doi:10.1038/am.2016.110www.nature.com/amORIGINAL ARTICLE Approaches to manipulate GO photonic crystalsT-Z Shen et al2 Bottom-up and top-down manipulations for multi-orderphotonic crystallinity in a graphene-oxide colloid Tian-Zi Shen, Seung-Ho Hong, Bomi Lee and Jang-Kun Song The recent discovery of structural coloration in aqueous graphene-oxide (GO) dispersions has increased the applicability ofcarbon-based two-dimensional materials. However, the origin of the photonic band-gap is still poorly understood, and itspractical manipulation is still in an early developmental stage. Here, we demonstrate full-color reflection with first- and second-order Bragg reflections in a GO dispersion, and we use two fundamental approaches to manipulate GO photonic crystals, namely,bottom-up and top-down manipulation by controlling the Debye length and using shear or surface fields, respectively.Nanoscopic tailoring of the electrostatic effective thickness and macroscopic smoothing of the curvature of the GO sheet resultin similar modifications of the quality and pitch of the photonic crystallinity. Direct observation of the GO particle alignmentsreveals excellent electrostatic layer-to-layer packing assembly and rather poor in-layer assembly. These results elucidate themechanism that governs the nematic nature of GO (rather than its lamellar mesophase) and the origin of its photonic crystallineperiodicity and provide new methodologies for exploiting these attractive features in actual applications. NPG Asia Materials (2016) 8,e296; doi:10.1038/am.2016.110; published online 12 August 2016 INTRODUCTION Graphene oxide (GO)))fflakes,s,tthat is, 1-nm-thickdisk-likeparticles, can be well-dispersed in water to form a stable colloid withspontaneous nematic assembly and non-linear anisotropic rheology.-3Nematic GO dispersions subjected to illumination typically exhibit acollective reflection of a brownish color from many GO particles,owing to the intrinsic absorption band of GO.4 However, colorreflection throughout the entire visible spectrum was recently obtainedfrom photonic crystals in a well-prepared nematic GO dispersion.Structural coloration has also been demonstrated in other colloidalsystems such as in the swollen lamellar mesophase of plate-likeparticleswith or withoutaasupporting polymer networkorsurfactants,6-8 the columnar phase of regularly sized plate-likeparticles8-10 and the steric packing assembly of silica or polymerspheres or cubes.11-13 Nonetheless, color reflection in the GOdispersion is quite unexpected, considering that GO particles arehighly polydisperse, irregularly shaped, curved in solution,14,15 andtwo orders of magnitude thinner than the photonic band-gap. From apractical point of view, photonic crystals potentially allow the use ofGO in various optical applications, as long as an easy method isprovided for manipulation.16?FFinding ways to manipulate thereflection color and to achieve large-scale uniformity are, therefore,highly desirable for practical advances. MATERIALS AND METHODS GO dispersions We prepared high-quality GO dispersions that exhibited structural colorationwith a high oxidation rate using the Hummers’ method (see Supplementary Figure S1 for details of the GO samples).1 During the sample preparation,cleaning processes were repeatedly performed (that is, a total of 15 times) toremove residual salts; this removal was achieved by centrifuging the GO sampleand replacing the supernatant liquid with pure deionized distilled water.18,19Atomic force microscopy revealed that most of the flakes became single-layeredafter the cleaning process. The degree of oxidation in the GO sample wasdetermined via X-ray photoelectron spectroscopy, as shown in SupplementaryFigure S1. Scanning electron microscopy (SEM) revealed that the GO had amean size of ~6.5 um. As reported by He et al., typical GO dispersions exhibita brownish collective reflection from the many GO particles; however,well-prepared GO dispersions exhibit structural color reflection. Thisdifference was clearly observable, as shown in Supplementary Figure S2. Cells with undulated morphology Most of the GO cells were fabricated using flat glass substrates. GO particles tendto align parallel to the surface due to surface effects. For comparison, we preparedan uneven cell, which was fabricated by using a substrate with undulatingmorphology. This uneven substrate was prepared by imprinting a fine sandpaper(800 Grit/25 Mesh) using polydimethylsiloxane and was subsequently used tofabricate a l-mm-thick GO cell (see Supplementary Figure S3). The spectral reflectance of the cells was measured using an integratingsphere-type reflective spectrometer (CM-2500d, Konica Minolta Co., Tokyo,Japan), and the spectral component excluded'(SCE) mode was selected toeliminate reflections from glass surface. Freeze-drying field emission SEM analysis A vial with a large neck containing a 0.4 wt% GO dispersion was gently shakento induce a circulating flow inside the vial to induce the uniformshear-alignment of the GO, parallel to the vial surface. The lid was removed,and the vial was partially submerged into liquid nitrogen, quickly freezing the ( School of E lectronics and E lectrical Engine e ring, Sungkyunkwan Un i versity, G y eonggi-do, Ko r ea ) ( IThese authors contributed e q ually to this work. ) Correspondence:Professor J-K(sSong,Schoololof Electronics and ElectricalEngineering,sSungkyunkwan University,2066Seoburo, Jangan-gu,u,Suwon,Gyeonggi-do 440-746, Korea. aqueous GO dispersion. Then, the vial was kept in a freeze-drying vacuumchamber (UT-1000, EYELA Co., Tokyo, Japan) for >12 h until the ice wasperfectly sublimated. During the sublimation, several cracks appeared in thedried GO monolith, and the fractured GO monoliths were carefully removedfrom the vial using tweezers to prevent any compressional force on the samples. The fractured monoliths were loaded on a metal mount with carbon tapeand were coated with Pd by sputtering. Then, the samples were analyzed usinga field emission SEM (JSM 7000F, JEOL Ltd., Tokyo, Japan). Confocal laser scanning microscopy Individual GO particles with a mean size of 6.5 um were poorly resolved whenanalyzed using confocal laser scanning microscopy (CLSM). Therefore, weprepared another aqueous GO dispersion using large-sized graphite powder.The large GO particles were discernible depending on the concentration of GO.The mean diameter was ~27 um; however, the sample was highly polydisperse,and many particles were larger than 100 um. An erected-type CLSM (405-nm laser; K1-Fluo, Nanoscope SystemsCompany, Daejeon, Korea) was used, and the pin-hole was set to 0.5 a.u.The objective had a magnification of×40 and a numerical aperture of 1.2. RESULTS First- and second-order Bragg reflections A weak deep-blue-colored reflection appeared at a concentration of1.3 wt% when water was slowly added into a 4-wt% dark GOdispersion and was mixed evenly with a stirrer bar. Moreover, a seriesof iridescent colored reflections was obtained in the GO samples(as shown in Figure la) with the further addition of water. A differentset of iridescent colored reflections, corresponding to the second-orderBragg reflection band, occurred in the low-concentration range,that is, ca. 0.4-0.11 wt%. These reflections were indicative of thehigh-quality periodicity associated with the GO dispersions, even atlow concentrations. The pitches of the GO photonic crystals that yielded first- and second-order Bragg reflections were in the rangesof 150-260 nm and 300-520 nm, respectively, at optical wavelengthsof 400-700 nm. After 44days of storageeatatroom temperature, the colorcorresponding to the first-order reflection persisted, albeit with aslight fading of the color purity, whereas the second-order reflectionwas no longer observed (Figure 1b). The C-C bond in the GO particlesis spontaneously cleaved in aqueous solutions and releases H+ionsthat enhance the electrostatic screening effect and lead to reductions inthe Debye length.1,19 Therefore, with increasing ion concentration, thesecond-order Bragg reflection (which has a longer periodicity)deterioratedbeforeeitsfirst-order counterpart. Assuch,thesecond-order color reflection was recovered, and the color purity ofthe first-order samples improved (Figure 1c) when the ions wereremoved; this removal was achieved by centrifuging the degradedsamples and replacing the supernatant water with pure distilledwater.19,20 This indicates that the electrostatic repulsion between GOparticles, owing to their electric double layer (EDL), extends >0.5 umin the natural sample, which is free of polymer additives and consistsof unmodified functional groups. The corresponding reflection spectra are shown in Figure ld and e;the reflection peak blue-shifted withhincreasing concentration.Figure lf shows the peak wavelength (ap) as a function of thereciprocal volume fraction (1/D); it shows a linear correlation betweenAp and 1/ in each section of the first- and second-order Braggreflection regions. The interlayer spacing (d) can be calculated by(m×Ap/n), where m is the order of the Bragg reflection and n is therefractive index of water. The interlayer spacing, d, is linearlyproportional to 1/, as shown in Figure lg. The slope was ~0.8,which roughly corresponds to the thickness of the GO particles. Figure 1 First- and second-order Bragg reflections in GO dispersions. (a) Well-prepared GO dispersions exhibited first- and second-order structural colorations.(b,c) The colors were partially faded after 4 days of storage (b) but were recovered after cleaning (c). (d, e) Normalized reflection spectra for thefirst- (d) and the second-(e) order Bragg reflections. (f) Peak wavelengths of reflections as a function of the reciprocal volume fraction. (g) Interlayer spacingestimated from the spectra as a function of the reciprocal volume fraction. Bottom-up control of the Debye length using ion addition andreduction We performed several experiments to clarify the EDL effect on thephotonic crystal structure. First, we added a small amount of NaCl tothe GO dispersion. The reflection spectrum broadened, and thespectralpeak e-shifted (Figure 22a) with increasing ionicconcentration; however, the structural color was destroyed withfurther additions. The increase in the ionic density enhances theelectric screening effect in the colloid, thereby resulting in a decreasein the Debye length. This was verified by zeta potential analysis, theabsolute value of which decreased with increasing ionic density(Supplementary Figure S4). The addition of NaOH resulted inrelatively weak changes;H+ions were neutralized by OH with smalladditions of NaOH. Spectral broadening and blue-shifting also occurred when the GOcells were exposed to ultraviolet (UV) irradiation (Figure 2b). It isknown that UV radiation reduces GO, and the reduced GO iselectrically conductive.21,22 Reduction indicates a decrease in thefunctional group density on the GO surface, which was confirmedby X-ray photoelectron spectroscopy analysis (see SupplementaryFigure S5). The decrease in the functional group density wasaccompanied by a decrease in the surface charge density, which wasalso confirmed by the decreasing absolute value of the zeta potentialwith an increasing duration of UV irradiation (SupplementaryFigure S4). The decrease in the surface charge density weakens theelectrostatic repulsion and leads to a decrease in the Debye length.Therefore, a reduction in the periodicity of the lamellar structure isinduced by either reducing the surface charge density or increasingthe ionic concentration. The reduction of the Debye length expelswater from the interparticle space, and the expelled water then formsvoids filled with water, as shown in Figure 2c. The size of the voidsdepends on the initial GO concentration; the CLSM image and theinset image in Figure 2c were acquired from 0.2 and 0.02 wt% GOdispersions after 5 days’ storage. Shear field induced uniform color reflection The structural colors in the vials were non-uniform and exhibitedirregularly undulating swirling patterns that corresponded to theshear-induced flow-mark.23 When the GO dispersion was intentionally stirred with a glass rod, the flow trajectory remainedon the surface (Figure 3a). The purity of the structural color adjacentto the flow-mark was higher than that of other regions in the vial,indicating that the shear-induced GO alignment improved the qualityof the structural periodicity. The generation of flow-marks during thepreparation of a fluidic colloid is unavoidable. Top-down manipulations of GO photonic crystals can be achievedvia a shear field. The vials containing GO dispersions were slowlyrolled as a simple means of determining the effect of the shear field onthe alignment of GO. This slow and gentle rolling induces a shear fieldnear the surface of the vial, thereby resulting in a uniform structuralcolor reflection of considerable color purity (Figure 3b). The figureshows that both the macroscopic flow-mark pattern and the quality ofthe nanoscale periodicity were influenced by the shear fields. We performed a systematic investigation of the shear effect usingsimple GO dispersion cells that were fabricated in-house. During thefabrication, a GO dispersion droplet was dropped on a bare glasssubstrate with a 1-mm-thick rectangular polydimethylsiloxane wall,and this substrate was then covered with another glass substrate. Thecells exhibited structural colors but had, as expected, an irregular flow-mark (top row of the images in Figure 3c). A shear force was thenimposed by sliding the upper glass substrate from one edge to theother, as illustrated in Figure 3d. This resulted in the improveduniformity of the reflected color in the entire area (bottom row of theimages in Figure 3c). The spectral reflectance underwent two modifications owing to theaction of the shear force (Figure 3d). First, the full width at halfmaximum was reduced by 27% in the red region (140-102 nm), by11% in the green region (149-133 nm) and by 0% in the blue region(90 nm). This reduction was expected because the shear stress maysmooth out the wrinkles in the macroscopic GO alignment. Comparedwith the structural reflection from a smooth alignment, the reflectionfrom an undulated alignment is expected to consist of light from awider range of wavelengths. Therefore, the ironing of wrinkles willlead to a reduction in the full width at half maximum. This reductionwas more apparent in longer pitch structures than in shorter ones,indicating that the periodic lamellar structure was softened with adecreasing GO concentration. Second, the blue shift in the spectralpeak constitutes a contrasting effect to that of the flattened GO pure GO 3.5 pureGO 50 pm 3 2.5 2 1.5 1 0.5· 0· 400 Figure 2 Bottom-up manipulation of structural color by ionic addition and UV exposure. (a) The peak in the reflection underwent a blue-shift, and itsintensity decreased with increasing ionic concentration. (b) A similar color shift and degradation were observed when the sample was exposed to UV light.Each of the samples shown in the photos has an area of 2.0×2.0 cm2. (c) After 5 days’ storage of the 0.2 wt% GO dispersion, voids appeared with thedisappearance of structural color reflection. The voids were composed of the water expelled from the interparticle space. The sizes of the voids were larger inlow-concentration (0.02 wt%) GO dispersions (inset). Figure 3 Top-down manipulation of structural color using shear and surface fields. (a) The structural color was influenced by the flow effect. The flow-markwas created using a stick. (b) Uniform and pure color reflections were obtained by rolling the vials. (c, d) The uniformity and color-purity of the structuralcolor reflection were improved by gentle sliding of the cover glass (cell size: 2×2 cm2). (e) The spectrum changed before and after application of the shearfield. The structural color from the GO dispersion became reddish after coming into contact with the uneven surface. (f) The color from the cholesteric liquidcrystal (CLC) cell became bluish with the same surface treatment. The contrast reveals surface-induced smoothing of GO particles and the decrease in theperiodicity. alignment. Theoretically, the flattened photonic crystal structure isexpected to result in a red shift, rather than in a blue shift (see ‘Surfacefield effect'in the next section). We thus conclude that the blue shiftarises from a reduction in the structural periodicity of the GOalignment rather than from the flattening of the long-range alignmentmodulation. Spectral shifts of 29, 12 and 9 nm for the red, green andblue regions correspond to reductions of 11,4.6 and 3.4 nm,respectively, in the periodicity. This verifies the softening of GOpacking at low concentrations. Surface field effect The surface fieldprovidess another:r method forttop-downmanipulation. CLSM revealed that the GO particles near the surfacewere aligned approximately parallel to the surface (not shown here).However, those in the middle of the cell were aligned in an undulatingmanner, and some were even vertical with respect to the surface. Toclarify the surface effect, we prepared a highly uneven undulatedsubstrate and fabricated a cell using this substrate (see SupplementaryFigure S3). The uneven GO cell exhibited greater reflection overlonger wavelengths, compared with its counterpart that had flatsurfaces. Consequently, the bluish color in the flat cell becamegreenish in the undulated cell (Figure 3e). When the same unevencell was filled with cholesteric liquid crystals (CLCs), however, theopposite color shift occurred (Figure 3f); the green color in the flatCLC cell became bluish in the uneven CLC cell. The photonic bandgap in CLC arises from the molecular chiral helix, whose periodicity isnot influenced by the surface morphology. The undulation-inducedtilting of the helical axes, however, leads to the blue shift.24 In contrast, the periodicity of the lamellar alignment of the large GO sheetsincreased, owing to the effect of the undulating surface morphology. Effective GO thickness including the Debye length Excluded-volume theories based on steric interactions successfullyelucidate the formation of the lyotropic mesophase and proposethat the critical volume fraction for the phase transition (Dr) isproportional to T/D,25,26 where T and D are the mean thickness anddiameter, respectively, of the particles.3,26,27 In a colloid, the EDL actsas a large shell surrounding the bare particle, thereby resulting in asignificant (that is,>50-fold) increase in the effective thickness of theparticles.28 However, most studies have overlooked the EDL inOnsager-type calculations for GO liquid crystals,29-32 and r wassimply estimated by determining the aspect ratio of the dried GOsheet. By assuming that the effective thickness (Tef) is m times that ofthe dried GO (Tco) and using the approximation Dr~4.5 T/D, theactual phase-transition concentration to the nematic phase includingEDL (PEDL) is given as: Therefore, PEDL is m times larger than DT, which is calculatedwithout taking the EDL into consideration. The corresponding GOconcentration (Go), excluding EDL, is PEDL/m, which is the same asDT, according to equation (1). In other words, Dr is not influenced bythe inclusion of EDL in spite of the significant increase in theeffective thickness. A more accurate calculation, which considers thepolydispersity of GO,2 yields only a slight increase in Dr by including the EDL. This inclusion leads to a decrease in the aspect ratio (D/Teff)but to an increase in the effective volume fraction. These two factorshave contrasting impacts on the Dr, thereby resulting in only slightchanges in DT. High effective packing ratio and excellent layer-to-layer stackingassembly On the other hand, the increased volume packing ratio, owing to theinclusion of EDL, has a significant effect on the photonic crystallinity.Positional ordering in hard-particle colloids is typically attributed tothe packing effect. 12,33,34 After the prolonged centrifugation of the GOdispersion at 2 200 r.p.m. to eliminate water, a 2-vol% GO gel wasobtained. In other words, centrifugation was ineffective in expelling the98-vol% of water from the dispersion. By assuming that the remaining98-vol% water belongs to the rather hard core shell within the slipperyboundary, it is estimated to be ~ 25 nm from the GO surface. A similarvalue can be found by directly calculating the Debye thickness usingthe ionic concentration. The slippery boundary may be consideredfrom the viewpoint of the packing ratio. For example, an effectivepacking ratio of 30 vol% is assumed for a 1.2-wt% (~0.6 vol%) GOdispersion that exhibits a pure blue reflection. This value is similar tothe packing ratio at which periodic crystallinity can be induced.12,33,34In the case of an excellent GO sample, the interparticle osmoticrepulsion extends by up to 500 nm beyond the boundary, as confirmedin Figure 1a. If the Debye length beyond the slippery boundary is takeninto consideration, then the ensuing increase in the ratio gives rise toexcellent layer-to-layer periodicity. Unlike the pure steric interactionwith on/off-type repulsion, the EDL-induced electrostatic repulsion iselastic, thereby allowing the continuously adjustable reflection colorthat varies with the GO concentration. We prepared a 200-um-thick GO cell with highly uniform GOalignment, which was achieved by combining the surface and shearfields. The color reflected by the cell shifted to blue with an increasingviewing angle (Figure 4) when a fixed white illumination is appliedobliquely at -30°with respect to the sample normal. This resultconcurs (to some extent) with the result obtained from the simulationwhen a perfect one-dimensional photonic crystal, whose axis is normalto the surface, is assumed. Amorphous photonic crystals exhibit arather weak dependency on the viewing angle.33 Hence, Figure 4indicates that the layer-to-layer periodicity is surprisingly good. Freeze-drying field emission scanning electron microscopic analysisfor GO alignment Drying the GO dispersion at room temperature caused a dramaticchange in its structure; the volume shrank, with a loss of structural Figure 4 Dependence of structural color on the viewing angle. The structuralcolor shifted to blue with an increasing viewing angle (cell size: 2×2 cm2). color, and the GO particles adhered to each other to form packedwrinkly films.2,35 Figure 5a shows the cross-sectional SEM image of adried GO film with a wrinkle, which was made by drying a 1 wt% GOdroplet. The inset image shows closely packed GO sheets. Thechange is naturally expected because the electro-static repulsionbetween particles is expected to disappear with the recession andevaporation of water. Quick freezing also could not prevent the alteration of the GOalignment. The 0.6 wt% GO dispersion was analyzed using thefreeze-drying fracture field emission scanning electron microscopicmethod. The GO dispersion with uniform shear-induced GO align-ment displayed a clear green-colored reflection before freezing(Figure 5b). After the freeze-drying process, the dried GO monolithcompletely lost the initial structural color reflection and turned to abrown color (Figure 5c). SEM images of the sample surface in contactwith the vial surface show structures different from those of the cross-sectional view on the fractured surface, as shown in Figure 5d. Onlythe GO particles in contact with the vial surface were aligned parallelto the surface, as clearly indicated in Figure 5e. However, the SEMimages of the side view, which were taken from the vertically crackedsurface, exhibited very porous structures (Figure 5f-h). The porousstructures were almost perfectly random in some areas (Figure 5f), andthey exhibited elongation with periodic lines in other areas (Figure 5gand h). The directions of elongation were not parallel to the vialsurface, but were vertical, with tilting and bending (see the whitedashed lines in Figure 5g and h). The porous cork-like structure was distinct from the lamellarstructure with excellent periodicity. Even the elongated structure wasnot parallel to the vial surface, and the pitch was ~ 10 um, which wasin complete contrast with the periodic structures for the photoniccrystals with structural color reflection. It has been reported that thefreezing of water changes the morphological properties of a GOassembly and that the growth of ice is responsible for the elongatednetwork structures.36,37 Hence, the freeze-dried GO film does notretain the initial GO alignment within the aqueous dispersion beforedrying.5,38,39 Removal of the water between the GO particles, via eitherevaporation or sublimation, significantly modifies the interparticleinteractions and the GO alignment structure. CLSM analysis for the curvature of individual GO particles CLSM analysis can overcome the aforementioned issue and enable thedirect observation of the GO alignment within the wet dispersion(Figure 6).TThe cell containing the 0.25 wt% GO dispersion(Figure 6a) showed a largely undulating GO alignment, and inparticular, the side view of the vertically aligned GO particles explicitlyrevealed the particle curvatures in the GO liquid crystal. Some of theparticles were almost flat (expanded inset (i)), whereas others weresignificantly curved (expanded inset (ii)).14 It is apparent that thespace between the flat particles is narrower and more uniform thanthat between the curved particles. The inset image (iii) shows thenematic alignment of irregular GO particles; in which, the edge linesof neighboring GO particles do not match, and the GO particles arestacked randomly. Shear treatment caused the particles to align parallelto the substrate, as indicated in Figure 6b. Closely packed GO sheetsappear brighter than the sparsely packed sheets or the sheets withmissing layers because of the characteristics of the CLSM method.In the 0.45 wt% GO dispersion, individual particles were faintlydiscernible (Figure 6c and d). The untreated cell had an undulatingGO alignment (Figure 6c), and the shear-treated cell had an improvedGO alignment parallel to the substrates, which can be inferredfrom the uniform brightness profile (Figure 6d). For the higher- Figure 5 Field emission scanning electron microscopic analyses of ambient dried and freeze-dried GO samples. (a) A 1 wt% GO droplet was dried at ambientconditions, and the fractured, dried film was analyzed. The cross-sectional diagram exhibits densely packed GO sheets. (b,c) 0.4 wt% GO dispersions beforeand after freeze-drying, respectively. (d-h) Fractured, freeze-dried GO monoliths were analyzed. The top surface, which was in contact with the vial surface,shows GO assembly parallel to the surface (e) but the fractured cross-sections have porous cork-like structures: random porous (f), obliquely elongated (g) orbent elongated structures (h). None of these exhibited periodic photonic crystal structures. Figure 6 Confocal laser scanning microscopic (CLSM) analyses of GO alignment and curvatures. Large-sized GO dispersions were used, and the non-treatedand shear-treated cells shown in Figure 3b were used for the top and bottom row images, respectively. Images were obtained at a depth of ~50 pm. (a) At0.25 wt%, the GO particles were clearly discernible. The magnified inset images (i-iii) on the right side show the sectional cuts of vertically aligned flat GOsand curved GOs and the horizontally aligned GOs, respectively. (b) Shear treatment induced significant horizontal alignment of the GO particles. Closelypacked particles appear brighter than sparsely packed particles. (c, d) At 0.45 wt%, individual particles were dimly discernible. The non-treated cellexhibited a vertically packed GO alignment, whereas shear treatment enhanced the horizontal alignment. (e, f) At 1.2 wt%, individual particles were notdiscernible, but the brightness and uniformity provided information regarding the GO particle alignment and packing assembly. concentration dispersions (Figure 6e and f), cloud-like agglomeratedparticles, rather than individual particles, were observed. With sheartreatment, the CLSM image became uniform and brighter, indicating auniform and close interlayer stacking assembly. The top-down shearforce may have flattened not only the undulated GO alignment but also the curvature of the GO particles and thus improved the quality ofthe interlayer stackingassembly,which correlates with theshear-induced improvement in the spectral reflectance (Figure 3d). Concentration-driven coloration is indicative of a swollen lamellarstructure, which could extend either locally or over a long-range. The Figure 7 Various colored drawings using multiple GO dispersions. (a) GO droplets reflecting red, green and blue colors were dropped onto a hydrophobicsubstrate (a-i) and merged into one drop with clear border lines (a-ii). The colors were mixed when the substrate was shaken (a-iii). (b) Upon adding waterinto a stirred GO dispersion, the color changed continuously. (c) A GO dispersion with spatially varying GO concentration exhibited full color reflection, andthe colorful drawing was sustained for 1 day. (d) Shallow GO dispersions,~1 mm thick, in a petri dish exhibited fairly uniform color in the top view (d-i) andthe bottom view (d-ii). (e) By dropping another GO dispersion on top of the base dispersion, the colored character ‘S’ was obtained. The topping color caneither replace or mix with the base color. CLSM image in Figure 6f shows mottled, bright grains within a darkbackground. The bright grains correspond to dense layer-to-layerstacking, whereas the dark region indicates the missing-layer GOassembly. As indicated in the inset image (iii) in Figure 6a, theirregularly shaped GO particles do not fit with each other (unlike ajigsaw), and as a result, a layered structure with partially missing layersis unavoidable in vertical stacking. Therefore, it is difficult to observe awide-range single layer in GO alignment, although local layer-to-layerstacking is excellent. A weak diffuse spot was reported in GOdispersions using a small angle X-ray scattering analysis.30,40 Thisbroad, diffuse peak indicates that the GO liquid crystal has liquid-likepositional local order in a globally nematic phase, which is notconsidered a lamellar mesophase with a long-range positionalorder.41,42 Hence, it is reasonable to consider the GO photonic crystalas a nematic phase rather than a lamellar mesophase. Figure 2 showsthat the reflectance of the GO photonic crystal was ~3%, which ismuch lower than the usual photonic crystal structure (~31% for theCLC cell in Figure 3f). In fact, the low reflectivity in the GO photoniccrystals implies defective local lamellar ordering instead of thelong-range lamellar mesophase. Thus, unlike the excellent locallayer-to-layer periodicity due to EDL packing assembly, in-layerassembly is rather poor and defective. Colorful painting based on the local modulations of GOconcentration and alignment The mixing of GO dispersions with different GO concentrationsdisplayed fascinating structural color properties. Three small GOdroplets having different structural colors were dropped onto ahydrophobic substrate (Figure 7a-i) and were merged into one droplet by gently tilting the substrate (Figure 7a-ii). The merged droplet hadthree regions of different colorsrswithclearrboundary lines.Interestingly, the colors were not spontaneously mixed until thesubstrate was shaken to force the mixing (Figure 7a-iii). Upon addingwater into a beaker containing a stirred high-concentration GOdispersion, the reflection color changed continuously and variedspatially, generating colorful reflections (Figure 7b). Moreover, wecould draw a colorful painting by dropping varying amounts of waterinto the GO dispersion after stopping the magnetic stirring, as shownin the Earth-like painting in Figure 7c. The colorful picture wassustained for at least 1 day, indicating that spontaneous diffusion ofGO particles occurs very slowly in water. Dropping water caused acomplicated undulating flow-mark, generating dark and brightreflections. The dark reflection was (due to tlthiee GO alignedperpendicular to the surface. Gentle shaking of a shallow GOdispersion (~1mm depth) with a blue reflection in a petri dishinduced a uniform color reflection (inset image in Figure 7d-i).By adding a red GO dispersion on top of the thin blue GO dispersion,relativity uniform color domains were obtained, owing to thesurface effect of the petri dish (Figure 7d-i). Figure 7d-ii shows thebottom view of the petri dish, which shows almost the same colorpatterns as the top view in Figure 7d-i, albeit with a weaker red colorowing to the presence of the blue GO dispersion layer underneath thered GO dispersion. Dropping a GO dispersion with one color on top of anotherdispersion with a different color enabled us to draw a coloredcharacter (Figure 7e). In the case of a sufficiently thick topping layer,the reflection color was replaced by the topping layer. The color wasmixed with that of the bottom layer, however, in the case of a thin topping layer. Modulations of the local GO density and alignmentenabled us to demonstrate full-range color reflections, includingchromatic and achromatic colors (see Supplementary Figure S6).The modulations of local GO density and alignment were stable andsustained, indicating weak diffusion of GO particles in the GOconcentrations. DISCUSSION The achievement of a high-quality, multi-order, visible-range photonicbandgap in colloids of polydispersed, irregularly shaped and curvedGO flakes is an unexpected result. The photonic bandgap does notarise from a higher-order hierarchical periodic structure but fromperiodic stacking of single-layered GO sheets, which is confirmed bythe ratio of the interlayer spacing and the reciprocal volume fraction.The thickness of GO sheets is only ca. 1 nm, but the uniforminterlayer spacing is up to 500 nm, sustained by electrostatic repulsion.Phase identification is critical in the study of liquid crystals, tounderstand the origin of the self-assembly, hierarchical structures,material properties and even potential applications. However, theunexpected photonic crystallinity complicates the phase identificationof the GO dispersion; 1D photonic crystallinity is usually attributed tolamellar mesophasic ordering.4 Several additional results have beenreported to support the lamellar mesophasic property of the GOdispersion, such as the periodic patterns with pitches of tens ofmicrometers in the freeze-dried sample38,44 and small angle X-rayscattering peaks sharper than those in usual small-molecular nematicphases.30,38,45 However, freeze-dried samples usually lose the originalGO assembly structure in a wet colloid and are restructured duringfreezing,36,37 small angle X-ray scattering peaks in colloidal nematicphases are commonly sharper than those of small-molecular nematicphases owing to weaker thermal fluctuation, and the types of patternsare commonly interpreted as characteristic patterns of the nematicphase rather than the lamellar phase in clay suspensions.41,42,46 Hence,these results do not directly confirm the lamellar mesophase of the GOdispersion. In lamellar phases such as lipid bilayer lamellar phases andthe smectic phases of small molecules, a long-range single layer that iscomposed of many particles should first be defined. Then, the stackingassembly of the layers constitutes the bulk lamellar phase. GOdispersions have excellent layer-to-layer assembly but poor in-layerassembly, which makes it difficult to define each layer. Thus, GOdispersions are identified as belonging to a nematic phase rather thanto a lamellar mesophase, despite their lamellar properties such ashigh-quality local layer-to-layer periodicity. Polydispersity, irregularshape and flexibility may disturb the formation of the lamellarmesophase. The excellent layer-to-layer packing assembly originatesfrom a thick and uniform EDL on the GO surface. Top-down manipulation of GO photonic crystallinity using surfaceand shear fields significantly contributes to the flexibility of 2D GOsheets. These external stimuli improve the GO alignment and smooththe curvature of GO particles, in turn leading to variations in the colorand brightness of the reflected light. It is also interesting that the localvariation of GO density can be sustained for a considerable period oftime, provided that the GO is not stirred or shaken. This implies thatthe local osmotic pressure is weak or self-balancing across a widerange of concentrations. The results in this study may open a newavenue to using GO dispersions in reflective-type optical devices,although further study is required to resolve many issues, such as poorstability and low reflectance. CONFLICT OF INTEREST The authors declare no conflict of interest. ACKNOWLEDGEMENTS This work was supported by the Samsung Research Funding Center ofSamsung Electronics under Project Number SRFC-MA1402-03. Author contributions: J-KS planned and supervised the project. T-ZS andS-HH contributed equally to this work by performing most of the experiments.BL and T-ZS performed the CLSM analysis. All authors analyzed the data andparticipated in the writing of the manuscript. 1Dimiev, A. M., Alemany, L. B. & Tour, J. M. Graphene oxide. Origin of acidity, its:sinstability in water, and a newdynamic structural model. ACS Nano 7,576-588(2013). 2Loh, K. P., Bao, Q., Eda, G. & Chhowalla, M. Graphene oxide as a chemically tunableplatform for optical applications. Nat.Chem. 2, 1015-1024 (2010). 3Shen, T.-Z., Hong, S.-H. & Song, J.-K. Electro-optical switching of graphene oxideliquid crystals with an extremely large Kerr coefficient. Nat. Mater. 13,394-399(2014). 4He, L., Ye, J., Shuai, M., Zhu, Z., Zhou,X., Wang, Y., Li, Y., Su, Z.,Zhang, H., Chen, Y.,Liu, Z., Cheng, Z. & Bao, J. Graphene oxide liquid crystals for reflective displays withoutpolarizing optics. Nanoscale 7, 1616-1622 (2015). 5Li, P., Wong, M., Zhang, X., Yao, H., Ishige, R., Takahara, A., Miyamoto, M., Nishimura,R. & Sue, H.-J. Tunable lyotropic photonic liquid crystal based on graphene oxide. ACSPhotonics 1, 79-86 (2014). 6Gabriel, J.-C. P., Camerel, F., Lemaire, B. J., Desvaux, H., Davidson, P. & Batail, P.. Swollen liquid-crystalline lamellar phase based on extended solid-like sheets. Nature413,504-508(2001). 7Haque, M. A., Kurokawa, T. & Gong, J. P. Anisotropic hydrogel based on bilayers: color,strength, toughness, and fatigue resistance. Soft Matter 8, 8008 (2012). 8Wong, M., Ishige, R., Hoshino, T., Hawkins, S., Li, P., Takahara, A. & Sue, H.-J.Solution processable iridescent self-assembled nanoplatelets with finely tunableinterlayer distances using charge- and sterically stabilizing oligomeric polyoxyalkyle.neamine surfactants. Chem.Mater. 26, 1528-1537 (2014). 9Mourad,M. C., Petukhov, A. V., Vroege, G. J. & Lekkerkerker, H. N. Lyotropic hexagonalcolumnar liquid crystals of Ilargecolloidalgibbsite platelets.Langmuir 26,14182-14187(2010). 10 van der Kooij, F. M., Kassapidou, K. & Lekkerkerker, H. N. W. Liquid crystal phasetransitions in suspensions of polydisperseeplate-like particles.s.Nature 406,868-871(2000). 11 Arsenault, A. C., Puzzo, D. P., Manners, I. & Ozin, G. A. Photonic-crystal full-colourdisplays. Nat. Photonics 1, 468-472(2007). 12 Rossi, L., Sacanna, S., Irvine, W.T. M., Chaikin, P. M., Pine, D. J. & Philipse, A. PCubic crystals from cubic colloids. Soft Matter 7,4139 (2011). 13 Takeoka, Y., Honda, M., Seki, T., Ishii, M. & Nakamura, H. Structural colored liquidmembrane withoutitangle dependence.ACSAppl.Mater.Interfaces982-986(2009). 14 Whitby, R. L. D., Gun'ko, V. M., Korobeinyk, A., Busquets, R., Cundy, A. B., Laszl6, K.,Skubiszewska-Zieba, J., Leboda, R., Tombacz, E., Toth, I. Y., Kovacs, K. &Mikhalovsky, S. V. Driving forces of conformational changes in single-layergraphene oxide. ACS Nano 6, 3967-3973 (2012). 15 Catheline, A., Ortolani, L., Morandi, V., Melle-Franco, M., Drummond,C., Zakri, C. &Penicaud, A. Solutions of fully exfoliated individual graphene flakes in low boiling pointsolvents. Soft Matter 8, 7882(2012). 16 Hong, S. H., Shen, T. Z. & Song, J. K. Manipulation of structural color reflectionin graphene oxiddeispersionsstusing electricfields. Opt.Express23.18969-18974(2015). 17 Hummers, W. S. & Offema, R. E. Preparation of graphite oxide. J. Am. Chem. Soc.80,1339-1339(1958). 18 Shen, T.-Z., Hong, S. H. & Song, J.-K. Effect of centrifugal cleaning on the electro-opticresponse in the preparation of aqueous graphene-oxide dispersions. Carbon 80,560-564(2014). 19 Hong, S.-H., Shen, T.-Z. & Song, J.-K. Electro-optical characteristics of aqueousgraphene oxide dispersion depending on ion concentration. J. Phys. Chem. C 118,26304-26312(2014). 20 Shen, T.-Z., Hong, S.-H. & Song, J.-K. Effect of centrifugal cleaning on the electro-opticresponse in the preparation of aqueous graphene-oxide dispersions. Carbon 80,560-564(2014). 21 Williams, G., Seger, B. & Kamat, P. V. TiO2-Graphene nanocomposites. UV-assistedphotocatalytic reduction of graphene oxide. ACS Nano 2, 1487-1491(2008). 22 Ding, Y. H., Zhang, P., Zhuo, Q., Ren, H. M., Yang, Z. M. & Jiang, Y. A green approachto the synthesis of reduced graphene oxide nanosheets under UV irradiation.Nanotechnology 22, 215601 (2011). 23 Hong, S.-H., Shen, T.-Z. & Song, J.-K. Flow-induced ordering of particles and flowvelocity profile transition in a tube flow of graphene oxide dispersions. Liq. Cryst. 42,261-269(2014). 24 Kim, J.-K., Joo, S.-H. & Song, J.-K. Complementarity between fluorescence andreflection in photoluminescent cholesteric liquid crystal devices. Opt. Express 21,6243-6248(2013). 25 Onsager,L. The effect of shape on the interaction of colloidal particles. Ann. N.Y.Acad.Jnsager,lSci. 51, 627-659(1949). 26 Bates, M. A. & Frenkel, D. Nematic-isotropic transition in polydisperse systems ofinfinitely thin hard platelets. J. Chem. Phys. 110,6553 (1999). 27 van der Kooij, F. M. & Lekkerkerker, H. N. W. Formation of nematic liquidcrystals in suspensions of hard colloidal platelets. J. Phys. Chem. B 102,7829-7832(1998). 28 Rowan, D. G. & Hansen, J.-P. Salt-induced ordering in lamellar colloids. Langmuir 18,2063-2068(2002). ( 29 Kim, J. E ., H a n, T . H., L ee, S . H ., K im, J . Y ., Ahn, C. W., Yun, J. M. & K im, S . 0 . G raphene oxide liquid crystals . Angew. Chem. I nt. Ed. Engl . 50 , 3043-3047 ( 2 011). ) 30 Xu, Z. & Gao, C. Aqueous liquid crystals of graphene oxide. ACS Nano 52908-2915(2011). 31 Dan, B., Behabtu, N., Martinez, A., Evans, J. S., Kosynkin, D. V., Tour, J. M.,Pasquali, M. & Smalyukh, 1. 1. Liquid crystals of aqueous, giant graphene oxide flakes.Soft Matter 7, 11154(2011). 32 Luo, Y., Braggin, G. A., Olson, G. T., Stevenson, A. R., Ruan, W. L. & Zhang, S.Nematic order drives macroscopic patterns of graphene oxide in drying drops. Langmuir30, 14631-14637 (2014). 33 Forster, J. D., Noh, H., Liew, S. F., Saranathan, V., Schreck, C. F., Yang, L., Park, J. G.,Prum, R. O., Mochrie, S. G., O’Hern, C. S., Cao, H. & Dufresne, E. R. Biomimeticisotropic nanostructures for structural coloration. Adv. Mater. 22, 2939-2944(2010). 34 Yethiraj, A. & van Blaaderen, A. A colloidal model system with an interaction tunablefrom hard sphere to soft and dipolar. Nature 421, 513-517(2003). 35 Hong, S.-H., Shen, T.-Z. & Song, J.-K. Water front recession and the formation ofvarious types of wrinkles inndriedgrapheneoxidderoplets.Carbon 105.297-304(2016). 36 Qiu, L., Liu, J. Z., Chang, S. L., Wu, Y. & Li, D. Biomimetic superelastic graphene-based cellular monoliths. Nat. Commun. 3, 1241(2012). 37 Ham, H., Khai, T. V., Park, N. H., So, D. S., Lee, J. W., Na, H. G., Kwon, Y. J.,, Cho, H. Y. & Kim, H. W. Freeze-drying-induced changes in the properties ofgraphene oxides. Nanotechnology 25, 235601 (2014). 38 Xu, Z. & Gao, C. Graphene chiral liquid crystals and macroscopic assembled fibres. Nat.Commun. 2, 571(2011). 39 Tong, L., Qi, W., Wang, M., Huang, R., Su, R. & He, Z. Long-range ordered graphiteoxide liquid crystals. Chem. Commun. (Camb) 50, 7776-7779 (2014). 40 Zakri, C., Blanc, C., Grelet, E., Zamora-Ledezma,C., Puech, N., Anglaret, E.& Poulin, P. Liquid crystals of carbon nanotubes and graphene. Philos. Trans. A Math.Phys. Eng. Sci. 371,20120499 (2013). 41 Paineau, E., Philippe, A. M., Antonova, K., Bihannic, I., Davidson, P., Dozov, 1.,Gabriel, J. C. P., Imperor-Clerc, M., Levitz, P., Meneau, F. & Michot, L. J.Liquid-crystalline properties of aqueous suspensions of natural clay nanosheets.Liq. Cryst. Rev. 1, 110-126(2013). 42 Paineau, E., Michot, L. J., Bihannic, I. & Baravian, C. Aqueous suspensions of naturalswelling clay minerals. 1. Structure and electrostatic interactions. Langmuir 27,5562-5573(2011). 43 Li, Z., Liu, Z., Sun, H. & Gao, C. Superstructured assembly of nanocarbons: fullerenes,nanotubes, and graphene. Chem. Rev. 115, 7046-7117 (2015). 44 Xu,Z. & Gao, C. Graphene in macroscopic order: liquid crystals and wet-spun fibers.Acc. Chem. Res. 47, 1267-1276 (2014). 45 Liu, Z., Xu, Z., Hu, X. & Gao, C. Lyotropic liquid crystal of polyacrylonitrile-graftedgraphene oxide and its assembled continuous strong nacre-mimetic fibers.Macromolecules 46, 6931-6941 (2013). lli 46 Lekkerkerker, H. N. & Vroege, G. J. Liquid crystal phase transitions in suspensions ofmineral colloids: new life from old roots. Philos. Trans. A Math. Phys. Eng. Sci. 371,20120263(2013). This work is licensed under a Creative Commons@Attribution 4.0 International License. The images orother third party material in this article are included in the article’sCreative Commons license, unless indicated otherwise in the creditline; if the material is not included under the Creative Commonslicense, users will need to obtain permission from the license holder toreproduce the material. To view a copy of this license, visit http://creativecommons.org/licenses/by/4.0/ Supplementary Information accompanies the paper on the NPG Asia Materials website (http://www.nature.com/am) E-mail: jk.song@skku.eduReceived February revised June accepted June NPG Asia Materials 石墨烯(Graphene)是一种从石墨材料中剥离出来的,以周期性紧密堆积的碳原子构成的以单层苯环结构(蜂巢结构)为基本结构单元的一层原子厚度的二维晶体。其基本结构单元为苯六元环,它可以看做是构成零维材料富勒烯、一维的碳纳米管及三维的石墨和金刚石的基本结构单元。2004年,英国曼彻斯特大学的Novoselo等成功地从石墨中分离出石墨烯,并证实它可以单独存在。他们因此也获得2010年诺贝尔物理学奖。由于单层石墨烯的厚度仅为0.35nm,是世界上已知最薄的新型二维材料,所以具有独特的物理、化学及生物学特性而备受关注最近发现GO(氧化石墨烯)水性分散液中结构变色的最新发现增加了碳基二维材料的适用性。然而,对光子带隙的起源仍知之甚少,其实际操作仍处于早期发展阶段。在这里,我们演示了GO色散中具有一阶和二阶布拉格反射的全色反射,并且我们使用了两种基本方法来操纵GO光子晶体,即通过控制Debye长度和使用剪切来进行自下而上和自上而下的操纵。或表面场。静电有效厚度的纳米级修整和GO片的曲率的宏观平滑化导致光子结晶度的质量和间距的类似改变。直接观察GO粒子的排列,显示相当好的静电层间填充组装和相当差的层内组装。这些结果阐明了控制GO的向列性质(而不是其层状中间相)及其光子晶体周期性的起源的机制,并提供了在实际应用中利用这些吸引人的特征的新方法。 在研究的过程中我们使用Nanoscope System 的K1-Fluo 激光荧光共聚焦显微镜(405nm激光器,Pinhole 0.5, 40X objective lens, NA 1.2)观察GO(氧化石墨烯)颗粒的荧光图像,由于GO(氧化石墨烯)量子是多分散,不规则,因此在着色的过程中使用具有高氧化率结构着色的的GO分散液进行着色。由于GO颗粒的平均尺寸小于6.5um. 考虑到GO的尺寸过小将会很难观察荧光,因此使用大尺寸石墨粉制备重新制备GO水溶性分散液,但样品同样具有高度分散性,其平均直径为27um, 部分颗粒的直径大于100um. 通过K1-Fluo 可以获得高清晰,高精度的荧光图像。
关闭-
1/9

-
2/9
还剩7页未读,是否继续阅读?
继续免费阅读全文产品配置单
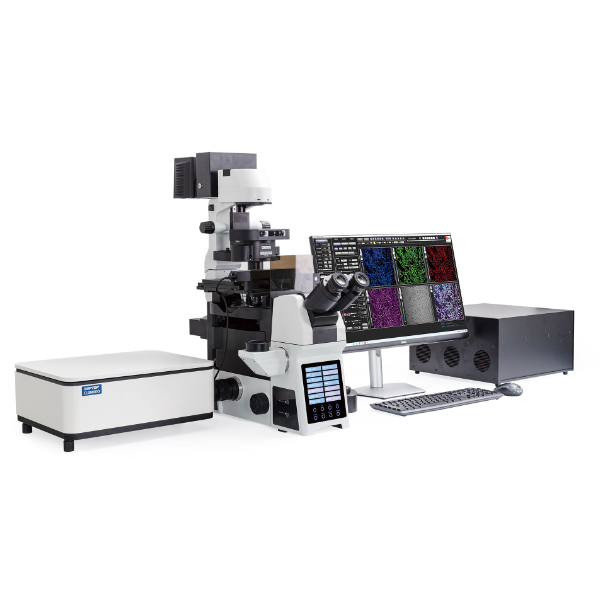
Nanoscope Systems,Inc.为您提供《石墨烯中水溶性分散液检测方案 》,该方案主要用于石墨烯中水溶性分散液检测,参考标准《暂无》,《石墨烯中水溶性分散液检测方案 》用到的仪器有 K1-Fluo ABM 激光荧光共聚焦显微镜。
我要纠错
推荐专场
相关方案
 咨询
咨询