三家废水处理厂27个废水样品化学需氧量(COD)和氮含量的检测
检测样品 废水
检测项目 有机物综合指标
参考标准 HJ 828-2017 水质 化学需氧量的测定 重铬酸盐法


方案详情文
智能文字提取功能测试中
安全可持续水资源再利用的微生物病原体定量评估和废水处理性能指标Quantitative Assessment of Microbial Pathogens and Indicators of Wastewater Treatment Performance for Safe and Sustainable Water Reuse in IndiaRESEARCH ARTICLEMicrobiologySpectrumAMERICANSOCIETY FORMICROBIOLOGY Microbial Indicators, Wastewater Treatment PerformanceMicrobiology Spectrum S 印度安全可持续水资源再利用的微生物病原体定量评估和废水处理性能指标 Quantitative Assessment of Microbial Pathogens and Indicators of Wastewater Treatment Performance for Safe and Sustainable Water Reuse in India Shruti Chowdhari, Shubham Rana, Samridhi Rana, Christina M. Mor r ison,D S Sarah Elizabeth Abney, Rajveer Singh,°Patrick L. Gurian, Amit Kumar, Arun Kumar, Walter Q. Betancourt,D Perumal Vivekanandan K usuma S c h o ol of Bi o log ica l Scienc es, Indian I n s ti t ut e o f Technol og y Delhi , N ew D elhi , Indi a b De p artment of C iv il E ngineeri ng , Mala vi ya Nat i ona l Insti t ute o f Tec h nology , Jaipur,R a jasthan, India D epar t ment of C i vi l Eng ine ering, Indian Instit ut e of T echno l ogy, D elhi ,India d De p artment of Civ i l , Archit ect ur a l a nd E nvironment a l Enginee ri ng, D r exe l U nivers i ty , Philadel p h ia , Pennsy l vania,U SA e Water & Energ y Sustain abl e T e chnology (WE S T ) C e nter, Universi t y o f Ar i zona, Tuc son, Arizona , U SA ABSTRACT Currently, there i s no data on the molecular quant i fication of microbial indica-tors of recycled water quality i n India. In this study, multiple microbial pathogens and indi-cators of water quality were evaluated at three wastewater treatment plants located in two Indian cities (New Delhi and Jaipur) to determine the treatment performance and suitability of recycled water for safe and sustainable reuse applications. Real-time polymerase chain reaction (PCR) was used for the rapid evaluation of six human pathogens and six microbial indicators of fecal contamination. Among the microbial indicators, pepper mild mottle virus (PMMoV), F *RNA-GlI bacteriophage, Bacteroides thetaiotamicron, and four human pathogens (Norovirus genogroups 1 & ll, Giardia, and Campylobacter coli) were detected in all of the influent samples analyzed. This work suggests t hat the raw influents contain lower levels of noroviruses and adenoviruses and higher levels of Giardia compared to those reported from other geographic regions. Overall, the efficacy of the removal of microbial targets was over 93% in the f inal effluent samples, which i s consistent with reports from across the world. PMMoV and Giardia were identified as the best microbial targets, from the mi-crobial indicators spanning across bacteria, bacteriophages, DNA/RNA viruses, and proto-zoan parasites , by which to evaluate treatment performance and recycled water quality i n Indian sett i ngs, as they were consistently present at high concentrations in untreated wastewater both within and across the sites. Also, they showed a strong correlation with other microbial agents in both the raw influent and i n the final effluent. These f indings pro vide valuable insights into the use of culture-independent molecular indicators that can be used to assess the microbial quality of recycled water i n I ndian settings. IMPORTAN C E Wastewater treatment plants (WWTPs) have rapidly increased in India dur i ng the last decade. Nonetheless, there are only a few labs in India that can perform culture-based screening for microbial quality. In the last 2 years of the pandemic, India has witnessed a sharp i ncrease in molecular biology labs. Therefore, it is evident that culture-independent real-time PCR will be i ncreasingly used for the assessment of micro bial i ndicators/pathogens in wastewater, especially in resource-limited settings. There is no data available on the molecular quantitat i on of microbial indicators from India. There is an urgent need to understand and evaluate the performance of widely used microbial indicators via molecular quantitation i n Indian WWTPs. Our findings lay the groundwork for the molecular quantitation of microbial i ndicators i n WWTPs in India. We have screened for 12 microbial targets (indicators and human pathogens) and have identified pepper mild mottle virus (PMMoV) and Giardia as the best molecular microbiological indicators in Indian settings. Editor S an dee p T am b e r ,He a lth C a n ad a Copyright @ 2022 C h ow d h ari et a l. Thi s i s an o p e n -a c c e s s a rti cle d is tri b u t e d un d e r the t e r m s o f th e Cre a tive Commo n s Attr i butio n 4.0I nte rn atio n al l icense . Ad dr e s s c o rrespo nden c e t o Perum al V iv eka nanda n , vp e ru m a l@biosch o ol .i i td.ac .i n ,o r W a lt er Q. Bet a n c ourt ,wbet anc o ur t@ar i zo na .e du. The a u t ho rs de c l a r e n o con f lict o f in t e r e st . Received 11 May 2022 KEYWORDS microbial indicators,molecular quantitation, human pathogens,wastewater treatment performance, PMMoV, Giardia hile wastewater reuse is a promising approach to meet the i ncreasing demand W for water, it is vital to assess the microbiological quality of the recycled water for safe reuse applications. Untreated municipal wastewater harbors numerous enter i c patho gens, including those of human fecal origin (bacter i a, protozoa, viruses) that are capable of causing mild to severe enteric diseases (1). Thus, untreated wastewater and improp erly treated recycled water for landscape i rrigation or for the irrigation of food crops pose significant human health r i sks. The total wastewater generated by urban settlements in India in the year 2020 was estimated to be 26.4 km3, of which only 7.38 km3(28%) i s treated by 1,093 sewage treat ment plants (STPs) located in different parts of the country (2). The urban local bodies (ULBs)and regulatory bodies address water reuse for the irrigation of edible and nonedible food crops (inc l uding horticulture), noncontact impoundments, washing, and i ndustrial activities (2). Evaluation methods for the efficiency of wastewater treatment processes currently cover physicochemical parameters, whereas a framework for the estimation of microbial remova efficiency is currently under development. It is well-documented that exposure to sewage-polluted water can lead to disease outbreaks associated with enter i c viruses. For example, a localized outbreak of acute qastroenteritis in southern Mumbai in 2006 was associated with the cocirculation of multiple enteric virus strains that were primarily spread via the consumption of sewage contaminated drinking water (3). In addition, a waterborne rotavirus outbreak during post-earthquake Kashmir i n 2005 was assoc i ated with poor sanitary conditions that resulted in the sewage contamination of drinking water (4). Cases of pediatric diarrhea due to cryptosporidiosis and giardiasis have also been associated with the consump-tion of untreated groundwater in a few districts in India (5, 6). Studies from different geographic locations have demonstrated the occurrence of human enteric pathogens, including Cryptosporidium, Giardia, and numerous enteric viruses in treated wastewater effluents (7-12). In general, most of the literature available on moni-toring strategies for the microbial removal efficiency of wastewater treatment facilities is from developed countries. There is a dearth of data on the efficacy of microbial i ndicators/pathogen removal from wastewater from developing countries, including India. Traditionally, the microbial quality of recycled water for reuse in India is based on the mea-surement of t urbidity or suspended solids, plus other process parameters (including chemica oxygen demand [COD], biological oxygen demand [BOD,], ammonia removal, etc.), along with t he monitoring of fecal indicator bacteria (FIB) via total coliform, fecal coliform, and feca Streptococci counts (13, 14). Numerous studies have demonstrated the limitations of bacterial indicators to evaluate the occurrence and persistence of viral and protozoan pathogens in wastewaters and thus underscore the need for specific indicators for different groups of pathogens (15-18). Both viruses and protozoan parasites have demonstrated a greater re-sistance to UV light disinfection than traditional microbial indicators have (15, 19, 20). I n addition, viruses show variable nonlinear removal i n comparison to conventional i ndicator organisms during the treatment (21, 22). Relatively fewer groups of viruses have been identi-fied as etiological agents of waterborne acute gastroenteritis. This is not because of their infrequent occurrence but because of a lack of specific diagnostics. In order to ensure mini-mal r i sk of exposure to fecally der i ved enteric pathogens from recycled water, standard methods and microbial indicators are required to evaluate the dist r ibution and occurrence of pathogens i n wastewater in specific geographic locations. The monitoring of hundreds of human-pathogenic enteric viral strains known to contaminate aquatic systems i s not practical. Thus, nonpathogenic indicators and human pathogens that are relatively resistant to processes used in wastewater treatment are quanti-tated in inf l uents and effluents to assess log reduction values and the overal l microbial qual-ity of t he wastewater . I n addition to the enumeration of the fecally shed microbial species the discrimination of the source of the fecal contamination (i.e., human or nonhuman source) i n water before its reuse i s important in order to reduce the exposure of the human population to potential human pathogens. To this end, monitor i ng nonpathogenic viruses that are commonly shed in human feces, such as PMMoV (a plant virus of t he Virgaviridae family and the Tobamovirus genus), has provided valuable information as a microbial target of treatment performance (23). PMMoV has been found in a high percentage of pepper-based food products and as the dominant RNA virus in human feces by several metagenomic stud-ies (24). In addition, male F-specific coliphages (MSC) or the direct detection of human-patho-genic enteric viruses, such as enteroviruses and adenovirus, have been demonstrated to be reliable tools with which to assess human sewage pollution in water (25, 26). Culturing may be the best method to assess infectivity; however, the availability of the necessary expertise and i nfrastructure for virus cultur i ng may be a major l imiting factor in resource-limited settings. Over the last 2 years, there has been an unprece-dented increase in the in frastructure and manpower training for real-time PCR across the world, including in developing and underdeveloped countries, to help facilitate the diagnosis of SARS-CoV-2 in the ongoing coronavirus disease pandemic. In other words, contrary to the limited number of facilities for virus cultur i ng, real-time PCR ex-pertise and infrastructure is now widely available throughout the world (27). It is there-fore evident that real-t ime PCR will be increasingly used for the assessment of micro bial indicators/pathogens in wastewate r , especially in resource-l imited settings. We therefore sought to investigate nonpathogenic microbial indicators of human fecal contamination and human pathogens from i nfluents and effluents in three wastewater treatment plants in India. In this study, a comparative quantitative analysis of putative microbial i ndicators of fecal contamination, including PMMoV, F-specific RNA coliphages genogroup I to l, and B. thetaiotaomicron (B. theta), as well as human pathogens, including human adenoviruses (HAdVs), enteroviruses (EV), noroviruses (NoV GI-II), Giardia, and C. coli, was conducted at three municipal wastewater treatment plants (WWTPs) located in two major cities in north-ern (Delhi) and north-western (Jaipur) India. The microbial i ndicators selected for this study have been consistently reported in the influents and effluents of wastewater treatment facilities across the world with a moderate to high statistical correlation between the loads of the different microbial targets (nonpathogenic indicators and human pathogens)Finally, this study aimed to identify a nonpathogenic indicator and a human pathogen that could serve as reliable indicators of treatment performance and of the overall water quality of treated effluents i ntended for water reuse in Indian settings. RESULTS Molecular detection and quantification of microbial indicators and pathogens in the raw influent. All of the microbial pathogens and indicators were detected ir influent samples at slightly different frequenc i es (Table 1). The l imit of detect i on was optimized to ≤10 genome copies/reaction for all of the PCR assays. The following 7 indicators were detected i n 100% of the influent samples: (i ) the 3 nonpathogenic indicators of human fecal contamination (i .e., PMMoV, fecal coliform bacteriophage F+RNA Gll , and B. theta) and (ii) foul human pathogens (i .e., NoV GI, NoV Gll, Giardia, and C. coli). Among the i nfluent samples (n =9), PMMoV was the most abundant microbial target, ranging from 5.7 to 6.2 log1o gc/L across the influents (n =9) with a coefficient of variance (CV) of 29.4%, followed by F +RNA GI (5.0 to 6.1 log1o gc/L, CV of 89.5%) and B. t heta (3.6 to 6.0 log1o gc/L, CV of 129.8%). F +RNA GII was detected in 77.7% of the i nf l uent samples (5.3 to 6.7 log1o gc/L, CV of 133.5%), while F +RNA Gl and F +RNA GIV were not detectable in any of the influents (Fig. 1). PMMoV has been detected i n both domestic wastewater influents and effluents in a concentration range between 1 to 9 log1o gc/L i n different parts of the world. PMMoV RNA has remarkable stability in wastewater , making it an attractive indicator of human fecal contamination in domestic wastewaters (28). In addition to being detected at the highest concentrations in our study, PMMoV was associated with the lowest coefficient of variance, suggesting minimal variations within and across sites. Thus, PMMoV may represent the most suitable i ndicator for human fecal contamination in urban settings in India. TABLE 1 Detection of nucleic acids from microbial indicators and human pathogens in raw influent samples" Pathogen/indicator Positive samples/ Pathogen/Indicator characteristics Host characteristics no.tested WWTP-1 WWTP-2 WWTP-3 Adenovirus Nonenveloped dsDNA viruses Numerous mammals, including humans 88.8%(8/9) 十十十 十十十 十十- PMMoV Nonenveloped (+)ssRNA viruses Pepper plants 100%(9/9) 十十十 十十十 十十十 Enterovirus Nonenveloped (+)ssRNA viruses Numerous mammals, including humans 77.7%(7/9) 十-十 十-十 十十十 Norovirus GI Nonenveloped (+)ssRNA viruses Numerous mammals, including humans 100%(9/9) 十十十 十十十 十十十 Norovirus GII Nonenveloped (+)ssRNA viruses Numerous mammals, including humans 100%(9/9) 十十十 十十十 十十十 F+RNA GI Nonenveloped (+)ssRNA viruses Faecal coliform bacteria 0%(0/9) 一 F+RNA GII Nonenveloped (+)ssRNA viruses Faecal coliform bacteria 100%(9/9) 十十十 十十十 十十十 F+RNA GIII Nonenveloped (+)ssRNA viruses Faecal coliform bacteria 77.7%(7/9) 十- 十 十一十 十十十 F+RNA GIV Nonenveloped (+)ssRNA viruses Faecal coliform bacteria 0%(0/9) 一 Giardia Protozoan parasite, dsDNA Numerous mammals, including humans 100%(9/9) 十十十 十十十 十十十 B. thetaiotaomicron Gram-negative bacteria,dsDNA Exclusively found in the human gut 100%(9/9) 十十十 十十十 十十十 C. coli Gram-negative bacteria, dsDNA Commensals in animals, causes foodborne illness in humans 100%(9/9) 十+十 十十十 +十十 "G: Genogroup."+"indicates that the microbial indicator/pathogen was detected,and "-"i ndicates that the microbial indicator/pathogen was not detected. Three sampling events are represented for each microbial indicator/pathogen at all three of the sites. Bacter i ophages are widely distributed i n the environment and are known to exist for all known bacterial species (29). Enteric bacteriophages (male specific F +RNA coli-phages) have been found in both wastewaters and various foods (including meat, such as fresh chicken, ground beef, pork sausage, and shellfish) due to their resistance to harsh environmental conditions and to chemical and physical treatments, such as dis-infection, compared to fecal indicator bacteria (e.g., coliforms and enterococci).F+RNA coliphages have been well-recognized as the mode l organisms in the characterization and management of water resources for near l y 5 decades (29-32). Among the four an-tigenically distinct genogroups (G) of F +RNA coliphages, G l and G lV are found i n animal fecal waste, whereas G I I and G III are predominately associated with human feces or waste-water derived from domestic sewage. Therefore, the genotype-specific detection of F +RNA coliphages in wastewater i s a promising tool for t racking the sources (animal or human) of fecal contamination (33, 34). The Bacteroides-associated marker Bacteroides thetaiotaomicron (B. theta) has been described as a symbiont and a "niche"organism in the human gut (35)and i ts presence in wastewater is a presumptive bacterial indicator of human fecal contami-nation (36). In our study, we were able to detect F+RNA GII and Glll, whereas F+RNA Gl and GIV were not detectable i n any of our influent samples, indicating that the source of feca waste i s primarily derived from human excrement. c c o c Pathogen/Indicator FIG 1 Molecular quantification of microbial indicators and pathogens in inf l uent samples. Quantitation of nucleic acids from indicators of microbial contamination and from human pathogens (genome copies/L) across influent wastewater samples (n =9). The green, pink, and purple dots represent samples from WWTP-1, WWTP-2, and WWTP-3, respectively. The horizontal line represents median concentrations. Microbial i ndicators or human pathogens that are not detected are not plotted i n this graph. Among the pathogens that were consistently detected in all of the raw inf l uent samples, Giardia was the most abundant in the i nfl u ent samples (5.1 to 6.0 log10 gc/L,CV of 59.3%), followed by NoV Gll (4.0 to 5.7 log1o gc/L, CV of 114.7%), NoV Gl (2.7 to 6.2log1o gc/L, CV of 161.9%), and C. coli (2.9 to 4.1 log1o gc/L, CV of 56.2%). HAdV (2.2 to 5.8log1o gc/L, CV of 230.8%) and EV (2.4 to 5.2 logho gc/L, CV of 127.6%) were detected in 88.8%and 77.7% of the raw i nfluent samples, respectively (Fig. 1). Of note, the norovirus and adenovirus loads in our influent samples (median loads for noroviruses Gl and Gl l were < 5 log1o gc/L, and median loads for adenoviruses were wel below 4 log1o gc/L) were lower than those reported from other geographical regions (noro virus loads and adenovirus loads in influent samples were up to 8 log1o or 9 log1o gc/L) (1137). The preliminary evaluation of virus recovery efficiency using MS2 and ①X 174 bacterio-phages spiked into tertiary effluent and untreated wastewater indicated >80% recoveries obtained via dead-end ultrafiltration (DEUF) using Ashai Kasei REXEED-25S ultrafilters (unpublished data). Since there is no data on noroviruses and adenoviruses that have been reported from India, it is particularly challenging to understand the lower loads for these viruses in our samples. A meta-analysis has revealed that the prevalence of norovirus infec-tions may be lower i n many developing countries compared to that observed i n developed countries (38). I n addition, fish and shellfish consumption per capita in India is among the lowest in the world (39). Seasonal variations have been documented among enteric adenoviruses with peaks i n spring, summer, and midwinter (40). Our samples were collected during the f all , and perhaps this may explain, in part, the lower adenovirus loads in our influ-ent samples. Regardless of the underlying reasons, the lower loads for noroviruses and adeno-viruses in our influent samples suggests that these viruses may not be useful i ndicators of virus reductions during wastewater treatment in India. It has been well-documented that the shedding of enteroviruses in feces (i.e., number shed per gram of feces) is about 3 to 6 log1o lower than that of noroviruses and adenovi ruses (15). In our study, the load for enteroviruses at WWTP-1 (in Delhi) was comparable with that reported f rom other geographic regions (41, 42). However, the enterovirus loads in the i nfluents f rom WWTP-2 and WWTP-3 i n Jaipur were lower. This finding suggests the existence of significant region-specific variations in enterovirus concentrations at the same time points between Delh i and Jaipur. This f inding also suggests that enteroviruses may not be ideal surrogates for human pathogens in wastewater i n India. The concentration of Giardia varied from undetectable up to approximately 5 log1o gc/L in raw wastewater samples from around the world (43). Interestingly, in the present study Giardia was consistently detected at much higher levels (>5 log1o gc/L i n 8 of the 9 samples of raw i nfluents) in the influent samples, suggest i ng that it may be a good microbial marker for pathogens i n Indian settings. Campylobacter coli was detected at a variable concentration range of 2.9 to 4.1 log1o gc/L across all of the influents. The physicochemical parameters, i ncluding the pH, temperature, turbidity, BOD,, COD and total Kjeldahl nitrogen (TKN) of the collected influents and treated effluents from the WWTPs are summarized in the Supplemental Material (Table S1). The percentage reduction in BOD5, COD, and TKN in the effluent wastewater samples f rom all three of the WWTPs is also summarized in the Supplemental Material (Fig.S1). Quantitation of microbial indicators and pathogens in effluent samples. The majority of the microbial i ndicators and pathogens detected in the influent samples were also detected after treatment at lower concentrations than those observed in the influent samples. As shown i n Fig. 2 (concentration of microbial targets at various stages of treat-ment) and Fig. 3 (log reduction values [LRV] of microbial targets after secondary and ter t i ary treatment), among the pathogenic enteric viruses, a 5 log1o reduction of EV was consistently observed at WWTP-1. HAdV and norovirus Gl were detected at variable concentrations before and after tertiary treatment at each WWTP. For HAdV, a reduction (mean LRV [±SD]) of 2.7(±0.4),1.2(±0.9)and 1.9 (±1.9) log1o was achieved within WWTP-1, -2, and -3, respectively. For NoV Gl, a reduction of 2.6 (±2.0),1.7(±1.2), and 1.9 (±0.3) logio was achieved within WWTP-1,-2and -3, respect i vely. On the other hand, the reduction of Norovirus GII corresponded to 3.2 Inf: Influent;2°Eff: 2 Effluent: 30Eff: 3° Effluent 一 : 107-106-105-104-10-102- 101- 106-105- 107一104-103- 102- 101- 106- 105- 101- 10 102- 101- 1 10*- 10- 104- 10- 102- 一 ● 101- 10一 105- 10- 10103 · 102- 10 107一 105-105-104-10102-101- 107+ 106- 105- 104- 103- 102- 101- 101 105- 10- 104- 101- 102- 101- Inf 2"Eff 3%Eff PMMoV 107一 中三 10- 105- 101- 10- 102- 101- 10 10- Inf 2'Eff 3'Eff Enterovirus 107一 10- 105- 104- 10- 10- 101- 100 Inf 20Eff 30Eff Norovirus GI 10一 105- 105- 104- 103- 102- 101- Inf 20Eff 30Eff Norovirus GII 10一 106- 十 105- 104- 103- 1022-一 101- 100 一T Inf 20Eff 30Eff F+RNA GII 107 10- 10- 104- 10- 102- 101- 10 厂 Inf 2'Eff 3'Eff F+RNA GIII 107一 10- 10- 104- 10- 102- 10- 10 Inf 2'Eff 3Eff Giardia 107一 105- 10- 104 103- 102 101. Inf 2'Eff 3*Eff B. theta 107. 106.105.104.103.102.101- Inf 2'Eff 3'Eff C. coli 10 Inf 2"Eff 3Eff PMMoV 10一 10-105-104-10102- 101- 100 Inf 2'Eff 30Eff Enterovirus 107一 105- 10-10- 10- 102- 10- Inf 20Eff 3%Eff Norovirus GI 107- 105. 105-104103. 102- 101- Inf 20Eff 3Eff Norovirus GII 10一 105- 105. 104.103. 1022-2 101- T Inf 20Eff 30Eff F+RNA GII 107一 10- 10- 101- 10- 102- 101- 100 Inf 2'Eff 3%Eff F+RNA GIII 107- 105-105.10410102101 10 Inf 29Eff 30Eff Giardia 10一 105- 102- 104- 10- 102- 101- Inf 20Eff 30Eff B. theta 107一 十 105105.104-10*-102.101. Inf 20Eff 30Eff C. coli FIG 2 Comparison of microbial loads in influent and effluent samples. Concentration (genome copies/L) of each microbe (including human adenoviruses [HAdV], pepper mild mottle virus [PMMoV, enteroviruses [EV], norovirus genogroup 1 [NoV Gl], norov i rus genogroup 2 [NoV Gll], Giardia, and F -specific RNA coliphages genogroups l and I I [F +RNA GII, F *RNA GII], B. theta, and C. coli) at different stages of treatment (Inf, influent; 2°Eff, 2°effluent; and 3° Eff, 3°effluent) within a WWTP. Each data point represents the concentration (genome copies/L ) of the respective microbial indicator/pathogen. The hor i zontal line represents the median values. (±1.3),1.6(±0.3), and 0.7 (±0.3) log1o for WWTP-1, -2, and -3, respectively. PMMoV was detected at a consistently high concentration across all of the i nfluent samples collected from the three WWTPs. The reduction in PMMoV ranged from 1.2(±0.17) to 2.7(±0.2)log1across the WWTPs. Moreover , the PMMoV level s did not vary much across effluent samples from either within or between sites (Fig. 2). PMMoV has been f requently found i n treatec effluents from different countr i es (10, 44, 45) and i n recharged groundwater for reuse appli-cations (22). As a plant virus, PMMoV has an extremely high stability in both terrestrial and aquatic environments. This virus has been shown to survive standard food processing, such as in the manufacturing of hot chili sauce and powdered chili (28). The thermal inactivation of this and other members of the Tomabovirus genus occurs above 80℃. F +RNA GlI showed a maximum but variable reduction in the effluents from WWTP-1 and somewhat lower but consistent reductions in effluents from WWTP-2 and -3. The F +RNA GII showed a reduction of 3.8 (±1.2), 2.4(±1.1), and 3.3 (±1.8) log1o i n WWTP-1, -2, and -3respectively. For Giardia, a reduction of 4.5 (±0.8),1.8(±0.3), and 1.7 (±0.7) logio Was observed in the tertiary effluents from WWTP-1,-2, and -3, respect i vely. The reduction i n load of the final effluent, normalized to the i nfluent load, for pathogens and nonpathogenic microbial i ndicators of human fecal contamination (i.e., PMMoV, fecal coliform bacteriophage F +RNA Gll , and B. theta) is shown i n Fig. 4. The extent of the remova of the microbial indicators/pathogens ranged from about 93.2% to 99.6% (i .e., from 1.7log1to 2.9 log1). Several reports from developed countries indicate a 75% to 99% reduction of loads in f inal effluents compared to those observed in influent samples (21,46). Our data suggest that the extent of reduction in the microbial load in the studied WWTPs are compa rable. In addition, our results suggests that nonpathogenic microbial indicators of human fecal contamination are associated with i ncreased retention in the f inal effluent compared to molecular indicators of human pathogens. This f inding reiterates that the detection of nonpathogenic indicators of human fecal contamination is more reliable than the detection FIG 5 Correlation between microbial loads in influents, effluents, and log1 reduction values . Correlation (Spearman’s rank correlation coef f icient ) matrices of the microbial nucleic acid loads present in the (A) influent, (B) f inal effluent, and (C) log1o reduct i on values in the f inal eff l uent wastewater. A statistically significant correlation (P value ≤ 0.05) is i ndicated by bold font and an outline. between the two methods (47-49). Furthermore, F + specific coliphages range from 5.0 to 7.0log1o PFU/L in raw municipal wastewater samples from different countries (31). This range is comparable to the qPCR data obtained for the F+ spec i fic coliphages (5.0 to 6.7 log1o gc/L) in the wastewater influents sampled i n this study. Nonetheless, several studies report an increased sensitivity or overestimation by qPCR compared to plaque assay methods. For example, higher levels of F+-specific coliphages were detected by using qPCR compared to those measured using plaque assays (47, 50). Culture-based methods detect only viable or infectious microbes whereas qPCR detects genomes f rom both viable and nonviable microbes. In addition, the dif ferences in viability and the resistance to wastewater treatment among microbial indicators/pathogens will impact the correlation between culture-based methods and qPCR. Culture based methods may be ideal to assess the public health threat posed by a pathogen Nonetheless, culture-based methods are not available for many microbial indicators/pathogens (e.g., Giardia, PMMoV, and noroviruses). Therefore, apart from data from culture-based methods qPCR data have also been used for quantitative microbial risk assessment (QMRA) (51,52). Correlation between the microbial loads of indicators and pathogens. In order to understand the correlation, i f any, among the concentrations (loads) of microbial indicators and the human pathogens detected in the i nfluent, statistical correlations were computed. The Spearman's correlation coefficient (p) was calculated between the nucleic acid loads (gc/L) of all of the microbial targets present in the influent samples to the fina effluents and the LRVs in the final effluents (Fig.5). Interestingly, the PMMoV (a virus indica tor of human fecal contamination) loads showed a strong correlation to the NoV GII (a human pathogen) loads (p =0.91, P≤ 0.05) i n the i nfluent samples. Similarly, the F +RNA GlI (a bacteriophage indicator of human fecal contamination) loads showed a strong correla-tion to the NoV Gl (a human pathogen) loads (p=0.73, P≤0.05) among i nfluent samples B. theta (a bacterial i ndicator of human fecal contamination) loads correlated strongly with EV (human pathogens) loads (p=0.74, P ≤ 0.05) i n influent samples tested. Among the three microbial indicators of human fecal contamination, the PMMoV loads did not have any correlation to the F+RNA GII loads or to the B. theta loads in the influent samples However, the F+RNA GII loads and the B. theta loads showed a strong correlat i on with one another (p=0.75,P≤0.05) (Fig.5A). Our data demonstrate nonuniform reduction in the loads of microbia l indicators and human pathogens in the f inal effluents. In the f inal effluents, the PMMoV loads demonstrated a strong correlation with EV (p=0.73, P≤0.05). The B. theta loads correlated strongly with PMMoV (p=0.87,P≤0.05),EV (p=0.80,P≤0.05), and C. coli (Fig.5B). The Spearman's rank correlation was also used to determine significant relationships between the LRVs of microbial indicators and human pathogens in the final ef f luents. The results indicated that the reduction of PMMoV loads (LRV) correlated strongly with the LRVs of the EV loads (p=0.96, P≤0.05), NoV GlI l oads (p=0.72, P≤ 0.05), and Giardia loads (p =0.79; P ≤ 0.05) in the effluent samples. The extent of reduction (i.e., the LRV) in the Giardia loads in the effluent samples correlated strongly with the reductions in HAdV PMMoV, EV, and F +RNA GII (p=0.79,0.79,0.82, and 0.71, respectively; P ≤0.05). The reduc-tion i n the B. theta loads showed a strong corre l ation with the reduction of the F +RNA GI loads (p=0.73,P≤0.05) (Fig.5C). D I SCUSS I ON These f indings highlight the advantages of rapid screening for multiple microbia indicators of human fecal contamination/human pathogens by using real-t i me PCR to assess the influents and final effluents from WWTPs. Nonetheless, PMMoV and Giardia appear to be the best microbial markers of treatment performance i n Indian settings as (i) they are consistently present at a high abundance (higher loads), (ii) their loads are less variable (low coefficient of var i ance) within and across the sites, and (iii ) they show a strong correlation with other microbial indicators of human fecal contamina tion and human pathogens i n both the influent and the f inal effluent samples. The small number of samples and sites studied represents a major limitation of this study.In addition, most of the samples were collected during fal l and thus may not capture seasonal variations, if any exist. This study quantif i ed 12 microbial agents, including nonpathogenic indi-cators and human pathogens, including bacter i a, enteric RNA viruses, an enteric DNA virus,bacteriophages, and a protozoan parasite from WWTPs in India for the first time. However, the quantitation of microbial genome copies in wastewater may not necessarily indicate the pres-ence of infectious agents or a risk to human health. Nonetheless, our study demonstrates the advantages of molecular approaches for the rapid evaluation of multiple microbial targets i n order to identify suitable microbial water quality targets for the safe and sustainable reuse of water in India (53). Correlation between microbial loads and physiochemical properties. Overall there was no cor r elation between the microbial loads/LRVs and the physiochemical parame-ters evaluated in this study, with a few exceptions (Fig. S4; shown i n bold font). For example statistically significant correlations were found between the Giardia loads i n t he effluent and the BOD5 and COD levels i n the effluent. However, this trend was not observed for the LRV of Giardia. As wastewaters harbor complex combinations of substances that are often unknown and have i nteractive effects (54), the poor correlation between the microbial loads/LRVs and the physiochemical parameters observed in this study may also be due to nonmicrobial factors that affect the physiochemical parameters, including the presence of fossil organic carbon (55). I n addition, the small sample size or the differences in the waste-water treatment processes between the sites may also contribute to the weak correlation observed (Fig.6B). Conclusion. Through the comparative molecular quantification of 12 putative microbia pathogens and indicators of water quality for reuse applications i n India, 2 microbial targets have been identified as suitable indicators of treatment performance. The findings of this research suggest that PMMoV and Giardia may be suitable microbial indicators of waste-water treatment processes in Indian settings, as they were consistently detected i n the influent and/or effluent samples within and across the WWTPs, showing significant corre-lations between the log1o reduction patterns of human pathogens, such as noroviruses,adenoviruses, and enteroviruses. The consistent detection of several human pathogens,including enter i c viruses and Giardia in the final effluents, highlights the potential r isk associated with water reuse. This work lays the foundation for subsequent research related to microbial indicators and pathogens i n recycled waters intended for reuse in India, in which seasonality, multiple cities, and additional microbial targets are considered in order to eluci-date the performance of both microbial indicators and wastewater treatment processes that are meant to ensure the protection of the environment and public health. (A) Delhi Jaipur (B) FIG 6 Sampling sites and wastewater treatment processes: (A) the wastewater samples were collected from wastewater treatment plants located in two major cities in northern (Delhi) and north-western (Jaipur) India, i ndicated on a map of India with a (inset) topographic view. (B) The layout of the treatment process employed at the wastewate r treatment plants: WWTP-1 (De l hi ), WWTP-2 (J aipur, Rajasthan), WWTP-3 (Jaipur, Rajasthan). SBR, sequencing batch reactor; MBBR, moving bed biofilm reactor; DMF, dual media filter; ACF, activated carbon filter; UV, ultraviolet light. MAT E RIALS AND METHODS Study sites and sampling. Three wastewate r treatment plants, namely, WWTP-1 (located in south Delhi ), WWTP-2 (located in Jaipur, Rajasthan), and WWTP-3 (located in Jaipur, Rajasthan) were included in this study. A total of 27 wastewater samples were collected for this study. From each WWTP, samples were collected on three separate occasions (i .e., on August 24, 2021, August 31, 2021, and September 7, 2021). For each sample, composite samples of wastewater were collected i n carboys from different stages of t reatment within each WWTP, i ncluding the i nfluent raw sewage, the effluent after secondary treatment, and the effluent after tertiary treatment. The water samples were brought to the laboratory in an i nsulated cooler box as per the APHA guidelines (56) and processed for further analysis within 1 h of collection. Table 2 l ists the WWTP characteristics and the details regarding the sample volumes. A description of the treatment processes employed at each WWTP is depicted in Fig. 6. Physicochemical parameters. The physicochemical parameters, including pH, water temperature,turbidity, BOD,,chemical COD, and TKN were monitored for all samples using standard protocols. Brief l y, the pH was measured using a pH meter (57). Turbidity was measured using a Lutron turbidity meter (Model: TU-2016).The organic strength of the wastewater was measured by the 5-day BOD (BOD,) and COD, using standard methods (58) and the closed ref l ux method (59), respectively. TKN was analyzed us i ng an infrared digestion unit (Turbotherm, Gerhardt, Konigswinter, Germany) after dis t illation in a semiautomatic steam distillation unit (Vapodest 20, Gerhardt, Germany). Primary and secondary concentration of wastewater samples. The wastewater samples were sub-jected to DEUF, using Ashai Kasei REXEED-25S ultrafilters (Asahi Kasei Medical Amer i ca Inc., Glenview, IL)as previously described (60), with a Cole-Parmer Master f lex L/S peristalt i c pump (model D600 DS) (Cole Palmer,Vernon Hills, IL) and Masterflex neoprene silicone tubing (Masterflex) at a flow rate of 1 L/min. Autoclaved TABLE 2 Wastewater treatment plant (WWTP) characteristics and sample volumes Site of installation Population served Type of influent/ sewage processed Sampling WWTP Capacity Flow rate Reuse application Influent 2°effluent 3°effluent WWTP-1 South Delhi 12,000 to 13,000 Institutional & Domestic 0.5 MLD 500 m²/day Landscape irrigation 11L(n=3) 10L(n=3) 10L(n=3) waste WWTP-2 Jaipur, Rajasthan 10,000 to 11,000 Institutional waste 1.2 MLD 1,000 m/day Landscape irrigation 1L(n=3)10L(n=3) 10L(n=3) WWTP-3 Jaipur, Rajasthan 9,000 to 10,000 Mixed (Municipal,hospital)1 1.0 MLD 1,000 m/day Landscape irrigation 1L(n=3) 5L(n=3) 5L(n=3) tubes and connectors were used in each analysis. After filtration, each REXEED-25S ultrafilter was backflushed with sterile 200 to 300 mL eluent (0.01% NaPP,0.5% Tween 80,0.05 M glycine; pH 9.0 to 9.5), and the eluate (primary concentrate) was collected in sterile polypropylene bottles. The eluate was further concentrated via polyethylene glycol (PEG8000) and sodium chloride (NaCl ) precipitation. To each sample, we added PEG8000(14%) and NaC l (0.2 M), and we kept the bottles for overnight vigorous shaking (4℃, 16 h), followed by centrif-ugation at 8,500 ×g. The supernatant was carefully removed, and the pellet was resuspended in 8 to 12 mL of sterile phosphate buffered saline (PBS, pH 7.5) containing 0.25% Tween 80 (secondary concentrate). Nucleic acid extraction and quantitative evaluation of the microbial indicators. Total nucleic acid f rom t he secondary concentrates was extracted with two commercially available kits: a QIAamp UltraSens Virus Kit (Qi a gen, GmbH, Germany) and an All Prep DNA/RNA Minikit (Qiagen, GmbH, Germany) for maximum recovery, following the manufacturer's i nstructions. For every sample, an equal volume of nucleic acid extracts from each kit was combined, and 3 uL of t he pooled extract was used as a template for each reaction. Real-time reverse transcription quantitative PCR (RT-qPCR) was performed for the quantitative evaluation of the RNA viruses (PMMoV, enterovirus, Gl and Gll norov i rus, and F *RNA phages genogroups I and I, whereas qPCR was performed for the quantitative evaluation of adenovirus, Giardia, B. theta and C. coli. The qPCR assays were performed using the 1-step QuantiNova Probe RT-PCR Kit (Qiagen, GmbH, Germany) in a 20 uL reaction volume with f i nal concentrations of pr i mers and probes corresponding to 0.8 uM and 0.25 uM, respective l y.The primers and probes used in this study are l isted i n the Supplemental Material (Table S2). Generation of standard curves and quantitation of microbial nucleic acid loads. The qPCR ampli-fied products from raw sewage (influent wastewater) for each of the targets (i .e., adenovirus , PMMoV, enterovirus,norovirus Gl, norovirus G l l, Giardia, FRNA GII, FRNA GIII, B. theta, and C. coli) were purified and cloned into the pGEM T -easy vector and sequenced to ensure accuracy. Standard curves were plotted using l ogro serial dilutions of the cloned plasmid DNA ranging from 10 to 10 copies/rxn in t riplicate. The amplification ef fi c i ency was inferred via a linear regression analysis. All 9 of the real -time PCR assays were optimized to greater than 98% effi-cacy (R²> 0.98). The concentration (microbial nucleic acid load) of each target organism was extrapolated from the respective s tandard curves and i s i ndicated as genome copies/L (gc/L). The data (gc/L) was logr o-transformed to obtain a normal distribution. The log reduction values (LRV) of the viruses that were achieved via the treatment processes were calculated using the f ollowing equation (61): Statistical analysis. The coefficient of variance (CV%) was calculated to assess the variability in the abundance of microbial targets (nucleic acid loads) across the three WWTPs, using the formula CV%=(Stand a rd deviation/mean)× 100 in Microsoft Excel 2021 for Windows 10 (Microsoft Corp., Redmond, WA). Spearman's rank cor r elation (p) test was performed to determine the assoc i ation, if any, between the microbial nucleic acid loads present in the (i) influents, (i i ) final effluents, and (i i i ) LRVs of the final effluent wastewaters. P values of ≤0.05 were considered to be indicative of a statistically significant result. Scatterplots for the representation of the distribution of the microbial nucleic acid loads between and within the WWTPs, t he p values, and the P val -ues were calculated using GraphPad P r ism version 9.0. SUPP L EMENTAL MA T ERIA L Supplemental material is available onl i ne only. SUPPLEMENTAL FILE 1, PDF fi l e, 0.8 MB. ACKNOWLEDGMEN T S This research was supported through the PARTNERSHIP 2020 program, a collaborative agreement between the University of Nebraska at Omaha (UNO) and U.S. Department of State (DOS) with the Center for Strategic and International Studies (CSIS) playing a key advisory role. This project was funded through an agreement between the University of Nebraska at Omaha and Drexel University, Philadelphia, under Federal Award number SIN65018CA0034We thank Shaikh Z. Ahammad (Department of Biochemical Engineering and Biotechnology Indian Institute of Technology De l hi, I ndia) and his student Prachi Chavan for providing support with the Cole-Parmer Masterflex L/S peristaltic pump along with the Masterflex neoprene s ilicone tubing. S.C. was supported by the Indian Council of Medical Research-Research Associate (ICMR-RA) fellowship, and Samridhi Rana was supported by the IITD institute fellowship for Ph.D. program. We declare no known competing interests that could have potentially influenced the work reported i n this paper. P.V., W.Q.B., P.L.G., and R.S. served as mentors. W.Q.B., C.M.M., and S.E.A. developed the methodology for the DEUF and concentrat i on of wastewater. Samridhi Rana and Arun Kumai performed the physicochemical analysis of the wastewater samples from WWTP-1.Shubham Rana and Amit Kumar performed the physicochemical analysis of the wastewater samples from WWTP-2 and WWTP-3. S.C. performed the DEUF and concentration of wastewater samples , nucleic acid extraction, molecular biology experiments, data analysis and visualization tasks and wrote the original draft. P.V., W.Q.B., P.L.G., Amit Kumar, Arun Kumar, and S.C reviewed and edited the manuscript. 1. Salgot M, Folch M. 2018. Wastewater treatment and wate r reuse. Curr Opin En-viron Sci Hea l th. Elsevier B.V. https://doi .org/10.1016/j .coesh.2018.03.005. 2. Minhas PS, Saha JK, Dotaniya ML, Sarkar A, Saha M. 2022. Wastewater irri-gation in India: current status, impacts and response options. Science of the Total Environment 808:152001. https://doi.org/10.1016/j.scitotenv.2021.152001. 3. Chitambar S, Gopalkrishna V, Chhabra P, Patil P, Verma H, Lahon A, Arora R, Tatte V, Ranshing S, Dhale G, Kolhapure R, Tikute S, Kulkarni J, Bhardwaj R, Akarte S, Pawar S. 2012. Diversity in t he ente ri c viruses detected i n out-breaks of gastroenteritis from Mumbai , Western India. Int J Environ Res Public Health 9:895-915.https://doi.org/10.3390/ijerph9030895. 4. Karmakar S, Rathore AS, Kadri SM, Dutt S , Khare S, Lal S. 2008. Post-earth-quake outbreak of rotavirus gastroenteri t is in Kashmir (India): an epidemiological analysis. Public Health 122:981-989. https://doi.org/10.1016/j.puh e.2008.01.006. 5. Daniels ME, Smith WA, Jenkins MW. 2018. Estimating Cryptosporidium and Gi a rdia disease burdens for children drinking untreated groundwater i n a rural population in I ndia. PLoS Negl Trop Di s 12:e0006231. https://doi .org/10.1371/journal.pntd.0006231. 6. Utaaker KS, Joshi H, Kumar A, Chaudhary S, Robertson LJ. 2019.Occur -rence of Cryptosporidium and Giardia i n potable water sources in Chandigarh,Northern India. J Water Supply: Res and Technology-AQUA 68:483-494. https://doi.org/10.2166/aqua.2019.157. 7. Betancourt WQ, Rose JB. 2004. Drinking water treatment processes for re -moval of Cryptosporidium and Giardia . Vet Paras i tol https://doi.org/10.1016/j .vetpar.2004.09.002. 8. Charles KJ, Souter FC, Baker DL, Davies CM, Schijven JF, Roser DJ , Deere DA, Priscot t PK, Ashbolt NJ. 2008. Fate and transport of viruses during sewage t reatment i n a mound system. Water Res 42:3047-3056. http s://doi.org/10.1016/j.watres.2008.02.032. 9. Kuo DHW, Simmons FJ, Blair S, Hart E, Rose JB, Xagoraraki l. 2010. Assess-ment of human adenovirus removal in a full-scale membrane bioreactor treating municipal wastewater. Water Res 44:1520-1530.https://doi .org/10.1016/j .watres.2009.10.039. 10. Schmitz BW, Kitajima M, Campillo ME , Gerba CP, Pepper IL. 2016. Virus reduc t ion during advanced bardenpho and conventional wastewater treatment processes. Environ Sci Technol 50:9524-9532. https://doi .org/10.1021/acs.est.6b01384. 11. Simmons FJ, Kuo DHW, Xagoraraki l . 2011. Removal of human enteric viruses by a full-scale membrane bioreactor during municipal wastewater proc-essing. Water Res 45:2739-2750.https://doi .org/10.1016/j.watres.2011.02.001. 12. Xagoraraki l , Yin Z, Svambayev Z. 2014. Fate of viruses i n water systems. J Envi-ron Eng 140:e04014020. https://doi.org/10.1061/(ASCE)EE.1943-7870.0000827. 13. Jamwal P, Mittal AK, Mouchel JM. 2009. Efficiency evaluation of sewage treatment plants with different technologies in Delhi (India). Environ Monit Assess 153:293-305.https://doi.org/10.1007/s10661-008-0356-9. 14. Pant A, Mittal AK. 2007. Monitoring of pathogenicity of effluents from the UASB based sewage treatment plant. Environ Monit Assess 133:43-51.htt ps://doi.or g /10.1007/s10661-006-9558-1. 15. Gerba CP, Betancourt WQ, Kitajima M. 2017. How much reduction of virus is needed for recycled water : a continuous changing need for assessment?Water Res 108:25-31.https://doi.org/10.1016/j .watres.2016.11.020. 16. Gerba CP, Betancourt WQ. 2019. Assessing the occurrence of waterborne viruses in reuse systems: analytical limits and needs. Pathogens 8:107.https://doi.org/10.3390/pathogens8030107. 17. Rose JB, Dickson LJ, Farrah SR, Carnahan RP. 1996. Removal of pathogenic and indicator microorganisms by a f ull -scale water reclamation facility. Wat Res. 18. Rose JB, Haas CN, Regli S. 1991. Risk assessment and control of water-borne giardiasis. Am J Public Health 81:709-713. https://doi .org/10.2105/aj ph.81.6.709. 19. World Health Organization. 2004. Water treatment and pathogen control :process eff i c i ency in achieving safe drinking water. 20. Gerba CP, Betancourt WQ, Kitajima M, Rock CM. 2018. Reducing uncer -tainty in estimating virus reduction by advanced water treatment processes.Water Res 133:282-288.https://doi.org/10.1016/j.watres.2018.01.044. 21. Betancourt WQ, Schijven J, Regnery J, Wing A, Morrison CM, Drewes JE,Gerba CP. 2019. Variable non-linear removal of viruses during transport through a saturated soil column. J Contam Hydrol 223. https://doi.org/10.1016/j .jconh yd .2019.04.002. 22. Betancourt WQ, Kitajima M, Wing AD, Regnery J, Drewes JE, Pepper IL,Gerba CP. 2014. Assessment of virus removal by managed aquife r recharge at three full -scale operations. J Environ Sci Health A Tox Hazard Subst Environ Eng 49:1685-1692.https://doi.org/10.1080/10934529.2014.951233. 23. Rosario K, Symonds EM, Sinigalliano C, Stewart J, Breitbart M. 2009. Pep-per mild mottle virus as an indicator of fecal pollution. Appl Environ Microbiol 75:7261-7267.https://doi.org/10.1128/AEM.00410-09. 24. Kitajima M, Sassi HP, Torrey JR. 2018. Pepper mild mottle virus as a water qual-ity indicator. NPJ Clean Water 1. https://doi.org/10.1038/s41545-018-0019-5. 25. Balleste E , Blanch AR , Mendez J, Sala -Comorera L, Maunula L, Monteiro S,Farnleitner AH, Tiehm A, Jofre J, Garc i a-Aljaro C. 2021. Bacteriophages are good estimators of human viruses present in water. Front Microbiol 12.h tt ps://doi.org/10.3389/fmicb.2021.619495. 26. Fong T-T, Lipp EK. 2005. Enteric viruses of humans and animals i n aquatic environments: health r i sks, detection, and potential wate r quality assessment tools. Microbiol Mol Biol Rev 69:357-371.https://doi .org/10.1128/MMBR.69.2.357-371.2005. 27. Okeke IN, Ihekweazu C. 2021. The i mportance of molecular diagnos t ics for infectious diseases in low-resource settings. Nat Rev Microbiol 19:547-548.https://doi.org/10.1038/s41579-021-00598-5. 28. Symonds EM, Nguyen KH, Harwood VJ, Breitbar t M. 2018. Pepper mild mottle virus: a plant pathogen with a greater purpose in (waste)water treatment development and public health management. Water Res 144:1-12.https://doi.org/10.1016/j.watres.2018.06.066. 29. Endley S, Lu L, Vega E, Hume ME, Pilla i SD. 2003. Male-specific coliphages as an additional fecal contamination i ndicator for screening fresh carrots. J Food Protection 66:88-93.https://doi.org/10.4315/0362-028X-66.1.88. 30. Kingsley DH, Chen H, Annous BA, Meade GK. 2019. Evaluation of a male-specific DNA coliphage persistence within eastern oysters (Crassostrea virginica).Food Environ Virol 11:120-125. https://doi .org/10.1007/s12560-019-09376-2. 31. Jofre J, Lucena F , Blanch AR, Muniesa M. 2016. Coliphages as model organisms in the characterization and management of water resources.Water 8:199. https ://doi.org/10.3390/w8050199. 32. Hsu F-C, Shieh Y-SC, Sobsey MD. 2002. Enteric bacteriophages as poten-tial fecal i ndicators in ground beef and poultry Meat. Journal of Food Pro-tection 65:93-99.https://doi.org/10.4315/0362-028X-65.1.93. 33. Hsu F-C, Shieh Y-SC, van Duin J, Beekwilder MJ, Sobsey MD. 1995. Geno-typing male-specific RNA coliphages by hybridization with oligonucleo-tide probes. Appl Environ Microbiol 61:3960-3966. htt ps ://doi.org/10.1128/aem.61.11.3960-3966.1995. 34. Wolf S, Hewitt J , Rivera-Aban M, Greening GE . 2008. Detection and char-acterization of F + RNA bacteriophages in water and shellfish: application of a multiplex real-t i me reverse transcription PCR. J Virol Methods 149:123-128. https://doi.org/10.1016/j.jviromet.2007.12.012. 35. Xu J, Bjursell MK, Himrod J , Deng S, Carmichael LK, Chiang HC, Hooper LV,Gordon JI. 2003. A genomic view of the human-Bacteroides thetaiotaomicron symbiosis. Science 299:2074-2076. https://doi.org/10.1126/sc i ence.1080029. 36. Yampara-Iquise H, Zheng G, Jones JE, Carson CA. 2008. Use of a Bacter -oides thetaiotaomicron-specific a-1-6, mannanase quantitative PCR to detect human faecal pollution in water. J Appl Microbiol 105:1686-1693.https://doi.org/10.1111/j.1365-2672.2008.03895.X. 37. la Rosa G, Pourshaban M, laconell i M, Musc i l lo M. 2010. Quantitative real -time PCR of enteric viruses in influent and effluent samples from waste-water t reatment plants in Italy. Ann Ist Super Sanita 46:266-273. https://doi.org/10.4415/ANN _10_03_07. 38. Ahmed SM, H a l l AJ , Robinson AE, Verhoef L , Premkumar P, Parashar UD,Koopmans M, Lopman BA. 2014. Global prevalence of norovirus in cases of gastroenteri t is: a systematic review and meta-analysis. Lancet Infect Dis 14:725-730. https://doi .org/10.1016/S1473-3099(14)70767-4. 39. Reay D. 2019. Climate-smart cod. Climate-Smart Food 165-175. 40. Dashti AS, Ghahremani P, Hashempoor T , Karimi A. 2016. Molecular epi-demiology of enteric adenovirus gastroenterit i s i n under-five-year-old children i n Iran. Gastroenterol Res Pract 2016:2045697.https://doi.org/10.1155/2016/2045697. 41. Brinkman NE, Fout GS, Keely SP. 2017. Retrospective surveillance of wastewater to examine seasonal dynamics of enterovirus i nfections. mSphere 2. https://doi .org/10.1128/mSphere.00099-17. 42. Hewit t J , Leonard M, Greening GE, Lewis GD. 2011. Influence of waste-water treatment process and the population size on human virus profiles in wastewater. Water Res 45:6267-6276. https://doi.org/10.1016/j .watres .2011.09.029. 43. Nasser AM,Vaizel-Ohayon D, Aharoni A, Revhun M. 2012. Prevalence and fate of Giardia cysts in wastewater treatment plants. J Appl Microbiol 113:477-484.https://doi.org/10.1111/j.1365-2672.2012.05335.X. 44. Kitajima M, Iker BC, Pepper IL , Gerba CP. 2014. Relative abundance and treatment reduction of viruses during wastewater treatment processes -identi f ication of potential viral indicators. Sci Total Environ 488-489:290-296.https://doi.org/10.1016/j .scitotenv.2014.04.087. 45. Tandukar S, Sherchan SP, Haramoto E. 2020. Reduction of human enteric and indicator viruses at a wastewater treatment plant in Southern Louisiana, USA.Food Environ Virol 12:260-263. https://doi.org/10.1007/s12560-020-09433-1. 46. Qiu Y, Lee BE, Neumann N, Ashbolt N, Craik S, Maal -Bared R, Pang XL.2015. Assessment of human virus removal during municipal wastewater treat-ment in Edmonton, Canada. J Appl Microbiol 119:1729-1739. https://doi.org/10.1111/jam.12971. 47. Rose JB, Zhou X, Gri f fin DW, Paul JH. 1997. Comparison of PCR and plaque assay for detection and enumeration of col i phage in polluted marine waters. Appl Environ Microbiol 63:4564-4566. https://doi.org/10.1128/aem.63.11.4564-4566.1997. 48. Edelman DC, Barletta J .2003. Real-time PCR provides improved detect i on and t iter determination of bacteriophage 35. 49. Rocha J , Fernandes T, Riquelme M v, Zhu N, Pruden A, Manaia CM. 2019.Comparison of culture-and quantitative PCR-based indicators of antibi-otic resistance in wastewater, recycled water, and tap water. Int J Environ Res Public Health 16. 50. Kirs M, Smith DC. 2007. Multiplex quantitative real -time reverse transcrip-tase PCR for F +-specific RNA coliphages: a method for use in microbial source tracking. Appl Environ Microbiol 73:808-814. https://doi.org/10.1128/A E M.00399-06. 51. Zaneti RN, Girardi V, Spilki FR, Mena K, Westphalen APC, da Costa Colares ER, Pozzebon AG, Etchepare RG.2021. Quant i tat i ve microbial risk assess-ment of SARS-CoV-2 for workers in wastewater treatment plants. Sci Total Environ 754:142163.https://doi.org/10.1016/j.scitotenv.2020.142163. 52. Carducci A, Donzell i G, Cioni L, Federigi l, Lombardi R, Verani M. 2018.Quantitat i ve microbial r i sk assessment for workers exposed to bioaerosol in wastewater treatment plants aimed at t he choice and setup of safety measures.Int J Environ Res Public Health 15. https://doi.org/10.3390/i jerph15071490. 53. Francy DS, Stelzer EA, Bushon RN, Brady AMG, Mailot BE, Spencer SK,Borchardt MA, E l ber AG, Riddell KR, Gellner TM. 2011. Quantifying viruses and bacteria in wastewater—Results, interpretation methods, and quality control .Scientific Investigations Report https://doi.org/10.3133/SIR20115150. 54. Lipczynska-Kochany E, Kochany J. 2009. Effect of humate on biological treatment of wastewater containing heavy metals. Chemosphere 77:279-284. https://doi.org/10.1016/j.chemosphere.2009.07.036. 55. Law Y, Jacobsen GE, Smith AM, Yuan Z, Lant P. 2013.Foss i l org a nic carbon in wastewater and its fate i n treatment plants. Water Res 47:5270-5281.https://doi.org/10.1016/j.watres.2013.06.002. 56.. APHA. 2005. Federation, W. E. & American Public Health Assoc i ation (APHA) (2005) Standard methods for the examination of water and wastewater .American Publi c Health Association (APHA), Washington. 57. Bates RG, Vega CA, White DR. 1978. Standards for pH measurements in isotonic saline media of ionic strengthl=0.16. Method s of Surface Analy -sis . Elsevier Publishing Co. 58. APHA. 1995. APHA -American Public Health Association. “Standard meth-ods for the examination for water and wastewater (p211-281)."Washing-ton, DC: Byrd Prepress Springfield. 59. Pi t Wel l . STANDARD COD. 1983. Chemical Brittania 19:907. 60. Smith CM, Hi l l VR. 2009. Dead-end hollow-fiber ultrafiltration for recovery of diverse microbes from water. Appl Environ Microbiol 75:5284-5289.https://doi .org/10.1128/AEM.00456-09. 61. Prado T, de Castro Bruni A, Barbosa MRF, Garcia SC, de Jesus Melo AM Sato MIZ. 2019. Performance of wastewater reclamation systems in en-teric virus removal. Sci Tota l Env i ron 678:33-42. https://doi.org/10.1016/j .scitotenv.2019.04.435.
关闭-
1/13

-
2/13

还剩11页未读,是否继续阅读?
继续免费阅读全文产品配置单
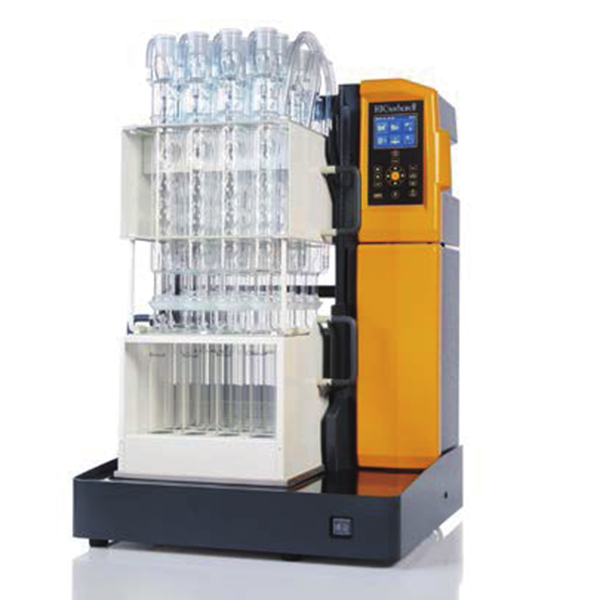
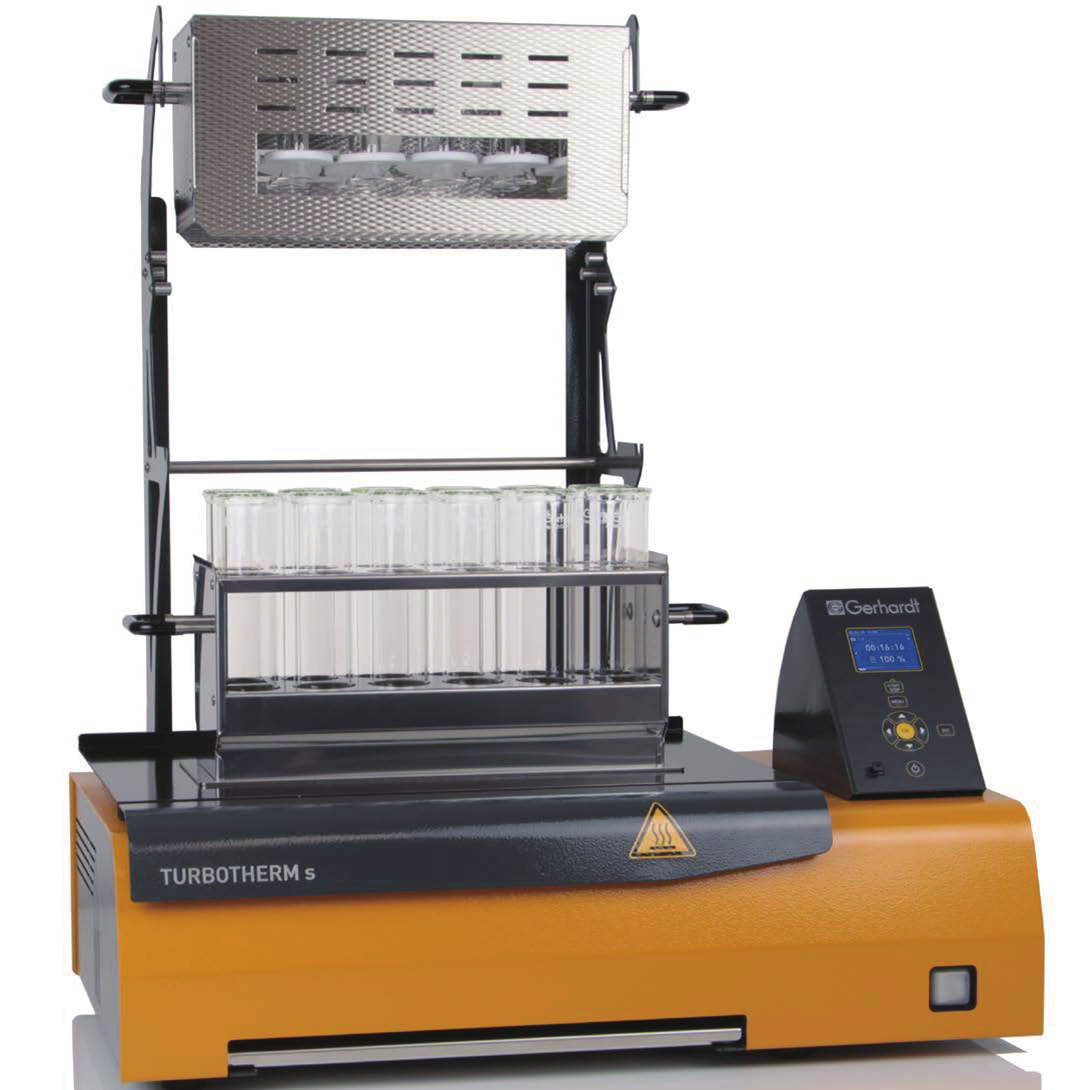
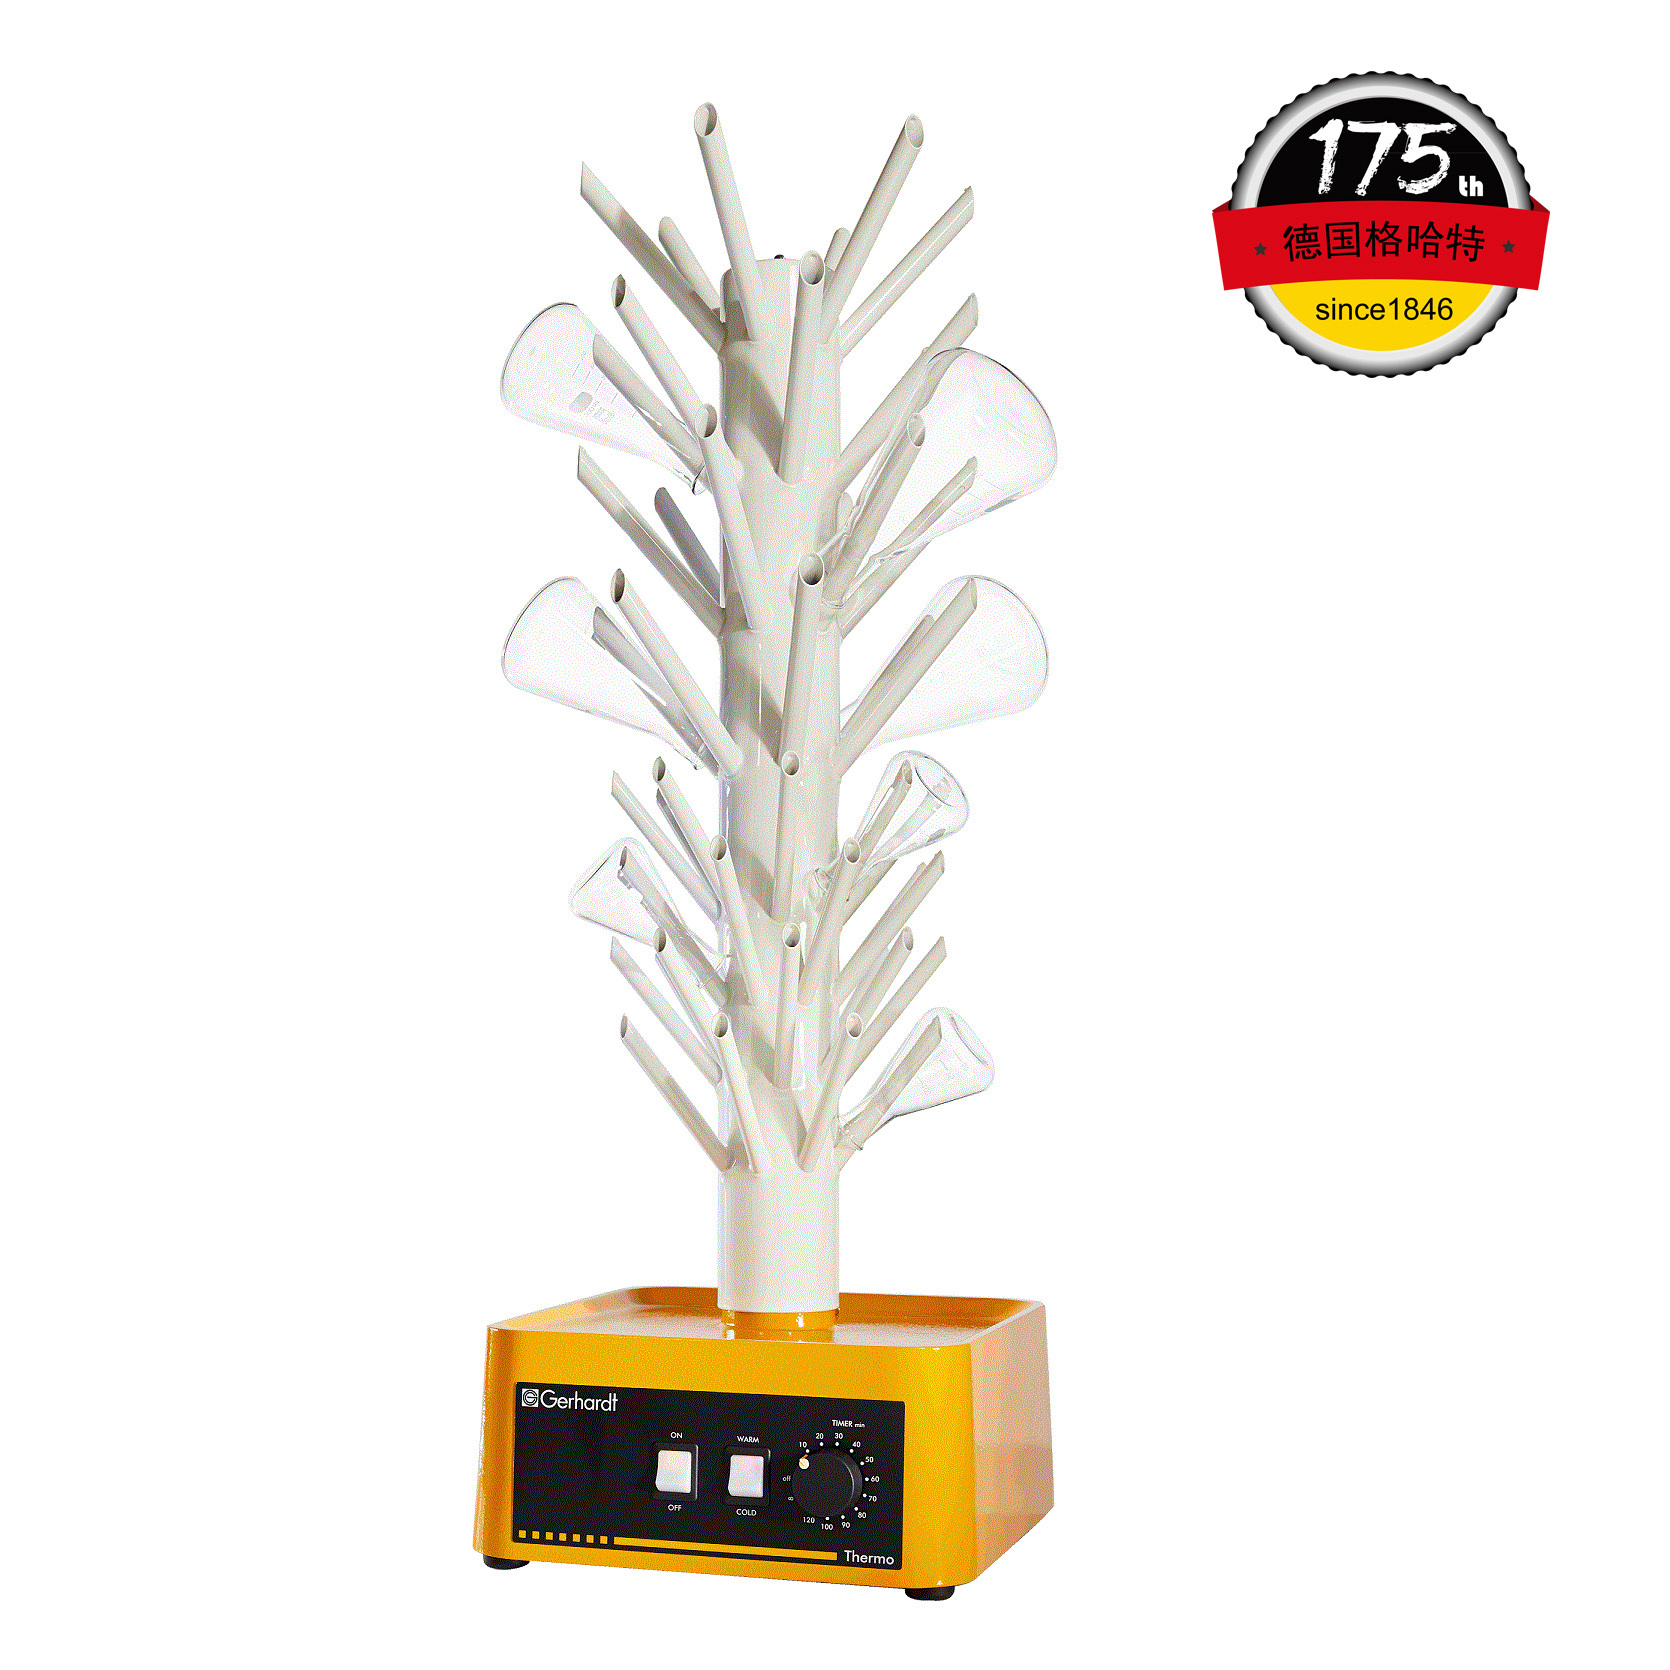
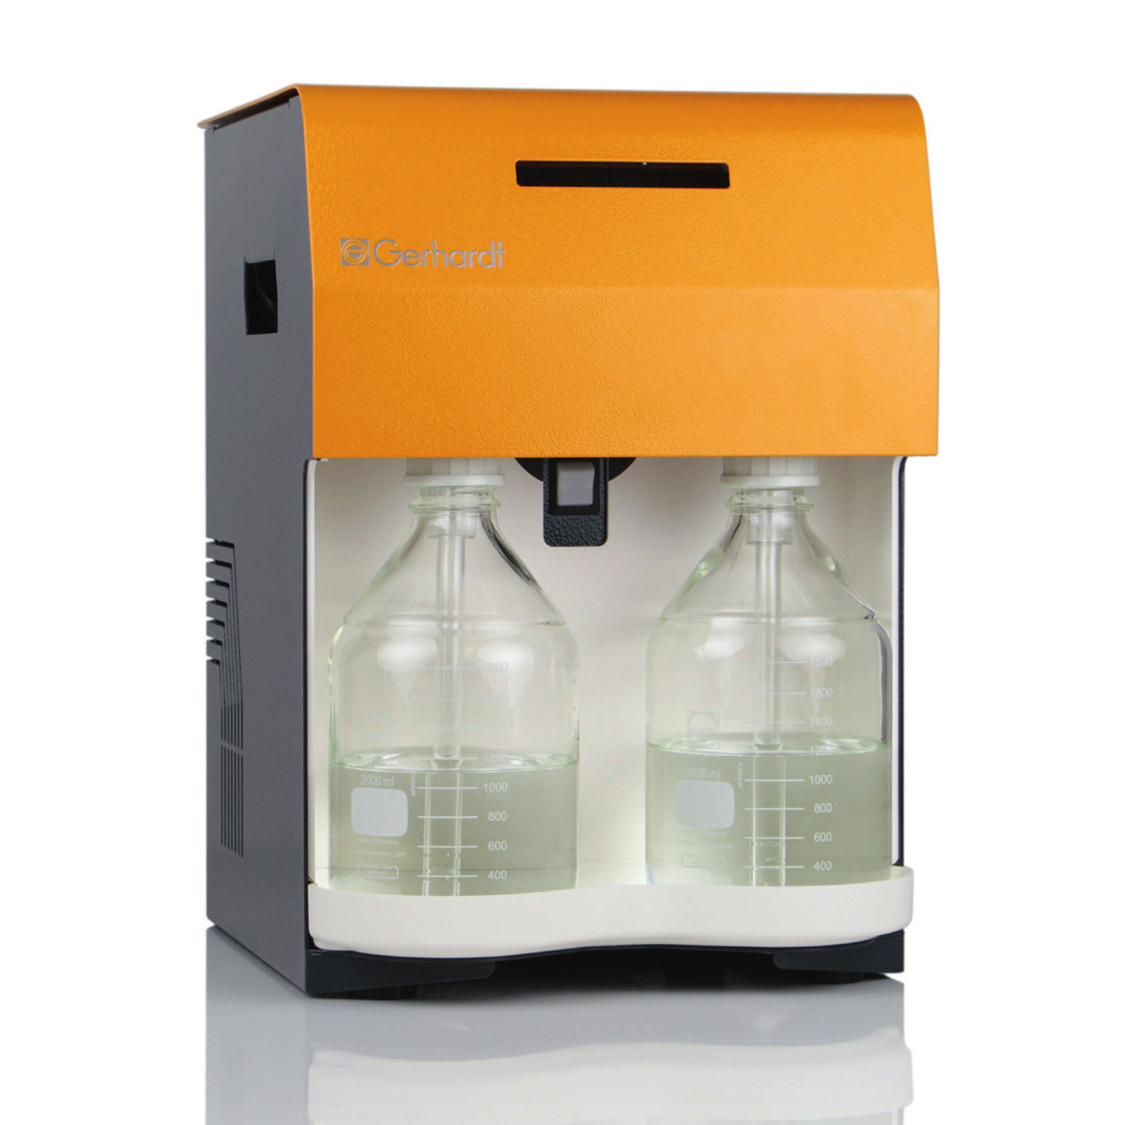
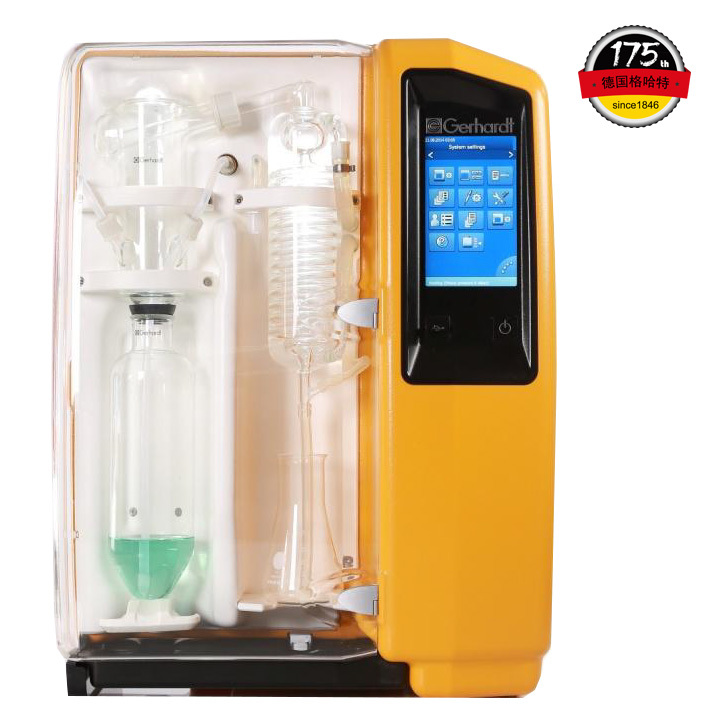

中国格哈特为您提供《三家废水处理厂27个废水样品化学需氧量(COD)和氮含量的检测》,该方案主要用于废水中有机物综合指标检测,参考标准《HJ 828-2017 水质 化学需氧量的测定 重铬酸盐法》,《三家废水处理厂27个废水样品化学需氧量(COD)和氮含量的检测》用到的仪器有格哈特化学需氧量COD消解仪CSB-L 20s、格哈特红外加热消解快速消化系统TTs125、格哈特快速干燥仪STL56、格哈特维克松废气实验室废物处理系统涤气VS、格哈特自动凯氏定氮仪VAPODEST 200、德国加液器MM。
我要纠错


相关方案
 咨询
咨询