方案详情文
智能文字提取功能测试中
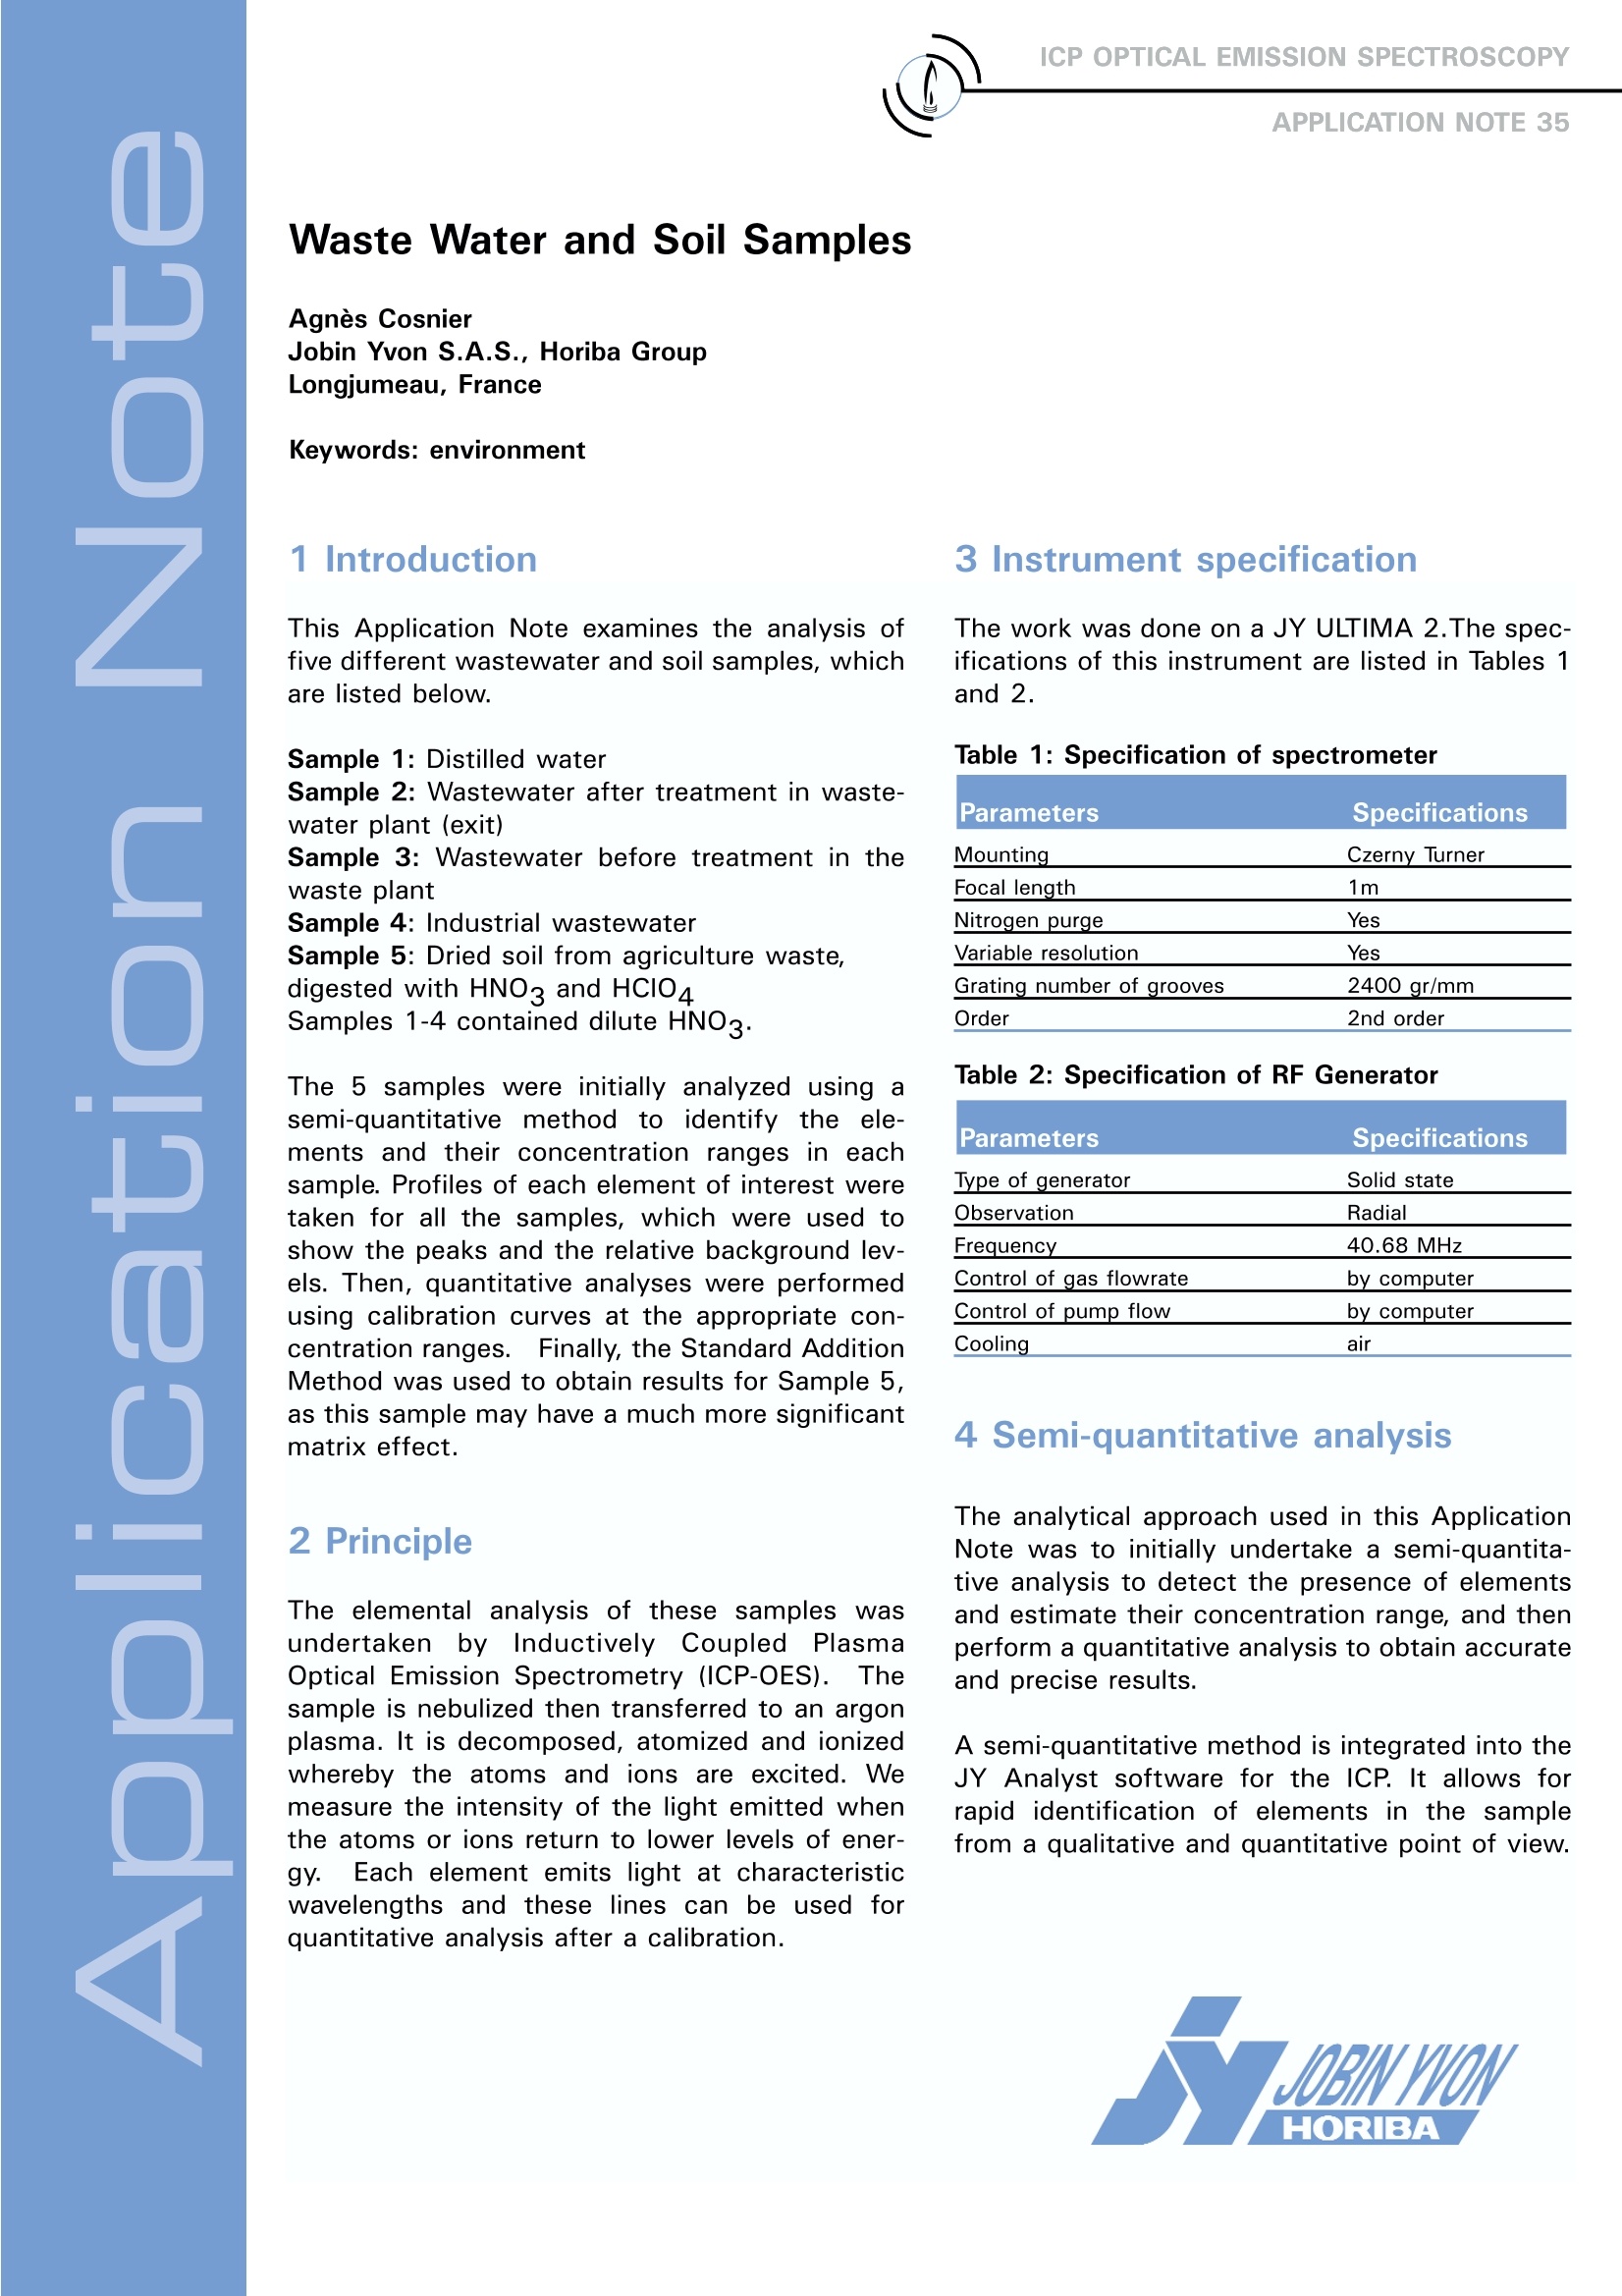
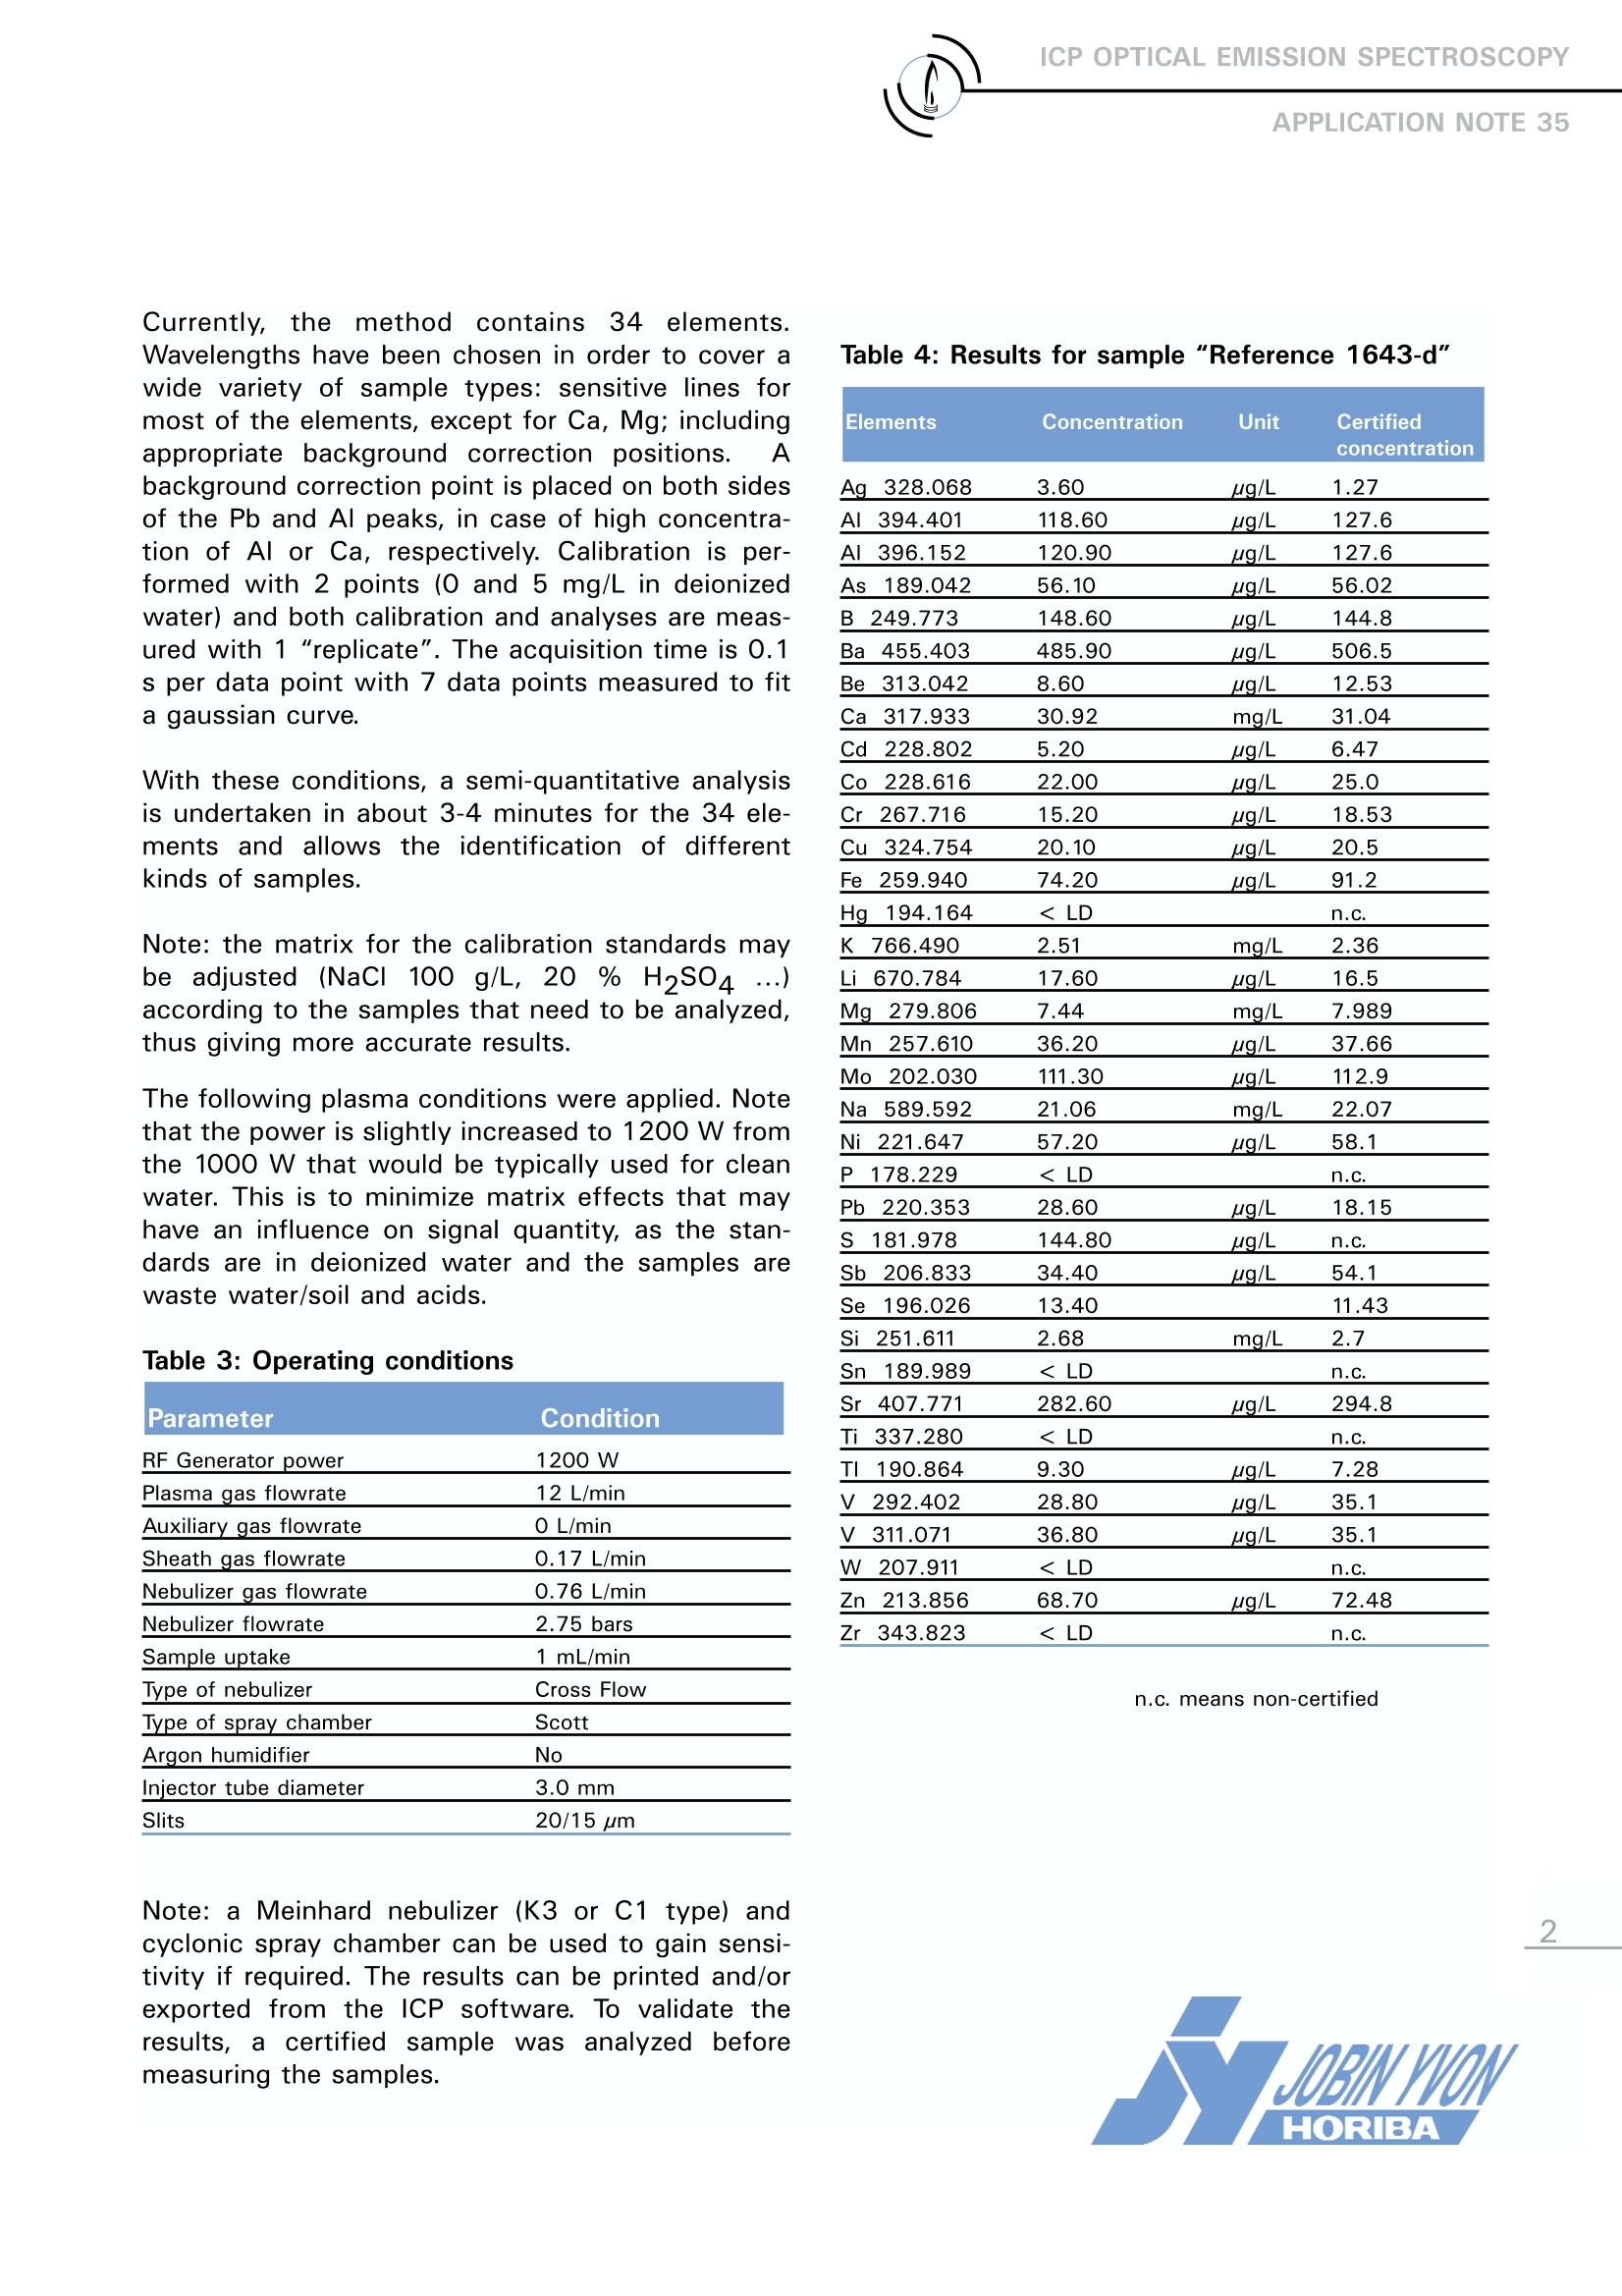
ICP OPTICAL EMISSION SPECTROSCOPYAPPLICATION NOTE 35 Waste Water and Soil Samples Agnes Cosnier Jobin Yvon S.A.S., Horiba Group Longjumeau, France Keywords: environment 1 Introduction This Application Note examines the analysis offive different wastewater and soil samples, whichare listed below. Sample 1: Distilled water Sample 2: Wastewater after treatment in waste-water plant (exit) Sample 3: Wastewater before treatment in thewaste plant Sample 4: Industrial wastewater Sample 5: Dried soil from agriculture waste,digested with HNO3 and HCIO4 Samples 1-4 contained dilute HNO3. The 5 samples were initially analyzed using asemi-quantitative method to identify the ele-ments and their concentration ranges in eachsample. Profiles of each element of interest weretaken for all the samples, which were used toshow the peaks and the relative background lev-els. Then, quantitative analyses were performedusing calibration curves at the appropriate con-centration ranges. FFinally, the Standard AdditionMethod was used to obtain results for Sample 5,as this sample may have a much more significantmatrix effect. 2 Principle The elemental analysis of these samples wasundertakenby Inductively Coupled】PlasmaOptical Emission Spectrometry (ICP-OES)..TThesample is nebulized then transferred to an argonplasma. It is decomposed, atomized and ionizedwhereby the atoms and ions are excited. Wemeasure the intensity of the light emitted whenthe atoms or ions return to lower levels of ener-gy. Each element emits light at characteristicwavelengths and these lines can be used forquantitative analysis after a calibration. 3 Instrument specification The work was done on a JY ULTIMA 2.The spec-ifications of this instrument are listed in Tables 1and 2. Table 1: Specification of spectrometer Parameters Specifications Mounting Czerny Turner Focal length 1m Nitrogen purge Yes Variable resolution Yes Grating number of grooves 2400 gr/mm 2nd order Table 2: Specification of RF Generator Parameters Specifications Type of generator Solid state Observation Radial Frequency 40.68 MHz Control of gas flowrate by computer Control of pump flow bycomputer Cooling air 4 Semi-quantitative analysis The analytical approach used in this ApplicationNote was to initially undertake a semi-quantita-tive analysis to detect the presence of elementsand estimate their concentration range, and thenperform a quantitative analysis to obtain accurateand precise results. A semi-quantitative method is integrated into theJY Analyst software for the ICP. It allows forrapid identification of elements in the samplefrom a qualitative and quantitative point of view. Currently,, 1the method contains 334elements.Wavelengths have been chosen in order to cover awide variety of sample types: sensitive lines formost of the elements, except for Ca, Mg;includingappropriate background correction positions. Abackground correction point is placed on both sidesof the Pb and Al peaks, in case of high concentra-tion of Al or Ca, respectively. Calibration is per-formed with 2 points (0 and 5 mg/L in deionizedwater) and both calibration and analyses are meas-ured with 1 "replicate". The acquisition time is 0.1s per data point with 7 data points measured to fita gaussian curve. With these conditions, a semi-quantitative analysisis undertaken in about 3-4 minutes for the 34 ele-ments and allows the identification of differentkinds of samples. Note: the matrix for the calibration standards maybe adjusted(NaCl 100g/L, 20% H2SO4...)according to the samples that need to be analyzed,thus giving more accurate results. The following plasma conditions were applied.Notethat the power is slightly increased to 1200 W fromthe 1000 W that would be typically used for cleanwater. This is to minimize matrix effects that mayhave an influence on signal quantity, as the stan-dards are in deionized water and the samples arewaste water/soil and acids. Table 3: Operating conditions Parameter Condition RF Generator power 1200 W Plasma gas flowrate 12 L/min Auxiliary gas flowrate O L/min Sheath gas flowrate 0.17 L/min Nebulizer gas flowrate 0.76 L/min Nebulizer flowrate 2.75 bars Sample uptake 1 mL/min Type of nebulizer Cross Flow Type of spray chamber Scott Argon humidifier No Injector tube diameter 3.0 mm Slits 20/15 um Note: a Meinhard nebulizer (K3 or C1 type) andcyclonic spray chamber can be used to gain sensi-tivity if required. The results can be printed and/orexported from the ICP software. To validate theresults, a certified sample was analyzed beforemeasuring the samples. Table 4: Results for sample "Reference 1643-d" n.c. means non-certified Table 5: Results for various samples 5 Quantitative analysis Using the results obtained from the semi-quantita-tive method, several standards were prepared in theappropriate concentration range for each element: Table 6: Standard concentration Element Standards (mg/L) 0 1 2 3 4 (5 6 7 Al 0 0.02 0.050.1 1 10 37.3 150 As 0 0.02 0.050.1 1 10 B 0 0.02 0.050.1 1 10 Cd 0.02 0.05)0.1 1 10 Cr 0.02 0.050.1 1 10 Cu 0 0.02 0.05 0.1 1 10 Fe 0.02 0.050.1 1 10 37.3 150 Mn 0 0.02 0.050.1 1 10 Ni 0 0.02 0.050.1 1 10 Pb 0 0.02 0.050.1 1 10 Se 0 0.02 0.05i0.1 1 10 Zn 0.02 0.05 0.1 1 10 The plasma parameters are shown in Table 7. Table 7: Operating conditions Parameter Condition RF Generator power 1100 W Plasma gas flowrate 12 L/min Auxiliary gas flowrate 0 L/min Sheath gas flowrate 0.17 L/min Nebulizer gas flowrate 0.63 L/min Nebulizer flowrate 2.84 bars Sample uptake 1 mL/min Type of nebulizer Meihnard C1 Type of spray chamber Cyclonic Argon humidifier No Injector tube diameter 3.0 mm Slits 20/15 um The combination of a Meinhard C1 nebulizer andcyclonic Spray Chamber for sample introductionwas used for optimum sensitivity and detection lim-its. Note: sample number 5 was analyzed using theStandard Addition Method, as there may be a moresignificant matrix effect in this sample, compared tothe first four, due to the major elements (650 mg/lof Ca and acids). Profiles of several samples for Cd are shown belowin Figure 1. This demonstrates that the matrix is dif-ferent because the spectral background is raised insample 5. From this calibration, other samples with similarmatrix can be analyzed. The methodology of the Standard Addition Method(S.A.M.)is as follows: . Estimate the approximate concentration for eachelement of interest (using a rapid semi-quantitativemethod) · Prepare a stock solution with all the elements ofinterest and with appropriate concentrations (2-5times each element concentration). · Prepare at least 3 standards: spike the samplewith increasing concentrations; then we have theunknown sample which is declared as our blank(standard 0) and 3 standards in the same matrix.Four standards at least in total are recommended. · Prepare the method in the software, using back-ground correction for baseline correction. Whencreating the method, it can be set up as a StandardAddition Method · Run the calibration: the results will be given underthe Standard Addition Tab after running the calibra-tion. Alternatively, if the method was not set up asa Standard Addition, the intercept (or BEC) of eachcurve corresponds to the concentration of the ele-ment in the sample The global report of the quantitative analyses isshown below in Tables 8-13. The following abbre-viations are used: Conc.: from quantitative method; Conc.(S.Q.): from semi-quantitative method; Table 8: Results for Sample 1 Line Net Intensity Conc SD Unit RSD(%) Conc. (S.Q.) Al 396.152 19691.33 0.263 0.00459 mg/L 1.74 0.271 As 189.042 52.58 < LD mg/L < LD B 249.773 20 185.33 0.0472 0.00071 mg/L 1.50 0.045 Cd 228.802 318.65
-
1/7
-
2/7
还剩5页未读,是否继续阅读?
继续免费阅读全文产品配置单

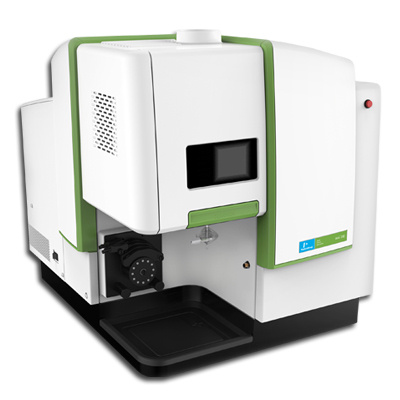
HORIBA(中国)为您提供《土壤中(类)金属及其化合物检测方案 》,该方案主要用于废水中(类)金属及其化合物检测,参考标准《暂无》,《土壤中(类)金属及其化合物检测方案 》用到的仪器有HORIBA Ultima Expert高性能ICP光谱仪。
我要纠错
推荐专场
相关方案
 咨询
咨询