
方案详情文
智能文字提取功能测试中
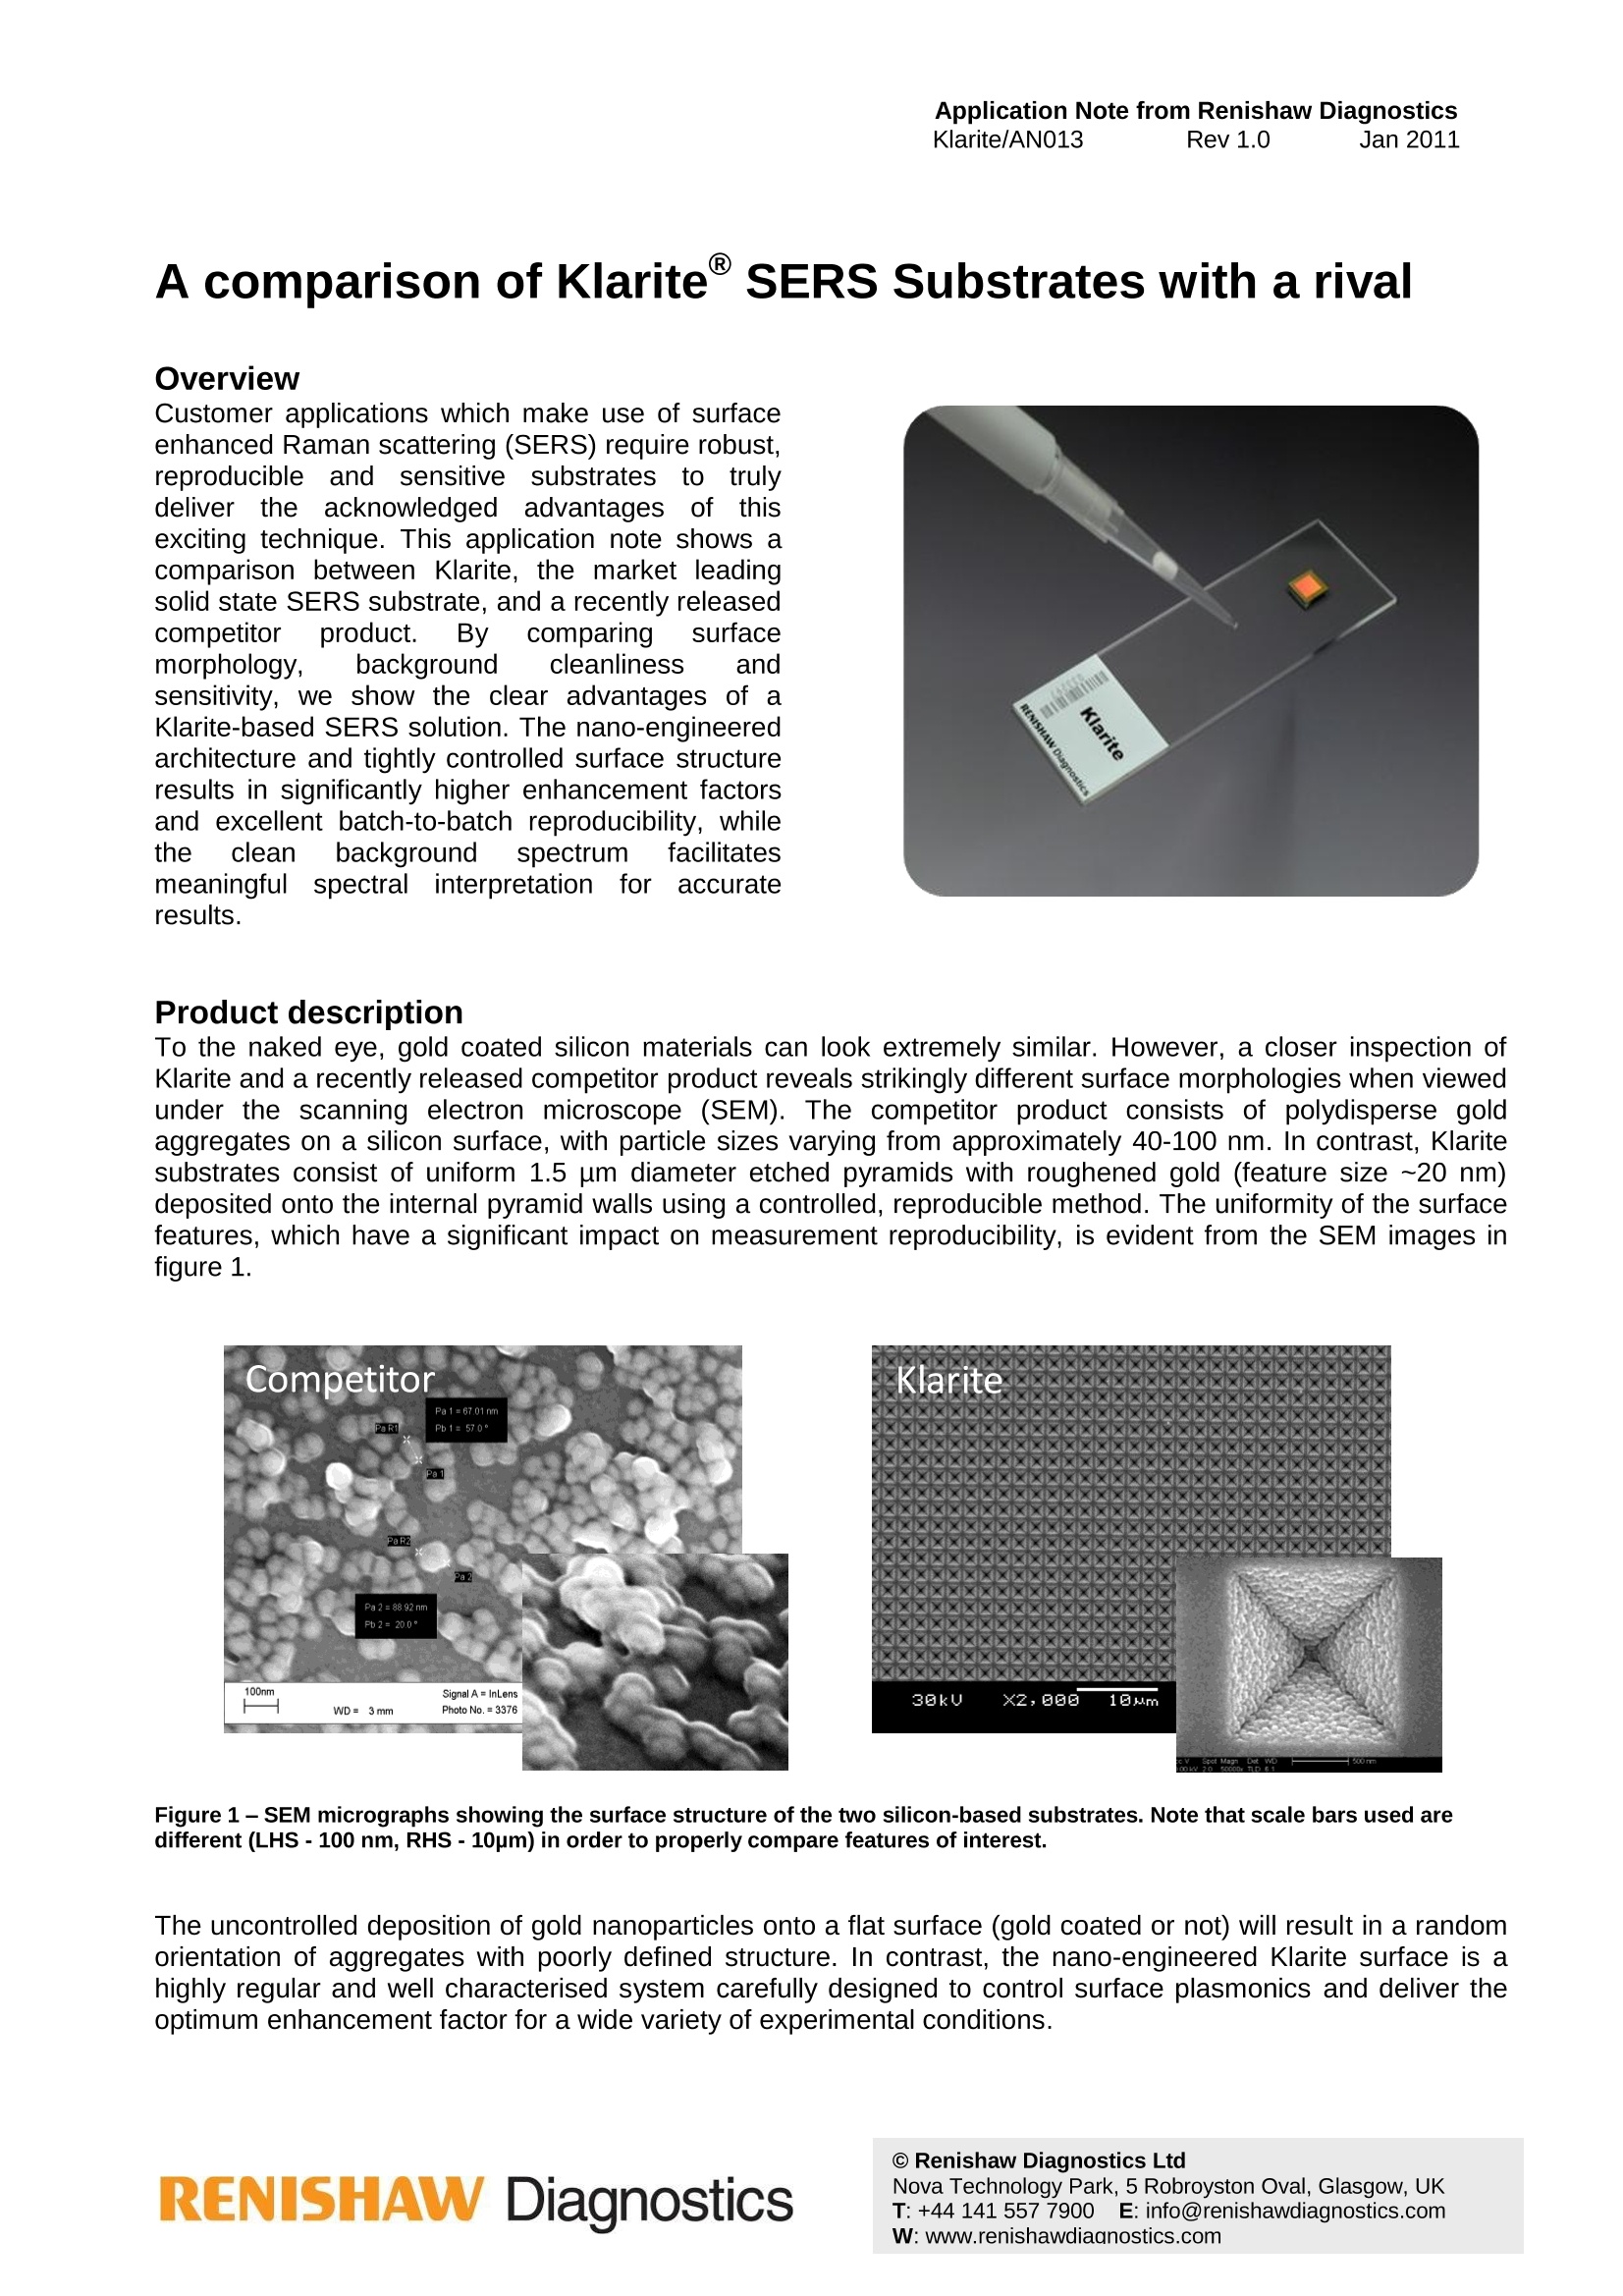
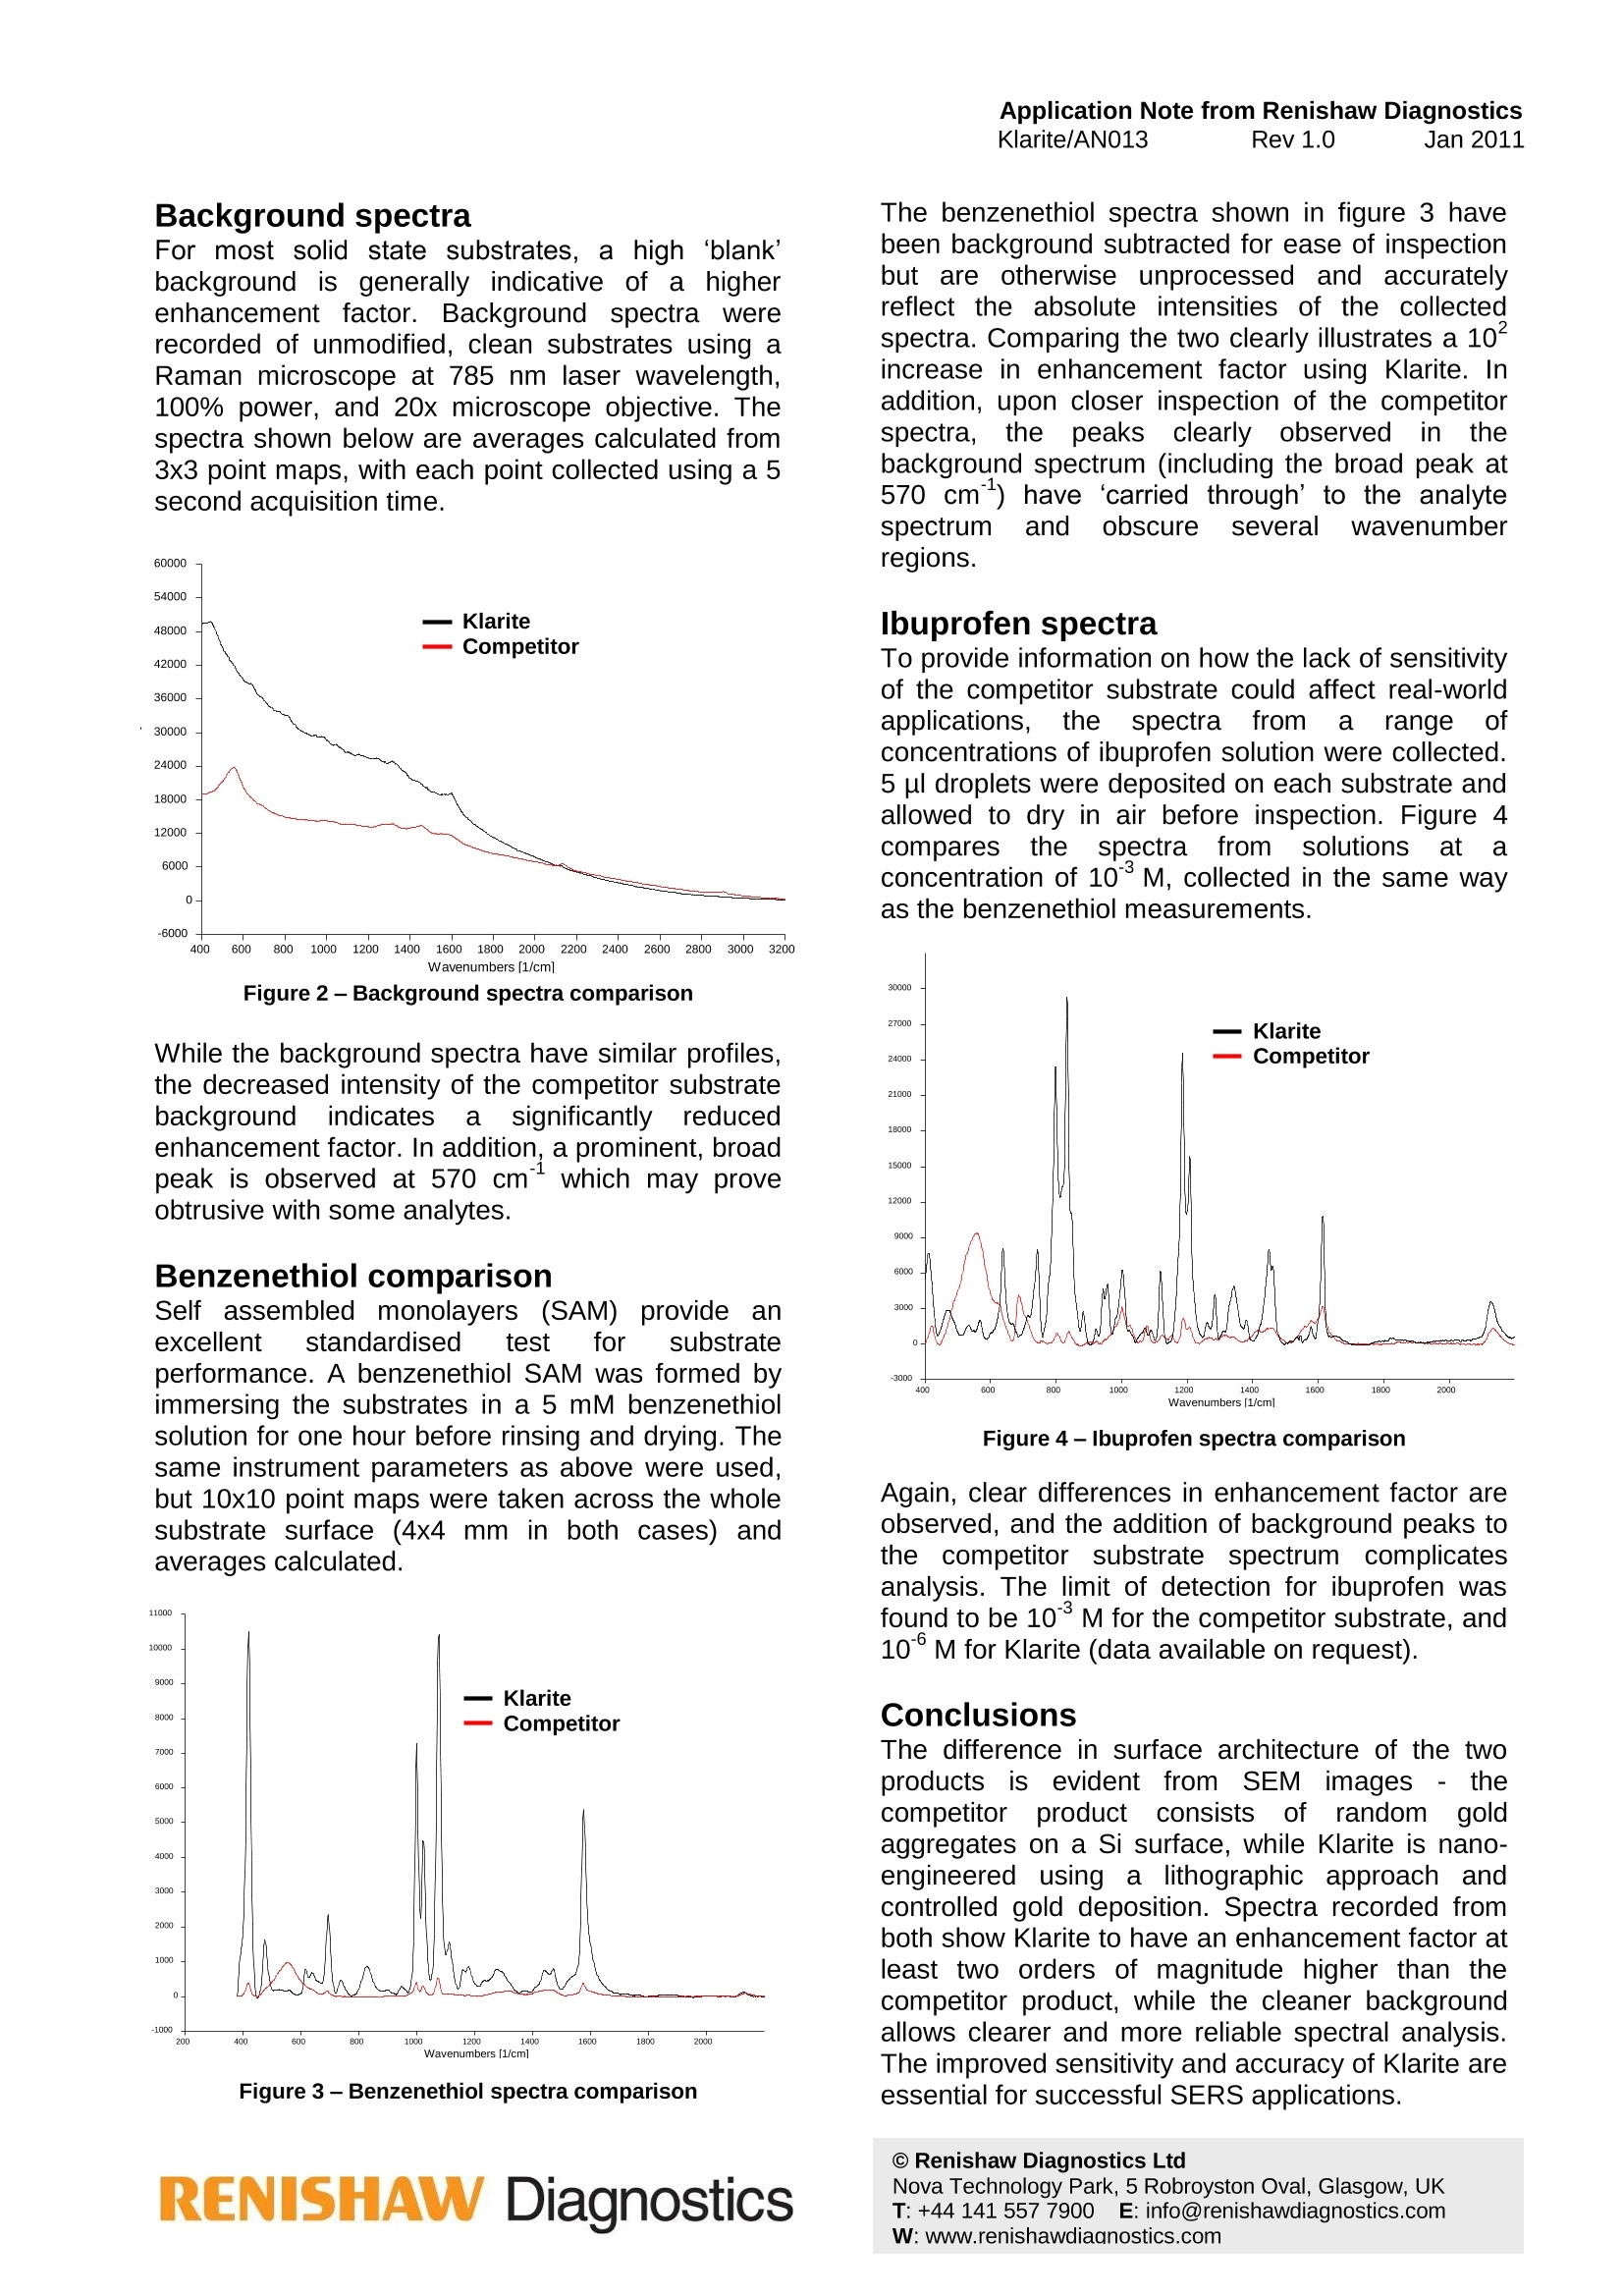
Application Note from Renishaw DiagnosticsKlarite/AN013 Rev 1.0 Jan 2011 A comparison of KlariteSERS Substrates with a rival Overview Customer applications which make use of surfaceenhanced Raman scattering (SERS) require robust,reproducibleandsensitiveesubstratestto trulydeliver theacknowledgedadvantages ofthisexciting technique. This application note shows acomparison between Klarite, the market leadingsolid state SERS substrate, and a recently releasedcompetitorpproductL..By comparing surfacemorphology, background cleanliness andsensitivity, we show the clear advantages of aKlarite-based SERS solution. The nano-engineeredarchitecture and tightly controlled surface structureresults in significantly higher enhancement factorsand excellent batch-to-batch reproducibility, whiletheCclean background spectrum facilitatesmeaningfulspectralinterpretation foraccurateresults. Product description To the naked eye, gold coated silicon materials can look extremely similar. However, a closer inspection ofKlarite and a recently released competitor product reveals strikingly different surface morphologies when viewedunder the scanning electron microscope (SEM). The competitor product consists of polydisperse goldaggregates on a silicon surface, with particle sizes varying from approximately 40-100 nm. In contrast, Klaritesubstrates consist of uniform 1.5 pm diameter etched pyramids with roughened gold (feature size ~20 nm)deposited onto the internal pyramid walls using a controlled, reproducible method. The uniformity of the surfacefeatures, which have a significant impact on measurement reproducibility, is evident from the SEM images infigure 1. Figure 1 - SEM micrographs showing the surface structure of the two silicon-based substrates. Note that scale bars used aredifferent (LHS-100 nm, RHS-10pm) in order to properly compare features of interest. Background spectra For most solid state substrates, a high ‘blank’background is generally indicative of a higherenhancement factor. Background spectraawererecorded of unmodified, clean substrates using aRaman microscope at 785 nm laser wavelength,100% power, and 20x microscope objective. Thespectra shown below are averages calculated from3x3 point maps, with each point collected using a 5second acquisition time. Figure 2-Background spectra comparison While the background spectra have similar profiles,the decreased intensity of the competitor substratebackgroundindicatesasignificantly reducedenhancement factor. In addition, a prominent, broadpeak is observed at 570cmwhich may proveobtrusive with some analytes. Benzenethiol comparison Self assembled monolayers (SAM) provide anexcellent standardised test for substrateperformance. A benzenethiol SAM was formed bvimmersing the substrates in a 5 mM benzenethiolsolution for one hour before rinsing and drying. Thesame instrument parameters as above were used,but 10x10 point maps were taken across the wholesubstrate surface (4x4mmin both cases) andaverages calculated. 110 Figure 3- Benzenethiol spectra comparison RENISHAW Diagnostics The benzenethiol spectra shown in figure 3 havebeen background subtracted for ease of inspectionbut are otherwise unprocessed and accuratelyreflect the absolute intensities of the collectedspectra. Comparing the two clearly illustrates a 10increase in enhancement factor using Klarite. Inaddition, upon closer inspection of the competitorspectra, the peaksclearly observed in thebackground spectrum (including the broad peak at570 cm") have carried through’ to the analytespectrum and obscure several wavenumberregions. Ibuprofen spectra To provide information on how the lack of sensitivityof the competitor substrate could affect real-worldapplications,the spectra froma range ofconcentrations of ibuprofen solution were collected.5 pl droplets were deposited on each substrate andallowed to dry in air before inspection. Figure 4comparesthe spectra from solutionsat aconcentration of 10~M, collected in the same wayas the benzenethiol measurements. Figure 4-Ibuprofen spectra comparison Again, clear differences in enhancement factor areobserved, and the addition of background peaks tothe competitor substrate spectrum complicatesanalysis. The limit of detection for ibuprofen wasfound to be 10M for the competitor substrate, and10M for Klarite (data available on request). Conclusions The difference in surface architecture of the twoproductsisSeevident from SEMiirmages - thecompetitor product consistsof random goldaggregates on a Si surface, while Klarite is nano-engineered using alithographic approach andcontrolled gold deposition. Spectra recorded fromboth show Klarite to have an enhancement factor atleast two orders of magnitude higher than thecompetitor product, while the cleaner backgroundallows clearer and more reliable spectral analysis.The improved sensitivity and accuracy of Klarite areessential for successful SERS applications. ( Nova Technology Park, 5 Robroyston Oval, Glasgow, UK T: +44 141 557 7900 E: info@renishawdiagnostics.com ) C Renishaw Diagnostics LtdNova Technology Park, Robroyston Oval, Glasgow, UKT: +E: info@renishawdiagnostics.comW: www.renishawdiaqnostics.comRENISHAW Diaqnostics O Renishaw Diagnostics Ltd
关闭-
1/2
-
2/2
产品配置单
杭州谱镭光电技术有限公司为您提供《Klarite SERS 芯片跟其他产品性能对比》,该方案主要用于其他中null检测,参考标准《暂无》,《Klarite SERS 芯片跟其他产品性能对比》用到的仪器有null。
我要纠错
相关方案
 咨询
咨询