十八烷基三氯硅烷,OTS,单层膜改性熔融石英中表面水分子结构,pH值相关性,和频光谱(SFG)研究检测方案(其它光谱仪)
检测样品 其他
检测项目 表面水分子结构,pH值相关性,和频光谱(SFG)研究

 金牌会员
752 篇解决方案
金牌会员
752 篇解决方案
方案详情文
智能文字提取功能测试中
Sum frequency generation (SFG) study of the pH-dependent waterstructure on a fused quartz surface modified by anoctadecyltrichlorosilane (OTS) monolayer Shen Ye,t Satoshi Nihonyanagi and Kohei Uosaki* Division of Chemistry, Graduate School of Science, Hokkaido University,Sapporo,060-0810,Japan. E-mail: uosaki@PCL.sci.hokudai.ac.jp; Fax: + 81-11-706-3440; Tel:+81-11-706-3812 Received 20th February 2001, Accepted 25th May 2001 First published as an Advance Article on the web 29th June 2001 The interface-sensitive spectroscopic method, sum frequency generation (SFG), has been used to investigate theinterfacial water structure on a fused quartz surface modified by an octadecyltrichlorosilane (OTS)self-assembled monolayer in phosphate buffered solutions at various pHs. The experimental resultsdemonstrate that the water molecules at the quartz/OTS surface flip while the water molecules at the OTSsurface maintain their orientation when the solution pH is changed from neutral to acidic. The results showthat most of the silanol groups still exist on the fused quartz surface even after a silane coupling reaction ofOTS under the reported experimental conditions. Introduction Interfacial water molecules play prominent roles in manyphysical, chemical and biological processes. Although manytheoretical studies on the structure of water molecules atvarious interfaces are available, most of the experimentalinvestigations on water structure have been carried out mainlyin the vapor or bulk aqueous phase1-3 due to the lack of aneffective experimental probe for interfacial study. Over thepast decades, many spectroscopic techniques such as surfaceenhanced Raman spectroscopy (SERS),4-6 surface infraredspectroscopy’and X-ray diffraction have been used to inves-tigate the interfacial water structure. However, these tech-niques have limitations with respect to their surface selectivityor applicable samples. Recently, sum frequency generation (SFG) spectroscopy hasbeen widely employed to study the structure of water atvarious interfaces, since Shen and coworkers first applied thisnonlinear optical method to the investigation of water struc-ture at the air/water interface. They observed the stretchingvibration modes of hydrogen bonding and dangling OHgroups of water molecules at the air/water interface by in situSFG measurement. Gragson et al. examined water structureat the air/water and water/CCl interfaces in detail andshowed that the interfacial water molecules were highlyordered when charged surfactants were included in the solu-tion.10-12 Shultz et al. investigated water structure at theinterface between air and a number of aqueous acid and saltsolutions. They found that the SFG intensity of hydrogen-bonded OH stretching in an acidic solution is higher than thatin the corresponding salt solution and proposed a doublelayer model to interpret these behaviors.13,14 Recent theoreti-cal analyses of infrared15 and SFG spectroscopy16 at air/water interfaces are inn iquantitative agreement with t:theexperimental observations. ( t Present a ddress: C atalysis R esearch Center, Hokkaido Uni v ersity,Sapporo 060-0811, Japan. ) SFG measurements have also been used to study the struc-ture of water at the solid/solution interface. Du et al. reportedthe first in situ SFG spectrum of water molecules on the fusedquartz/water interface.17-19 They observed that the waterstructure at quartz/solution interfaces depended on the solu-tion pH. They found that the SFG intensity of hydrogen-bonded OH stretching was enhanced in an alkaline solutiondue to the surface charge of the deprotonated silanol groupson the substrate surface. When the fused quartz surface wasmodified by a self-assembled monolayer (SAM) of octadecyl-trichlorosilane (OTS), a sharp peak was observed at 3680cm-1 at the quartz/water interface, indicating the existence ofOH groups without the hydrogen bond. The position andshape of the OH stretching bands of the interfacial water mol-ecules at the OTS surface closely resemble that of a hexagonalice surface in air, confirming that interfacial water moleculesare aligned in a well-ordered structure as a result of a hydro-phobic effect. Structural information about water molecules in contactwith SAMs with different headgroups is essential in order tounderstand many chemical and biological processes and is stillvery limited. Recently, we carried out SFG studies of thewater structure at a fused quartz surface modified with amino-terminated SAMs, N-(2-aminoethyl)-3-aminopropylmethoxy-silane (AAS) and 3-aminopropylmethoxysilane (APS), inphosphate buffer solutions of various pHs and ionic strengths,and found that both the terminal amino group and the silanolgroup on the quartz substrate have significant effects on theSFG signals from the interfacial water molecules.20-22However, it was found that AAS or APS monolayers withhigh coverage were difficult to prepare on the fused quartzsurface by the silane coupling reaction. OTS has been knownto form an ideal monolayer on the quartz surface23,24 and isexpected to have no pH effect on the water structure due tothe terminal group. Thus, the SFG study on the water struc-ture at tthe OTS modified quartz/solution interface canprovide essential information in order to understand thestructure of water molecules at the SAM/solution interface. Wavenumber /cm ‘ Fig.11Simulation of SFG spectra using eqn. (1) with two resonancemodes under the following conditions: (a) A1=15,ω1=2900,I1=10, Az=150,ω2=3200,I2=150,XNR=0,16=.中2=0;(b) same as(a) except中2=. Unfortunately, SFG studies of the water structure on the OTSmonolayers have been carried out only in pure water. In this study, we investigated the pH and OTS coverage-dependent structure of water molecules at the fused quartz/OTS/solution interface by in situ SFG measurements. Theory A number of reviews have been published about the theoreti-cal background of SFG and its applications.25-29 SFG is oneof the second-order nonlinear optical processes in which twophotons at frequencies of ω andω2 generate one photon witha sum frequency at ω3=ω+ω,. The second-order nonlin-ear optical processes including SFG are not expected to occurin media with inversion symmetry under the electric dipoleapproximation whereas it is only active at the interfacebetween these media where the inversion symmetry is neces-sarily broken. In the IR-visible SFG measurement, a visiblelaser beam (@vis) and a tunable infrared laser beam (@n) areoverlapped at an interface and the SFG signal is measured byscanning @i while keeping ωvis constant. The SFG intensity(IsFG) is enhanced when ωi is equal to the vibration levels ofthe molecules at the interface. The on dependence of Isee isgiven by, where XR,n XNR, n, A, and I, are second-order noninearsusceptibility corresponding to the resonant component, thenon-resonant component, the phase angle between the reso-nant and the non-resonant contributions and the amplitudeand the damping constant width of the surface vibration mode(n) with frequency ωn, respectively. Thus, one can obtainsurface-specific vibrational spectra at an interface between twophases with inversion symmetry, which cannot be obtainedusing traditional vibrational spectroscopy such as IR andRaman scattering. Since the SFG signal is proportional tox(2)1, the spectralline shape of SFG is affected by interference between the termsin eqn. (1). To fit an SFG spectrum to eqn. (1), one mayassume that all resonance modes are in phase. This meansthat all phase angles (中n) are identical except for a phase shiftof .30,31 Although this assumption is not always valid since phase angles may be different for the different vibrationmodes, it is convenient to discuss the orientation of the surfacemolecule in a qualitative way. Fig. 1 shows a simulated example of the interference effectbetween two resonance modes. The intensities (xnI2el(n) oftwo independent resonance peaks at 2900 cm-(A=15,I=10) and 3200 cm-(42=150,Tz=150) are plotted asdashed lines, and the SFG intensities resulting from the inter-ference of the two peaks are shown by solid lines. The upwardpeaks have a phase angle of 0, while the downward peakshave a phase angle of r. When the two peaks are in phase[中1=中2=0, Fig. 1(a)], the SFG curve shows a smal tail onthe lower wavenumber side of peak 1. When the two peaks areout of phase [中1=0,02=, Fig.1(b)], the SFG intensity islower than that of the original peak on the lower wavenumberside of peak 1 and the valley between peaks 1 and2 is shallo-wer than that of =02=0. As clearly demonstrated in Fig.1, the shape of the SFG spectrum is strongly affected by thephase angle and relative intensity of each component. Therelative phase angle between the two components can bedetermined by deconvoluting the SFG spectrum using eqn.(1). The information of the phase angle can be used to discussthe relative orientation of different molecules at the interface. Experimental 1. Sample preparation A fused quartz prism with a hemi-cylindrical shape (IR Grade,d=25 mm,l=25 mm) was used as the substrate. The quartzprism was thoroughly cleaned by chromic acid solution andthen rinsed several times with Milli-Q water. The solventswere dehydrated by molecular sieves or MgSO4. OTS wasused as received from Shin-Etsu Chemicals. The other chemi-cals were Suprapure reagents from Wako Pure Chemicals andwere 1used without further purification. The OTS mono-layer was constructed by immersing the quartz substratein a 0.1% OTShexadecane/carbon tetrachloride/chloroform=80:12:8 solution24 for 15 min. After beingrinsed in a sonication bath of chloroform, the sample wasbaked at 110°C for 1 h. It is known that the structure andproperties of the OTS monolayers depend on many factorssuch as humidity, temperature and surface state of the quartzsubstrate,24,33-35 and OTS monolayers of various coverageswere obtained under the“same”conditions. This should bedue to the minor difference in the surface condition whichcannot be precisely controlled. The structures of the OTSmonolayers in the present study have been characterized bySFG measurements in air prior to each in situ SFG measure-ment in electrolyte solution. 2.SFG measurement A detailed description of the SFG system used in the presentstudy hasbeengiven elsewhere.20,36,37A picosecondNd : YAG laser (PL2143B, Ekspla) was employed to pumpan optical parametric generation/opticalparametricamplification/difference frequency generation (OPG/OPA/DFG) system, which generates tunable infrared radiation from2.3 to 8.5 um. The second harmonic output (532 nm) from theNd: YAG laser was used as the visible light. The intensities ofthe SFG signals were normalized to those of infrared andvisible beams. Thus, although the SFG intensities are given in“arbitrary units", all of the SFG spectra shown in this paperare comparable in their intensities. The SFG measurements were carried out at room tem-perature (~24°C). The flat face of the quartz prism was incontact with the electrolyte solution and the infrared andvisible beams were incident from the quartz prism side andwere overlapped at the quartz/electrolyte solution interface.2The incident angle of the visible light was about 70°, which isnear the critical angle of total reflection (0。) of quartz/water (72°) so that a strong surface field can be obtained. The inci-dent angle of the infrared light was set at 50°, which is farfrom 0, in order to avoid a large change in the Fresnel factorwhen the IR frequency is scanned in the absorption range ofthe OH stretching vibration of water.26 The polarizations ofSFG, visible and IR lights were s, s and p, respectively. Thispolarization combination (ssp) is sensitive only to the vibra-tional mode normal to the surface of the isotropic media. pH-dependent SFG measurements were carried out in phosphatebuffered solutions of various pHs with a constant ionicstrength (10 mM). The electrolyte solution was introducedinto the in situ SFG cell under a pressure of purified argon gasso that the solution was not exposed to the atmosphere. Results and discussion 1. Structure of OTS monolayer in air Fig. 2 shows an SFG spectrum of a fused quartz modified byan OTS monolayer with full coverage, in the C-H stretchingfrequency region between 2770 and 2990 cm-1. The squaresrepresent the experimentally observed SFG signals. Theresults were fitted to eqn. (1) with various peak components.The solid line corresponds to the best fit, and the four peakcomponents are shown by dashed lines. The two large peaksobserved at 2879 and 2940 cm-1 can be assigned to the C-Hsymmetric stretch (r*) and Fermi resonance between r andthe C-H bending overtone, respectively, of the terminalmethyl (CH) group. The two peaks attributed to the C-Hsymmetric stretch (d*) at 2859 cm-and asymmetric stretch(d-) at 2917 cm- of the methylene (CH) group are veryweak compared to those of the CHs group. The SFG spectrum shown in Fig. 2 closely resembles thepreviously reported SFG spectra of the OTS monolayer inair.38-40 According to these studies, the OTS molecules areoriented with the alkyl chains nearly normal to the surface.Peaks corresponding to the C-H stretching modes of the CH2groups are very weak because OTS molecules in the mono-layer are in an all-trans conformation, where CH, has inver-sion symmetry and is, therefore, SFG inactive. Only theterminal CHs group has non-centrosymmetry and mainlycontributes to the SFG spectrum of the OTS monolayer. Thesame structure has also been confirmed by IR, ellipsometryand X-ray reflectivity.33,34 Thus, it is confirmed that a highlyorganized OTS monolayer with a very low defect density wasformed on the fused quartz surface. Fig. 3 shows the SFG spectrum of a fused quartz modifiedby OTS with a lower coverage in air. In addition to the twopeaks corresponding to the C-H stretching of the terminal Fig.3 SFG spectrum of a fused quartz surface modified by OTSwith lower coverage measured in air. CHs group at 2879 and 2941 cm-, two peaks due to theC-H stretching of the CH2 group were clearly observed at2849 and 2917 cm-1, showing that many gauche defects existin the OTS monolayer of lower coverage. 2. pH dependence of water structure at thequartz/OTS/solution interface The effect of pH on the water structure at the interfacebetween the solution and OTS was examined in phosphatebuffered solutions of various pHs using quartz modified by anOTS monolayer with full coverage. 2.1 Neutral pH solution. Fig. 4 shows an SFG spectrum ofa fused quartz modified by an OTS monolayer with full cover-age measured in a neutral phosphate buffer solution of pH 7in the region between 2800 and 3800 cm-1. Only two largepeaks at 2879 and 2940 cm-1, which are attributed to theCH group, can be observed in the C-H stretching region,indicating that the OTS monolayer maintained a highlyordered structure in the electrolyte solution similar to that inair. Fig. 4 also shows an enlarged spectrum in the OH stretch-ing region, i.e., between 3000 and 3800 cm-1. In addition to abroad peak at 3180 cm-1 with a shoulder around 3400 cm-1,a sharp peak was observed at 3680 cm-1. This SFG spectrumis in agreement with that reported by Shen’s group.19 Thebroad peak at 3200 cm-1 is known to be of“ice-like water”,representing the symmetric O-H stretching (va) of tetra-hedrally coordinated water molecules.19,41 The shoulder Wavenumber/cm-1 Fig.4 4SFG spectrum of a fused quartz surface modified by an OTSmonolayer with full coverage in a neutral phosphate buffered solutionof pH 7, in the region of 2800 to 3800 cm-. Also shown is the samespectrum at an enlarged scale (10 times) in the OH region. around 3400 cm-1 is known to be of “liquid-like water”,rep-resenting the asymmetric O-H stretching (v) of water mol-ecules in a more random arrangement. The intensity ratiobetween the two peaks can be considered as an indicator ofthe order of the interfacial water.1 The peak at 3690 cm-has been assigned to the O-H stretching of water moleculeswithout hydrogen bonding.9,18 We call this OH bond “freeOH". The SFG peaks of OH with hydrogen bonding are verybroad due to the strong coupling between the vibration ofneighboring water molecules and Fermi resonance with theovertone of the HOH bending mode (v2). It is interesting to note that the SFG spectrum in the OHstretching region was similar to that of the ice/air interfacewith the significantly suppressed peak corresponding to“liquid-like water” at 3400 cm- compared to the SFGspectra of the quartz/water interface in the solution of thesame pH.17,21 These results show that the water molecules atthe OTS/water interface are extremely well ordered. Orderingof the interfacial water molecules has also been observed atthe water/CCl interface.12 The highly hydrophobic nature ofthe OTS surface should be the most important origin for theordering process. Fig. 5 demonstrates a number of fitting attempts for theSFG spectrum shown in Fig. 4. The squares, solid line anddashed lines correspond to the observed SFG signal, theoreti-cally fitted curve and deconvoluted peak components, respec-tively. Since the structure of the OTS monolayer of fullcoverage does not change with solution pH as will be shownlater, the phase angles for the C-H stretching modes (中c)from the OTS monolayer are taken to be 0. The phase anglesfor the interfacial water molecules are assumed to be either 0or 元. In order to make the fitting easier, the phase angles forthe two bonded OH stretching modes at 3200 and 3400 cmare assumed to be the same. Four combinations of phaseangles were used for fitting the results to eqn. (1) as:s:(a中bond OH=中free OH=0; (b) 中bond OH=0, 中free OH =; (c)中bond OH =元, free OH=0; and (d) 中bond OH =元, 中free OH =.Apparently, good fits were only obtained when the phaseangle of the bonded OH was 0 and not 元. Thus, the two com-binations of the phase angles shown in Figs. 5(c) and (d) canbe ruled out, but it is difficult to judge whether Pfree OH =0 orn only from this fitting process. As previously discussed by Du et al.,18,19 the free OH of Fig.5 A set of fitting curves for the SFG spectrum shown in Fig. 4(solid lines) and deconvoluted OH peaks (dashed lines) under phaseconditions of: (a) 中oH=中free OH=0; (b)中bond OH =0, 一free OH =元; (c)中bond OH=三, 中free OH=0; and (d) 中bond OH=I, 中free OH =T. The 中cHvalue is assumed to be zero in all cases. The negative peak representsthe one for =元. water at the OTS/water interface should protrude into thehydrophobic OTS surface due to breaking of the hydrogenbonding at the interface. If an “ice-like water”structure existsat the OTS surface, the direction of the dipole moment of thewater molecules in several succeeding layers of ordered watershould have nearly the same dipole moment direction as thatin the top layer. This means that the phase angles for both thebonded OH and the free OH should be zero and the fittingresults shown in Fig.5(a) are more reasonable. The relative phase measurements of the bonded and freeOHs should be carried out for a more precise discussion.19 2.2 Alkaline solution. Fig. 6 shows an SFG spectrum offused quartz modified by an OTS monolayer with full cover-age in an alkaline phosphate solution of pH 11. The peakintensities of the hydrogen-bonded OH modes were higherthan those observed in the neutral solution (Fig. 4), while thatof the free OH seemed to be nearly the same. The bond corre-sponding to“liquid-like water”, which was just a shoulder inFig. 4, became a noticeable peak in Fig. 6. Du et al. reportedthat the SFG intensity of water molecules at the fused quartzsurface in alkaline solution was much higher than those inneutral and acidic solutions.1Recently, we observed similarincreases in the SFG signal of hydrogen-bonded OH at afused quartz surface modified with amino-terminated SAM inalkaline solution.20-22 Fig. 7 shows a number of theoretical fits for the SFG spec-trum presented in Fig. 6 under the phase combinations of:(a) 中bond OH =中free OH=0; (b)中bond OH=0, 中free OH=; (c)bond OH =, 中free OH =0; and (d) 中bond OH=一, 中free OH=.The best fit was obtained when both 中bond oH and free oH werein the same phase with that of bond OH, i.e., 0. This phasecombination in alkaline solution (中bond OH =中freeOH =0) wasthe same as that obtained in the neutral solution (Fig. 5). 2.3 Acidic solution. Fig. 8 shows an SFG spectrum of afused quartz surface modified by an OTS monolayer with fullcoverage in an acidic phosphate buffer solution of pH 2. Theshape of the SFG spectrum is totally different from thoseobserved in neutral (Fig. 4) and alkaline (Fig. 6) solutions. Thepeak of “ice-like water” was hardly observed and the SFGsignal with a broad shape was observed around 3400-3700cm. The SFG spectrum of the interfacial water molecule isvery distinctive and has never been reported. The SFG measurements were also carried out in 10 mMperchloric acid (HClO4) solution. The SFG spectrum of theOTS monolayer in 10 mM HClO4 is very similar to that ofFig.8, suggesting that the phosphate ion does not stronglyaffect the structure of interfacial water. Fig. 9 shows a set of theoretical fits for the SFG spectrum Fig.6SFG spectrum of a fused quartz surface modifed by an OTSmonolayer with full coverage in an alkaline phosphate buffered solu-tion of pH 11. 4- 4 Fig. 7 A set of fitting curves for the SFG spectrum shown in Fig. 6(solid lines) and deconvoluted OH peaks (dashed lines) under thephase conditions stated in Fig. 5. Wavenumber/cm Fig. 8 SFG spectrum of a fused quartz surface modified by an OTSmonolayer with full coverage measured in acidic phosphate bufferedsolution of pH 2. Also shown is the same spectrum at an enlargedscale (10 times) in the OH region. Fig. 99 A set of fitting curves for the SFG spectrum shown in Fig. 8(solid lines) and deconvoluted OH peaks (dashed lines) under thephase conditions stated in Fig. 5. shown in Fig.88 under the phase combinations of:中bond OH=中free OH=0; (b)) 中bond OH =0,Pfree OH =;中bond OH =元, 中free OH=0; and (d) 中bond OH=元, free oH =.The best fit was obtained when bond OH is out of phase (n)while 中free oH is in phase (0). This combination is differentfrom those observed in the neutral and alkaline solutions(中bond OH = 中free OH =0). Thus, the modes of hydrogen-bondedOwater are in phase in neutral and alkaline solutions but out ofphase in acidic solution with respect to that of CH. 2.4 Discussion on the pH-dependent water structure at thequartz/OTS/solution interface. It is well known that an oxi-dized, clean quartz surface is hydroxylated with a silanolgroup (Si-OH) in aqueous solutions of low pH.42 The silanolgroup is deprotonated to Si-O- in solutions of higher pH.From the analysis of the pH-dependent second harmonic gen-eration (SHG) signals at the quartz/solution interface, Ong etal. observed two types of silanol sites having pK values of 4.5and 8.5 on the fused quartz surface.43 The structure of waterat the quartz surface strongly depends on the chemical com-position of the surface. In acidic solutions, hydrogen bondingbetween the silanol and interfacial water molecules is expectedto be formed. In alkaline solutions, an electric double layer atthe interface is formed because of the negative charges at thesurface, which is generated as a result of the deprotonation ofthe silanol groups, and the water molecules should be alignedin order within the double layer.17-21 When the quartz surface is treated with OTS molecules, it isexpected that most of the silanol groups on the quartz surfaceundergo the silane coupling reaction with OTS molecules andan OTS monolayer is formed.23,24 Therefore, the structure ofwater at an interface between an aqueous solution and quartzmodified by OTS should be totally different from that of thequartz without OTS modification. The intensity of the SFGpeaks corresponding to the OH stretching of the hydrogen-bonded water at the quartz/OTS surface was, however, verystrong and was nearly the same as that of a quartz withoutOTS modification in alkaline solution as shown in Fig. 6.21 Ifone assumes that the intensity of the SFG spectrum of watermolecules on the bare quartz surface in alkaline solution ismainly determined by the electric double layer as a result ofdeprotonation of the silanol groups,17-21 the present resultdemonstrates that the number of silanol groups on the OTS-modified quartz surface does not significantly change evenafter OTS modification. Silberzan et al. investigated the structures of a number ofsilane monolayers using X-ray reflectivity measurements andfound that the surface roughness of the SiO, surface wasreduced after OTS modification. They proposed that only asmall fraction of the silanol groups react with the OTS mol-ecules because most of the OTS molecules react with anadsorbed water layer present on the quartz surface and form atwo-dimensional network with intermolecular bonding of-Si-O-Si-.33 The existence of the adsorbed water layerbetween the OTS and substrate has also been confirmed byother groups.34,35,44 Zhao et al. found that the SHG signalsfrom the OTS-coated silica surface in alkaline solution, whichwere mainly generated from the electric field at the silicasurface as a result of deprotonation of silanol, were verysimilar to those of the bare silica surface. They concluded thatmost of the surface functional groups on silica remain intactand are still sensitive to the bulk pH after the SAM forma-tion.44 The same argument should be applicable here. Based on the above discussion, two kinds of interfacialwater molecules, that is, ones located on top of the OTSmonolayer (denoted as H,Oors) and ones located in the spacebetween the OTS and the quartz surface (H,Oguartz), can bedistinguished and observed using the present in situ SFG mea-surement. We tentatively describe a model to discuss thewater structure at the quartz/OTS/solution interface (Fig. 10). As schematically shown in Fig. 10(a), the unreacted silanolgroups on the OTS-coated quartz surface are deprotonated inalkaline solution and an electric double layer is induced by thesurface negative charges on the quartz surface. More watermolecules at the interface are aligned in order within the elec-tric double layer and a higher SFG intensity for bands corre-sponding to interfacial water should be obtained. Theintensity of the“free OH”band, which represents water mol-ecules in contact with the OTS surface (HOors), did notchange much with solution pH (Figs. 4, 6 and 8), suggestingthat the surface charges mainly affected the number of alignedwater molecules at the quartz surface (H2Oguartz) rather thanthose of H2Oors. Both H2Oors and H2Oquartz seem to be“ice-like water”as shown in Fig. 10(a). It should be mentionedhere that the dipole moments of the hydrogen-bonded O-Hfor the H2Oors and H2Oguartz have the same direction in alka-line solution [as shown by the arrows in Fig. 10(a)], whichshould also contribute to the intensity of the stronger SFGspectra of water molecules under the given condition. In neutral solution, the silanol groups of the quartz surfaceare only partly deprotonated and the electric double layer onthe quartz surface becomes weaker [Fig. 10(b)]. The orderedstructure of the H2Oquartz is expected to decrease significantlycompared to that in alkaline solution,1 while that of HOorsshould not change much with pH since it is far from thequartz surface. Thus, the SFG signals observed in the neutralsolution (Fig. 4) are considered to be mainly from HOors andnot H2Oquartz. The fitting results (Figs. 5 and 7) suggested thatthe interfacial water molecules maintain the same phase anglein neutral and alkaline solutions, and supported the fact thatthe water structure on the OTS surface in neutral solution isthe same as that in alkaline solution. In acidic solution, the silanol groups left on the OTS-coatedquartz surface are expected to be totally -SiOH [Fig. 10(c)].As previously reported, the hydrogen bonding can align watermolecules in an ordered structure on the quartz surface in anopposite orientation compared to that of the electric doublelayer induced by the surface negative charges.19 As shown inFigs. 8 and 9, the peak corresponding to “ice-like water” washardly observed at the quartz/OTS surface in acidic solution.The fitting results show that the bonded OH changed itsphase from 0 to n while the free OH maintained the samephase when the pH was changed from neutral to acidic. It isreasonable to assume that hydrogen bonding can only affectthe H2Oquartz and not H2OoTs, and hence H2Oors maintains the same structure as those in the neutral and alkaline solu-tions while H,Oquartz has the opposite orientation. It shouldirtbe noted here that H2Oors and H2quartz show oppositedipole moments [Fig. 10(c)]. Since the orienting effect byhydrogen bonding is weaker than that of the electric doublelayer induced on a quartz surface in alkaline solution, thenumber of H2Oquartz are supposed to be very close to that ofauHOors in acidic solution. The SFG signals of the “ice-likewater”from H2Oquartz and H2Oors may cancel each other dueto their opposite dipole moments. As a result, only a broadc"Cliquid-like water" peak, which was mainly from those ofH2Oguartz,and a free OH band appeared in the SFG spectrumin acidic solution. In conclusion, water molecules at the quartz/OTS surfaceare expected to flip while the water molecules on the OTSsurface maintain their orientation, when the solution pH ischanged from neutral to acidic as a result of the protonationof the silanol group. Such a flipping phenomenon of the inter-facial water on a bare quartz surface was demonstrated byShen et al. for the first time by interference trace measure-ment.17-19 The flipping takes place even on the OTS-coatedquartz surface because most ofthe silanol groups are still onthe quartz surface even after OTS formation. 3.Effect of OTS coverage on the structure of water and OTSmolecules Fig. 11 shows the SFG spectra at the quartz/OTS of lowercoverage in the C-H stretching region (2770-2990 cm-1) andCH+OH stretching region (2800-3800 cm-1) in phosphatebuffered solutions of (a,a') pH 11, (b,b’) pH 7 and (c,c) pH 2.The solid lines correspond to the theoretical fits under the bestfitting phase condition given above. The intensities of the SFG peaks in the C-H region [Figs.11(a)-(c)] were much weaker than those of the OTS mono-layers with full coverage both in air (Fig.2) and in solutions(Figs. 4, 6 and 8). The peaks corresponding to the C-Hstretching modes of the CH么 group of the OTS moleculeswere clearly observed in the SFG spectra [Figs. 11(a)-(c)].The OTS monolayer of lower coverage seemed to change itsorientation in solution compared to that in air. Such a struc-ture change was not observed for the OTS monolayer withfull coverage (Figs. 2, 4, 6 and 8). This should be related to theexistence of defects in the monolayer. The intensities of the free OH bond at the OTS monolayer H o Fig. 10Schematic structural models of interfacial water molecules on the quartz/OTS/solution interface in (a) alkaline,(b) neutral and (c) acidicphosphate buffered solutions. Arrows show the direction of the dipole moment of the interfacial water molecules. Wavenumber /cm Fig. 11 SFG spectra of a fused quartz surface modified by OTS withlow coverage in the C-H stretching region (2770-2990 cm-1) and theCH+ OH stretching region (2800-3800 cm-1) in phosphate buffered.solutions of (a,a) pH 11,(b,b) pH 7 and (c,c) pH 2. of lower coverage [Figs. 11(a')-(c')] decreased compared tothose at the OTS monolayer of full coverage in the solutionswith similar pHs (Fig. 4), suggesting that the ordered structureof H,Oors decreased with a decrease in the OTS coverage.More“liquid-like water” was observed from the SFG spec-trum in alkaline and neutral solutions [Figs. 11(a’)-(b)], indi-cating that the decrease in the order of the monolayer affectsthe structure of the interfacial water. It is interesting to notethat an“ice-like”peak was observed in acidic solution [Fig.11(c)]. This feature can be understood as follows: since thenumber of H2Oors decreased with the decrease in the OTScoverage, and the contribution of the “ice-like water”fromsH2rOeguparetza kbeocame larger than that from H2Oors, an upwardSFG peak was observed around 3200 cmas a result of theinterference. Conclusion The structure of the interfacial water at a fused quartz modi-fied by OTS has been investigated by in situ SFG in phos-phate buffered solutions at various pHs. The experimentalresults demonstrate that the water molecules at the quartz/OTS surface are flipped while the water molecules at the OTSsurface maintain their orientation, when the solution pH ischanged from neutral to acidic. The results show that most ofthe silanol groups still exist on the fused quartz surface evenafter a silane coupling reaction of OTS under the reportedexperimental conditions. Acknowledgements This work was supported by Grants-in-Aid for ScientificResearch on Priority Area of“Electrochemistry of OrderedInterfaces”(No. 09237101) and for Encouragement of YoungScientists (No. 10740314) from the Ministry of Education,Science, Sports and Culture, Japan. ( 1D. E isenberg a nd W. K a uzmann, The Structure and Pro p erties of . 11 Water, Oxford U niversity Press, London, 1969. ) ( P . A. Thiel and T. E. Madey, Surf. Sci. Rep., 1987,7,211. ) ( 3 J. L ipkowski and P. N. R os s , Structure of Electrified Interfaces,VCH Publishers, New York, 1993. ) ( 4M. Fleischmann, P . J. H endra, I. R . H ill and M . E. Pemble, J.Electroanal. Chem.,1981, 1 17,243. ) ( 5 B. Pettinger, M. R . Philpott and J. G . G o rdon, Surf. Sc i ., 1 9 81,150,415. ) 6 Y. X. Chen, S. Z. Zou, K. Q. Huang and Z. Q. Tian, J. RamanSpectrosc., 1998,29, 749. 7K. Ataka, T. Yotuyanagi and M. Osawa, J. Phys. Chem. B, 1996,100,10664. 8 M. F. Toney, J. N. Howard, J. Richer, G. L. Borges, J. G.Gordon, O. R. Melroy, D. G. Wiesler, D. Yee and L. B. Sorensen,Surf. Sci., 1995,335,326. 9 Q. Du, R. Superfine, E. Freysz and Y. R. Shen, Phys. Reu. Lett.,1993,70,2313. ( 10D. E . Gragson, B . M . McCarty and G. L. Richmond, J. Ph y s.Chem. B, 1 996, 100, 1 4272. ) ( D. E . Gragson a n d G. L. Richmond, Langmuir, 1997, 13, 4804. ) ( D . E . Gragson and G. L . Richmond, J.Ph y s. Chem. B, 19 9 8, 102,3847. ) 13 C. Schnitzer, S. Baldelli and M. J. Shultz, J. Phys. Chem. B, 2000,104,585. 14 D. Simonelli, S. Baldelli and M. J. Shultz, Chem. Phys. Lett.,1998,298,400. I. Benjamin, Phys.Rev. Lett., 1994,73,2084. A. Morita and J. T. Hynes, Chem. Phys.,2000, 258,371. ( ( Q . Du, E . F r eysz and Y. R. Shen, Phys. Rev. Lett.,199 4 ,72, 238. ) Q. Du, E. Freysz and Y. R. Shen, Science, 1994, 264, 826. Y. R. Shen, Solid State Commun., 1998,108,399. ( S. Ye, S. Nihonyanagi and K . Uosaki, Chem. Lett., 2000, 734. ) S. Nihonyanagi, S. Ye and K. Uosaki,Electrochim. Acta, 2001, inpress. 22 D. Miyamoto, S. Nihonnyanagi, S. Ye and K. Uosaki, in prep-aration. L. H. Lee, J. Colloid Interface Sci., 1968, 27, 751. J. Sagiv, J. Am. Chem. Soc., 1980, 102, 92. ( Y . R . Shen, Proc. Natl.Acad. S ci. USA, 1 996,93, 12104 ) ( P . B . Miranda a n d Y. R . S h en, J. Phys. Chem. B, 1 9 99,10 3 ,3292. ) ( C . D. Bain, J. Chem. Soc. Faraday T rans., 1995,91,1281. ) A. Tadjeddine and A. Peremans, in Spectroscopy for SurfaceScience, ed. R. J. H. Clark and R. E. Hester, John Wiley, Chiches-ter, 1998,p. 159. 29T. F. Heinz, in Nonlinear Surface Electromagnetic Phenomena,vol. 29, ed. H.-E. Ponath and G. I. Stegeman, North-Holland,Amsterdam, 1991, p. 353. ( 30M. H immelhaus, F . Eisert, M. Buck a nd M. G r unze, J . Phys.Chem. B, 2000, 104, 576. ) 31 P. Guyot-Sionnest and A. Tadjeddine, Chem. Phys. Lett., 1990,172,341. ( 32 R. N. W ard, P. B. D avies and C. D. Bain, J. Phys. Chem., 1993,97,7141. ) ( 33 P . Silberzan, L. Leger, D. Ausserre a nd J. J. Benattar, Langmuir,1991,7, 1 647. ) ( 34 A. N . P arikh, D. L. A llara, I. B. Azouz and F. Rondelez, J. Phys. Chem., 1 994, 98, 7 577. ) 35 A. N. Parikh, M. A. Schivley, E. Koo, K. Seshadri, D. Aurentz,K. Mueller and D. L. Allara, J. Am. Chem. Soc., 1997, 119, 3135. 36 S. Ye, T. Saito, S. Nihonyanagi, K. Uosaki, P. B. Miranda, D.Kim and Y. R. Shen, Surf. Sci., 2001, 476,121. 37 S. Ye, S. Nihonyanagi and K. Uosaki, Nonlinear Opt.,2000, 24,93. 38 P. Guyot-Sionnest, R. Superfine, J. H. Hunt and Y. R. Shen,Chem. Phys. Lett., 1988, 144,1. 39 J. Lobau, K. Wolfrum, A. Romphorst, K. Galla and S. Seeger,Thin Solid Films, 1996,289,272. 40 A. S. Lagutchev, K. J. Song, J. Y. Huang, P. K. Yang and T. J.Chuang, Chem. Phys., 1998,226,337. 41 J. R. Scherer, in AduancesTH ci in Infrared and Raman Spectroscopy,vol. 5, ed. R. J. H. Clark and R. E. Hester, Heyden, Philadelphia,1978. R. K. Iler, The Chemistry of Silica, John Wiley, New York, 1979. ( S. Ong, X. Zhao and K. B. Eis e nthal, Ch e m. Phy s . Let t ., 19 9 2, 191,327. ) 44 X. Zhao and R. Kopelman, J. Phys. Chem. B, 1996, 100,11014. OI: bPhys. Chem. Chem. Phys.,his journal is CThe Owner Societies hys. Chem. Chem. Phys.,
关闭-
1/7
-
2/7
还剩5页未读,是否继续阅读?
继续免费阅读全文产品配置单
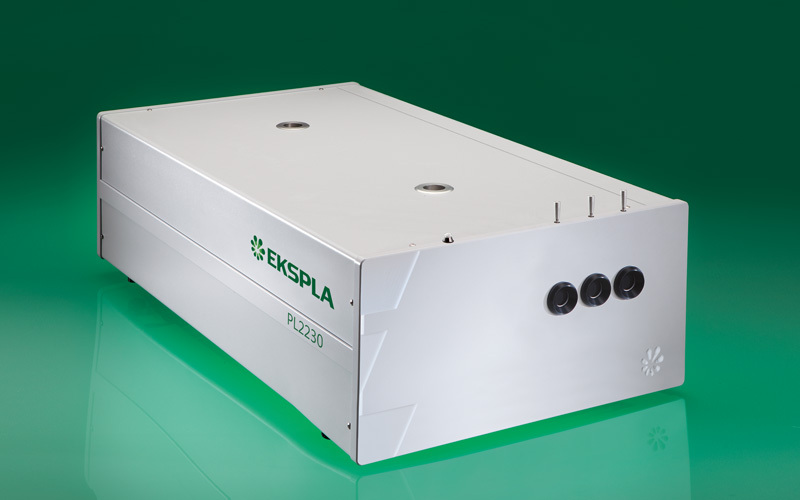
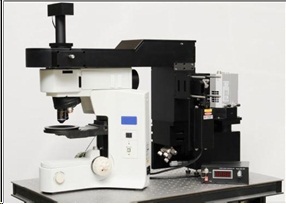
北京欧兰科技发展有限公司为您提供《十八烷基三氯硅烷,OTS,单层膜改性熔融石英中表面水分子结构,pH值相关性,和频光谱(SFG)研究检测方案(其它光谱仪)》,该方案主要用于其他中表面水分子结构,pH值相关性,和频光谱(SFG)研究检测,参考标准《暂无》,《十八烷基三氯硅烷,OTS,单层膜改性熔融石英中表面水分子结构,pH值相关性,和频光谱(SFG)研究检测方案(其它光谱仪)》用到的仪器有Ekspla SFG 表面和频光谱分析系统、Ekspla CARS 相干反斯托克斯拉曼显微光谱仪、Ekspla PL2230型高能量皮秒激光器。
我要纠错


相关方案
 咨询
咨询