方案详情文
智能文字提取功能测试中
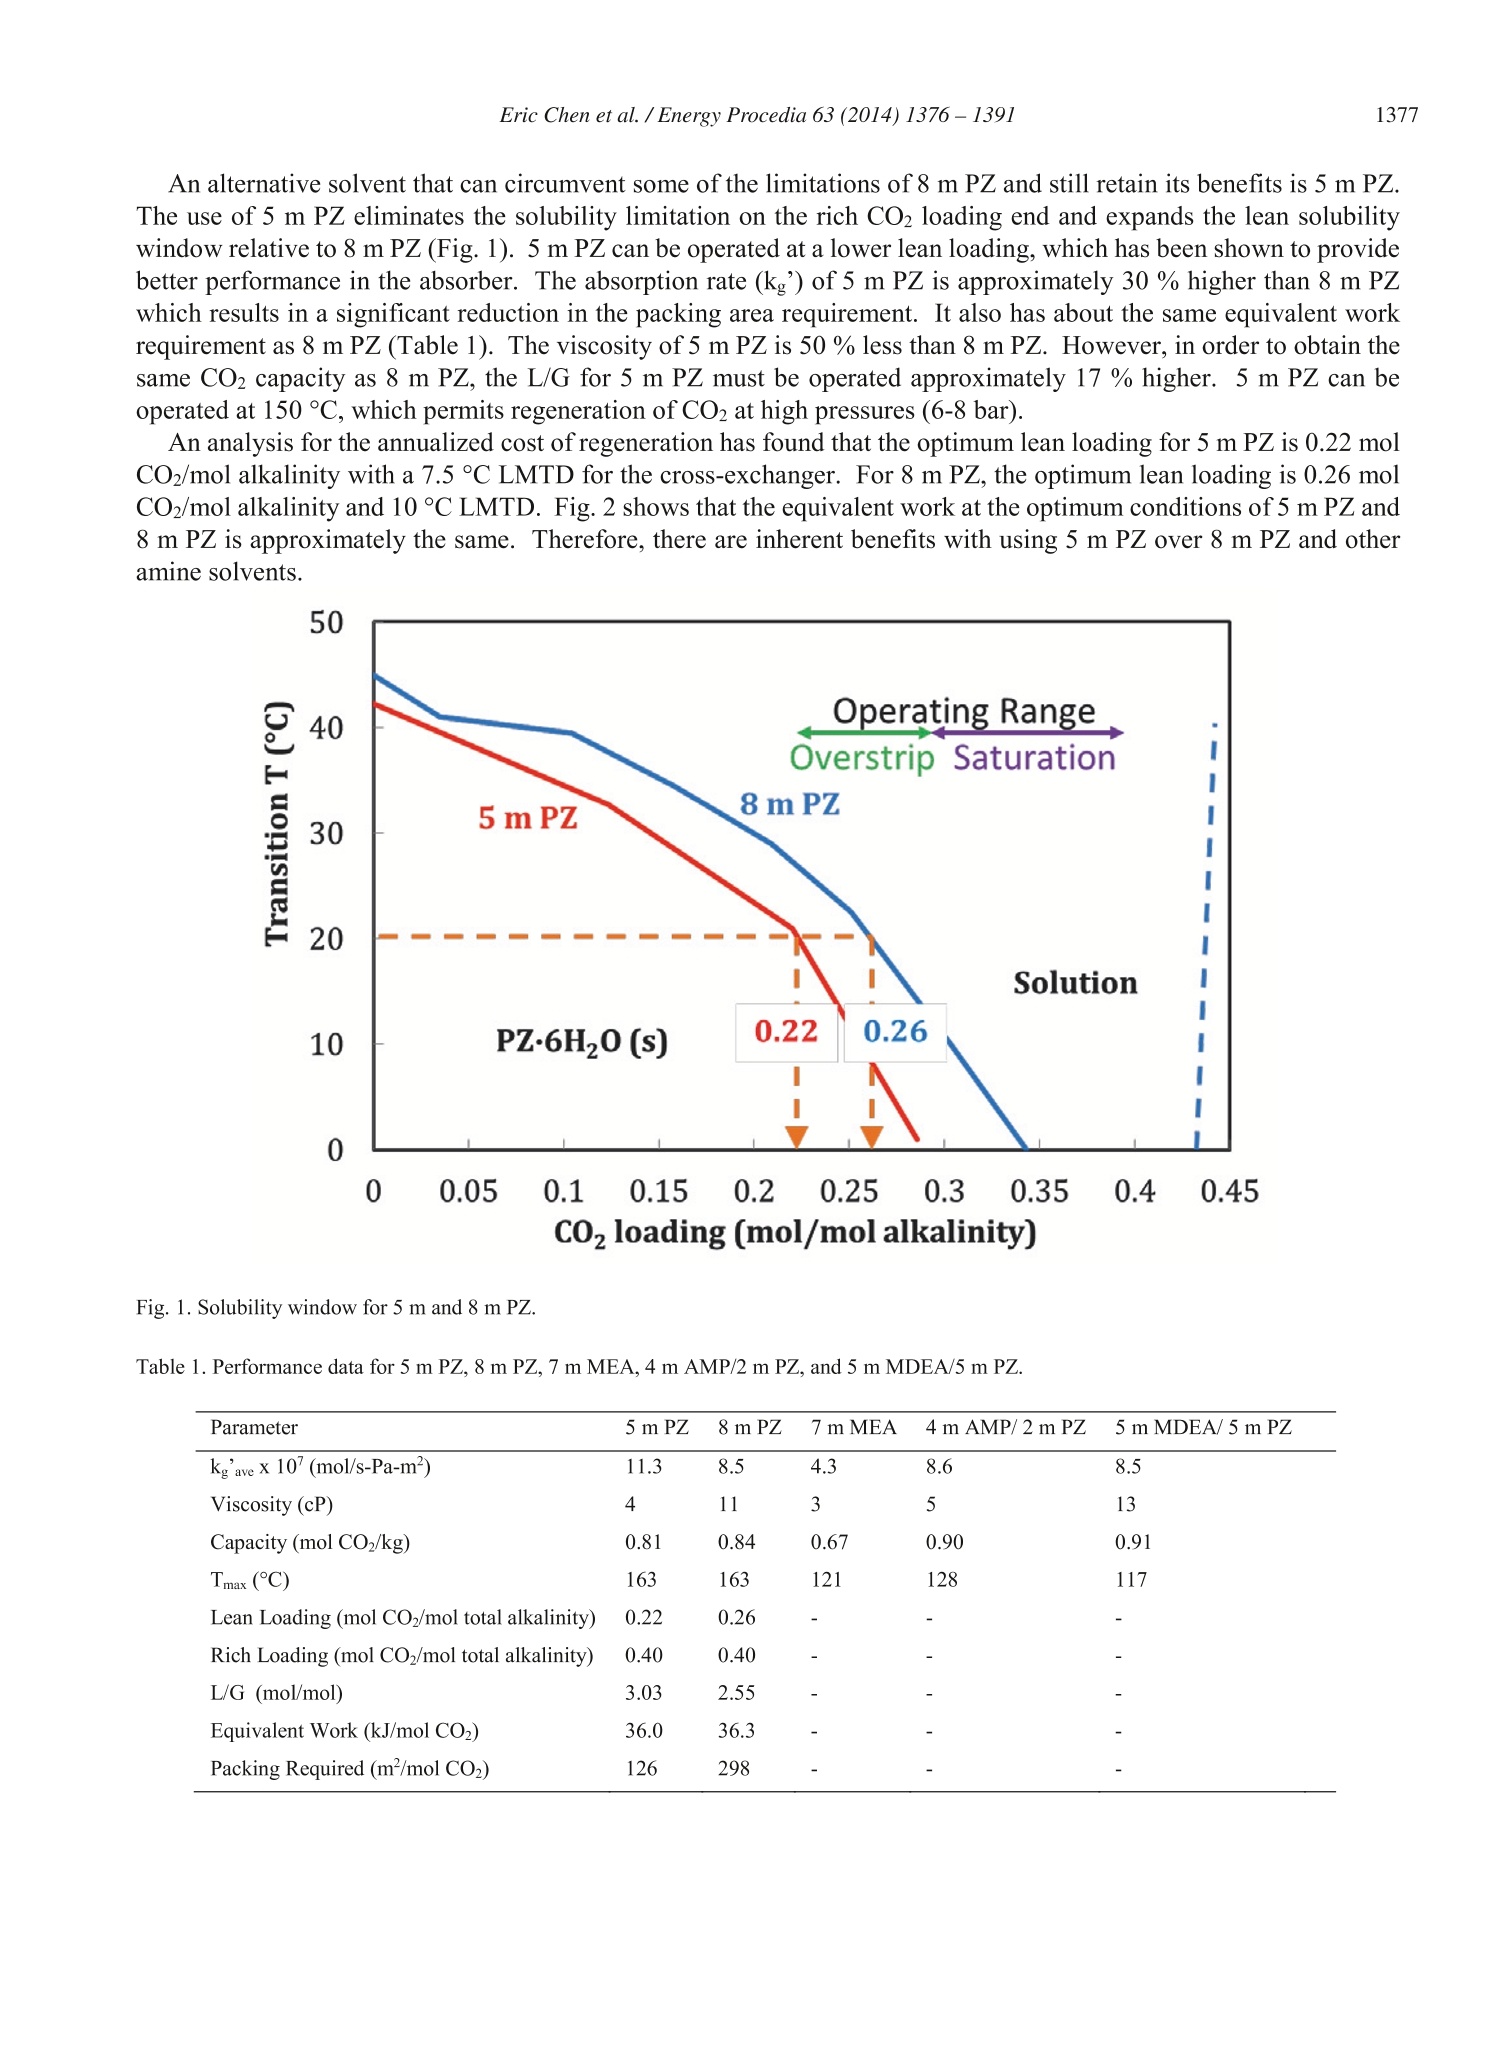
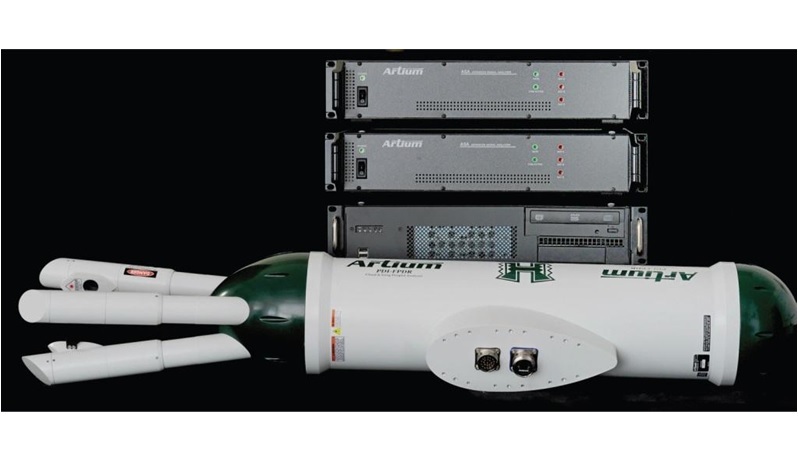
Available online at www.sciencedirect.comEnergyScienceDirectCrossMarkProcediaELSEVIEREnergy Procedia 63 (2014) 1376-1391 Eric Chen et al. /Energy Procedia 63 (2014) 1376-13911377 GHGT-12 Pilot Plant Activities with Concentrated Piperazine Eric Chen, Steven Fulk, Darshan Sache , YuJeng Lin , Gary T. Rochelleb* “Pickle Research Campus, The University of Texas at Austin, 10100 Burnet Rd., Bldg 133, R7100,Austin, TX, USAMcKetta Department of Chemical Engineering, The University of Texas at Austin, 200 E. Dean Keeton St., C0400, Austin, TX 78712-1589, USA Abstract Amine aerosol testing was conducted at the University of Texas at Austin CO2 capture pilot plant using concentrated piperazine(3.7 molal) and high temperature flash with cold rich bypass (140C). Two methods of piperazine aerosols generation were tested:H2SO4 injection with a liquid vaporizer injector, and direct injection 20 ppm of SO2 into the synthetic flue gas. A Phase DopplerInterferometer (PDI) analyzer from Artium Technologies was used to measure piperazine aerosol droplet sizes and distributions atthe absorber gas outlet. A FTIR system with new upgraded heated probes was used to make measurements of total PZconcentrations at the absorber gas inlet and outlet. A manual sampling train method was used to provide secondary validation ofFTIR and PDI measurements. @ 2014 The Authors. Published by Elsevier Ltd. This is an open access article under the CC BY-NC-ND license (http://creativecommons.org/licenses/by-nc-nd/3.0/). Peer-review under responsibility of the Organizing Committee of GHGT-12 Keywords: CO2 pilot plant; concentrated piperazine; amine aerosols; advanced flash stripper 1.Introduction 1.1. Concentrated Piperazine Concentrated (30-40 wt%) piperazine (PZ) with advanced flash stripper regeneration is a second generation amine-based process for CO2 capture [1]. 8 molal (m) PZ has double the CO2 absorption rate and capacity of 7 m MEA. PZalso has a moderately high heat of absorption (70 kJ/mole) and is oxidatively and thermally stable, which shouldprovide 10 to 20% better energy performance than 7 m MEA with thermal swing regeneration at 150 °C [2]. However,8 m PZ has a limited operating range due to solid solubility issues encountered at both the lean and rich CO2 loadings. ( * C o rresponding author. T el.:+1-512-471-7230; fax: + 1 -512-471-7060. ) ( E-mail address: gtr@che.u t exas.edu ) ( 1876-6102 O 2014 The Authors. Published by E l sevier Ltd. This is an open access article under the C C BY-NC-ND license( ht t p://c r e a ti v e c o m mons .o rg /l icenses / by-nc- nd /3.0 / ) . ) ( P eer- r eview under responsibility of the Organizing Committee of GHGT-12 doi:10.1016/j.egypro.2014.11.147 ) An alternative solvent that can circumvent some of the limitations of 8 m PZ and still retain its benefits is 5 m PZ.The use of 5 m PZ eliminates the solubility limitation on the rich CO loading end and expands the lean solubilitywindow relative to 8 m PZ (Fig. 1). 5 m PZ can be operated at a lower lean loading, which has been shown to providebetter performance in the absorber. The absorption rate (kg’) of 5 m PZ is approximately 30 % higher than 8 m PZwhich results in a significant reduction in the packing area requirement. It also has about the same equivalent workrequirement as 8 m PZ (Table 1). The viscosity of 5 m PZ is 50 % less than 8 m PZ. However, in order to obtain thesame CO2 capacity as 8 m PZ, the L/G for 5 m PZ must be operated approximately 17 % higher. 5 m PZ can beoperated at 150 C, which permits regeneration of CO2 at high pressures (6-8 bar). An analysis for the annualized cost of regeneration has found that the optimum lean loading for 5 m PZ is 0.22 molCO2/mol alkalinity with a 7.5 ℃ LMTD for the cross-exchanger. For 8m PZ, the optimum lean loading is 0.26 molCO2/mol alkalinity and 10 °℃ LMTD. Fig. 2 shows that the equivalent work at the optimum conditions of 5 m PZ and8 m PZ is approximately the same. Therefore, there are inherent benefits with using 5 m PZ over 8 m PZ and otheramine solvents. COz loading (mol/mol alkalinity) Fig. 1. Solubility window for 5 m and 8 m PZ. Table 1. Performance data for 5 m PZ, 8 m PZ, 7m MEA, 4 m AMP/2m PZ, and 5 m MDEA/5 m PZ. Parameter 5mPZ 8m PZ 7 m MEA 4m AMP/ 2 m PZ 5 m MDEA/5m PZ kg'ave x 107(mol/s-Pa-m²) 11.3 8.5 4.3 8.6 8.5 Viscosity (cP) 4 11 3 5 13 Capacity (mol CO2/kg) 0.81 0.84 0.67 0.90 0.91 Tmax (C) 163 163 121 128 117 Lean Loading (mol CO2/mol total alkalinity) 0.22 0.26 - - - Rich Loading (mol CO2/mol total alkalinity) 0.40 0.40 一 - L/G (mol/mol) 3.03 2.55 - - - Equivalent Work (kJ/mol CO2) 36.0 36.3 - - Packing Required (m²/mol CO2) 126 298 - - - Fig. 2. Equivalent work comparison for 5 m PZ and8 m PZ with the simple stripper and advanced flash stripper (AFS) configurations and crossexchanger LMTD approach temperatures. 1.2. SRP CO2 Pilot Plant The advanced flash stripper with cold and warm rich bypass builds on the technology developed from the two-stageflash and warm rich bypass configuration tested during a pilot plant campaign at the University of Texas of AustinSeparation Research Program (SRP) in October 2011 (Fig.3). The SRP pilot plant has a removal capacity of 3-6 tonsof CO2/day and uses synthetic flue gas consisting of CO and air. The high temperature advanced flash strippingprocess at 150 ℃ exploits the high thermal stability of PZ and results in a much higher regeneration pressure (5-10bar). A new configuration will integrate a gas-liquid heat exchanger to recover the heat from the overhead vapor bycross-exchanging it with the cold rich bypass stream. The advanced flash stripping process offers a smaller footprint,a more simple design, and lower capital costs than a conventional packed stripper column. Fig. 4 shows the advanced intercooling configuration, which splits the liquid flow at the heat exchanger and returnsa portion of the flow to the bottom packed bed and the remaining flow is recycled as spray to the top packed bed. Theintercooling recycle flow rate can potentially be five times the solvent feed flow to the absorber column. Thisconfiguration maximizes the amount of intercooling and increases the amount of mass transfer area available for CO2absorption. Fig. 3. SRP pilot absorber/stripper system with high temperature flash skid (bottom left). Advanced Flash Stripper with Cold Fig. 4. Advanced flash stripper configuration. 1.3. Amine Aerosol Emissions Elevated emissions of amines have been observed at several CO2 capture pilot plants and attributed to amine aerosolformation. Absorber water wash systems traditionally used to address amine volatility are not effective for the removalof amine aerosols. Pilot and bench-scale studies have shown that SO3 can become the nucleation site for the formationof amine aerosols. However, accurate measurements of amine aerosol droplet size and distributions is a challenge. 1.4. Past SRP Pilot Plant Testing Testing at the pilot scale with concentrated PZ has been completed in five separate campaigns since 2008 at theSRP pilot plant, which has a CO2 removal capacity of 3-6 tons/day (~0.1 MW) and consists of an intercooled absorberand simple stripper column. Both columns have an inner diameter of 0.43 m and each column is typically filled with6.1 m of packing. The facility uses synthetic flue gas consisting of air and CO2, which provides the flexibility to testat CO2 concentrations for both coal (12 mol %) and gas (3 mol%). A new high temperature and pressure two-stageflash regeneration skid was designed, fabricated, and operated in 2010 and 2011 and successfully regenerated 8 m PZat 150 °C and 14 bar. 1.5. Pilot Plant Objectives The SRP pilot plant campaign conducted in November 2013 focused on the development of methods for generating,measuring, and capturing PZ aerosols. To facilitate this effort, a liquid vaporizer injector (LVI) was procured andused to generate H2SO4 aerosols for injection into the pilot absorber gas inlet duct. An SO2 gas injection system wasalso tested as an alternative aerosol generation method. A Phase Doppler Interferometer (PDI) analyzer from ArtiumTechnologies was used to measure PZ aerosol droplet sizes and distributions at the absorber gas outlet. A FTIR systemwith newly upgraded heated probes was used to make measurements of total PZ concentrations. Pilot plant testingwas completed with 4 m PZ instead of 8 m PZ to evaluate performance differences with a lower viscosity and capacitysolvent. The SRP absorber column was packed with 6.1 m of RSP 250 structured packing and operated with twointercooling configurations. The existing two-stage flash process was modified into a single-stage flash with cold richbypass process and operated at 140°C. 2. Pilot Plant Configuration 2.1. Pilot Plant Configuration and Modifications The November 2013 pilot plant campaign was conducted with absorber intercooling and one-stage flash with coldrich bypass (Fig. 5). The absorber column was packed with 6.1 m of RSP 250 structured packing, divided into two3.05 m sections by a chimney tray and redistributor (Table 1). Liquid from the top packed bed is collected by achimney tray, cooled to 40 C, and circulated to the intercooling loop. The absorber column can be operated in two intercooling configurations: in-and-out intercooling and pump-aroundspray recycle intercooling. The pump-around configuration uses a spray nozzle to return the liquid solvent to theabsorber column in between the chimney tray and bottom of the top packed bed. Liquid from the spray is eventuallyreturned to the collector plate inventory. The liquid on the collector plate overflows through a weir in the middle ofthe chimney to the redistributor below. A liquid inventory of approximately 38 L is maintained. This configurationcirculates liquid solvent up to two times the solvent feed flow rate and increases mass transfer area for CO2 absorption.The absorber was operated with both modes of intercooling to determine its effect on aerosol emissions. Fig.5. Process flow diagram for SRP pilot plant integrated with the high temperature one-stage flash skid. Table 2. Absorber column packing and liquid distributor specifications. Packing Absorber Top Distributor Absorber Middle Distributor RSP 250 Structured Packing HC Perforated Pipe (SRP3C) HC Trough Drip Tube Two 3.05 m beds Range: 1.8-5.5 m/hr Range: 0.7-7 m/hr 250 m2/m3 3.7 pts/m² 1.3 pts/m 2.2. Amine Aerosol Generation The Liquid Vaporizer and Injector (LVI) by Air Quality Analytical, Inc. was used to generate H2SO4 aerosol at 1-5 ppmv in a 9.9 m’/min stream using a solution of 10 vol % H2SO4 [3]. The vaporized acid was injected into theabsorber inlet duct where it re-condensed as submicron H2SO4 mist on contact with the cold absorber feed gas. Theacid was injected approximately3 mupstream of the absorber gas inlet nozzle. The campaign also tested an alternativeaerosol generation method where 2 mol% SOz gas mixture was injected into the flue gas to produce 10-25 ppmv ofSO2 in a 9.9 m’/min gas stream. SO2 was injected at the discharge of the gas blower, which is approximately 15 maway from the absorber column gas inlet. 2.3. Aerosol Measurements Amine aerosol measurements were quantified using the following methods: FTIR, Phase Doppler interferometry(PDI), manual impinger-based measurements for amine concentrations, and manual impinger-based measurementsfor sulfuric acid concentrations using EPA Method 8. The samples were collected at three locations: absorber gasinlet, absorber gas outlet, and gas knockout tank outlet. FTIR and manual H2SO4 measurements were made at theabsorber gas inlet (Fig. 6). FTIR, PDI, and manual amine measurements were made at the absorber gas outlet. Athird FTIR measurement was made at the absorber gas knockout outlet, but a leak was detected and the sample pointwas removed from service. Fiber Filter Fig. 6. Locations of FTIR, PDI, and manual sampling ports. 2.3.1. Absorber FTIR Gas Analysis A GasmetTM DX4000 portable FTIR spectrometer was used to analyze for H2O, CO2, PZ, NH and SO2concentrations in the gas at the absorber inlet and outlet.. The FTIR has a path length of 5 m and a wavenumberresolution of 8 cm". The FTIR extractive system included heated probes with heated probe tubes and heated samplelines at each of the three sampling locations. A heated hot box with manual valves was used to switch between thethree sample locations.All of the components of the sampling systems were maintained at 180 ℃ to preventcondensation and vaporize any aerosolized material. Heat tracing and insulation was installed on exposed transitiontubing. The FTIR sample pump was installed downstream of the FTIR analyzer. For the pilot plant testing, all rundata were signal averaged for 1 minute. 2.3.2. Phase Doppler Interferometry (PDI) A demonstration Phase Doppler Interferometer (PDI) analyzer from Artium Technologies, Inc. was tested todetermine droplet sizes and distributions. The PDI consisted of a transmitter, receiver, and data acquisition/processingbox and was designed to make optical measurements through a windowed spool section. The Artium PDI was capableof measuring droplet diameters from 0.5-10 um (Fig. 7). The sample gas from the absorber outlet duct was pulledthrough a pipe nozzle by a regenerative blower at a rate of0.6 m’/min, which approximated an isokinetic sample. ThePDI optical window spool section was located less than one meter from the sample nozzle and upstream of the blower.The sample stream was pumped out of the regenerative blower back into the absorber outlet gas downstream of thesample point. Fig. 8 shows a simplified process flow diagram of the bypass sampling system. Fig. 7. PDI Instrument Installed at SRP. Fig. 8.PDI bypass sampling system process flow diagram. 2.3.3. Manual Measurement for Amine Concentration Gas-phase amine concentrations at the absorber outlet were measured with a manual sampling method in whichflue gas was pulled iso-kinetically through a glass probe maintained at 127 ℃ and then through a series of devicesdesigned to collect both the aerosol and vapor-phase fractions of the amine emissions. The gas passed from the probeinto a condenser coil that was maintained as cold as possible with ice water (8°C on 11/21/13 and 2 °℃ on 11/22/13).The purpose of the condenser coil was to knock out aerosol particles by both condensation and impingement via thegas’tortuous path through the coil. The coil was oriented vertically such that gas passed from top to bottom; an empty modified impinger (i.e., noimpingement plate) was mounted at the coil exit to collect condensate; this was followed by an empty GreenburgSmith impinger (i.e., fitted with an impingement plate). The gas then passed through two Greenburg Smith impingerscontaining 0.1 N H2SO4; the purpose of these impingers was to collect any remaining gas-phase amine that penetratedthe coil. The gas was then conditioned (dried with silica gel) so that sample volume could be measured. Sample runs lasted thirty minutes. On completion of a sample run, the sampling train parts (probe, condenser,impingers, and connection pieces) were recovered with a 0.1 N HSO4 rinse. The recovery of the sample train resultedin two fractions to be analyzed: (1) the probe, condenser, and empty impinger were recovered and analyzed together,and (2) the acid impinger was recovered and analyzed separately.1. The recovered fractions were analyzed for PZconcentration via cation chromatography. These concentrations were multiplied by the mass of liquid recovered todetermine the mass of PZ in the recovered fraction. The total amine concentration in the flue gas was calculated bysumming the amine mass recovered in the two fractions and then dividing by the volume of flue gas sampled. The sampling train was designed to measure total gas-phase and aerosol amine emissions; it was not designed todistinguish between and quantify aerosol and gas-phase emissions. The contact of flue gas with condensed liquid inthe condenser and empty impinger results in gas-phase amine being captured in the front end of the train. 2.3.4. EPA Method 8 for SO2 and Sulfuric Acid Species A modified version of EPA Method 8 was used to quantify sulfur dioxide and sulfuric acid emissions in the fluegas at the absorber inlet. In this method, gas is extracted from a sampling point in the inlet duct. The SO2 and SO3,including those fractions in any sulfuric acid mist, are captured in the sampling train, which consists of a GreenburgSmith impinger containing 80%isopropyl alcohol, a non-heated filter, a modified impinger containing 6% hydrogenperoxide, and a Greenburg Smith impinger containing 6% hydrogen peroxide. The sulfate content of the recoveredtrain was measured by anion chromatography. Since there was no particulate matter in the flue gas, a heated filterwas not used upstream of the sampling train. 2.4. Aerosol Capture The aerosol mitigation effort has focused on strategies to grow the aerosol particles inside the absorber column andwater wash in order to capture them with conventional droplet removal technologies such as impingement trays andsieve plates. An impingement tray was engineered in-house with some input from Dr. Frank Seibert and fabricatedby a local machine shop. The impingement tray was designed to have 1.6 cm-of-H2O of dry pressure drop and 1.9cm-of-H2O liquid pressure drop. The impingement tray consisted of three parts: demister, support ring, and sieveplate. The demister removes any entrained liquid as gas passes through the tray, and the demister is locatedapproximately 1 m above the impingement tray to provide enough disengagement residence time for droplets toagglomerate on the demister. The absorber feed pipe passes through a hole in the middle of the demister and is sprayed by a 180° spray nozzleoutward to the absorber column walls. The liquid flows down the walls and then radially from the outside edge to thecenter of the impingement tray. An overflow weir on the tray proves a liquid level through which the absorber gasmust pass. The liquid then overflows the weir and into the downcomer connected to the liquid distributor below. Theimpingement tray was fabricated but was not tested during the 2013 campaign. 3. Pilot Plant Results 3.1. Pilot Plant Performance The November 2013 SRP pilot plant campaign evaluated 3.7 m PZ (24 wt%), one-stage flash with cold rich bypass,and absorber spray recycle intercooling. The campaign only lasted for two days because of ongoing issues with theLV]L. that operating conditions and performance of the pilot plant. The gas and liquid rarateswereconstant for the duration of the campaign. However, although the absorber inlet gas rate was maintained at 9.9 m’/min,the dramatic difference in ambient temperature resulted in different gas mass flow rates. This is reflected in the L/G(mass/mass) of 3.7-4.0. When the intercooling spray was turned off, the CO2 removal decreased from 92% to 75%.The flash stripper was maintained at 140°C and 4.5 bar, which was slightly lower than the typical 150 °℃ at whichthe PZ campaigns have operated in the past. Table 3. November 2013 one-stage flash operating conditions (1 mol PZ=2 mol total alkalinity). Parameter Value PZ (wt%) 23.8-24.5 Lean loading (mol CO2/mol total alkalinity) 0.22 Gas Rate (m’/min) 10 L/G (mass/mass) 3.7-4.0 Intercooling (40 C, column middle) On/Off CO2 Removal (%) 75-92 Flash Stripper Pressure (bar) 4.5 Flash Tank Temperature (C) 139 Absorber Packing RSP 250 3.2. LVI H2SO4 Aerosol Generation A liquid vaporizing injector used H2SO4 to generate PZ aerosols at the SRP pilot plant. Priorto installation at theplant, it was tested at the bench scale to verify performance. However, when the LVI was operated during the pilotplant campaign, it experienced intermittent operation as a result of corrosion. This resulted in the eductor pluggingand subsequent shutdown of the LVI. The LVI was operable for a limited amount of time when the eductor wascleaned after each shutdown. The LVI was eventually abandoned and direct injection of SO2 was tested as analternative method for PZ aerosol generation. Table 4 shows the aerosols generation methods and sampling methodsused in the November 2013 operations.The absorber was operated with the intercooling spray recycle and alsowithout intercooling. Even with intermittent operation, the LVI was operated long enough to demonstrate that PZ aerosols could begenerated by the injection of sulfuric acid mist at the absorber inlet. Fig. 9 shows FTIR measurements that were madeat the absorber gas outlet for PZ, H2O,CO2, and NH. The figure shows a net increase in PZ concentration during thetwo periods where the LVI was operated. The baseline concentration of 15 ppm increased up to 50-70 ppm duringthe two injections. The manual sampling method (URS-2) also confirmed the elevated PZ concentrations measuredby the FTIR. Manual measurements via EPA Method 8 confirmed that no SOx species were detected in the flue gasduring LVI operation. FTIR measurements were attempted at the knock-out tank outlet, but there appeared to be a leak in the line thatcould not be fixed during the test campaign. No data were reported from this sampling location. Table 4. Aerosol generation and sampling matrix for November 2013 campaign. Date Start End Intercooling Intercooling HSO4 Injection SO2 FTIR Manual PDI Time Time Mode Injection Methods 11/21/13 9:30 11:15 ON Spray OFF OFF X 11/21/13 11:15 11:40 ON Spray ON OFF X X (Intermittent) 11/21/13 11:40 14:23 ON Spray OFF OFF X 11/21/13 14:23 16:52 ON Spray ON OFF X URS-1 X (Intermittent) URS-2 11/22/13 9:40 13:40 OFF OFF OFF X URS-4 URS-5 11/22/13 13:40 14:52 OFF 一 OFF 25 ppm X URS-7 11/22/13 14:52 15:30 ON Spray OFF 25 ppm X URS-8 11/22/13 15:30 16:45 ON Spray OFF OFF X Fig. 9. FTIR (UT/SRP) and manual sampling (URS) data taken 11/21/13. Dashed lines with circle points are manual sampling PZconcentrations averaged over a 30-minute interval adjusted for moisture content. The LVI was in operation between the dotted gray lines. 3.3. SO2 Aerosol Generation Direct injection SO2 gas was tested after it became apparent that the LVI would not be a reliable method forgenerating PZ aerosols. A rotameter was used to meter in 2 mol % SO gas and obtain an approximate targetconcentration of 25 ppm in the flue gas. This was verified by absorber inlet FTIR measurements, which measuredSO2 concentrations of approximately 22.5 ppm on a wet basis (Fig.10). FTIR and manual measurements for PZ were made at the absorber gas outlet. Fig. 11 shows that with the injectionof SO2, the concentration of PZ increased, which indicated that PZ aerosols were generated. This increase inconcentration at the absorber gas outlet was detected by both the FTIR and manual sampling methods (URS-7).During the second half of the SO2 injection interval, the spray recycle intercooling was turned off and the PZconcentration decreased. Both FTIR and the manual sampling method (URS-8) confirmed the decrease..The figurealso shows that the manual measurements (URS-4 andURS-5) were consistently higher than the FTIR measurementsfor PZ. The PZ analysis region overlapped the H2O analysis region, and this may have contributed to some error inthe PZ measurement. Fig. 10. FTIR analysis of SO2at the absorber inlet heated probe (11/22/13). SO2 was injected at a target concentration of 25 ppmv. Fig. 11. FTIR (UT/SRP) and manual sampling (URS) data taken 11/22/2013. Dashed lines with circle points are manual sampling PZconcentrations averaged over a 30-minute interval adjusted for moisture content. SO2 was injected during the period containing URS-7 and URS-8. The FTIR was switched to measuring the absorber inlet during the time period 14:24 through 14:45. 3.4.PDI Measurements Prior to installation at the SRP absorber column gas outlet, the operation of the PDI was verified in the laboratoryby spraying an atomized H2O stream using an airbrush. After the PDI was installed at the absorber outlet gas duct,the airbrush test was repeated. The airbrush was used to verify that the optical configuration was measuring dropletsizes under 5 um at high total concentrations. The total sample taken in a single measurement was fixed at 10,000counts by the PDI software..The reported particle densities provide translation from probability distributions toabsolute number distributions which can be used for mass balance calculations. Even with the intermittent operation of the LVI aerosol generator, the PDI demonstrated 513that measurements of sizedistributions in highly dense (10°particles/cm) streams between 0.5 and 10 um could be made. However, a drop-offat 0.5 um is observed due to the sensitivity envelope of the PDI. Example histograms of the PDI from the SRP testcampaign are shown in Fig. 12 and Fig. 13. The PDI data show that particle size distribution shifts to the right as theabsorber temperature increases. The size distribution shifts to the right (indicating larger particles) when moving fromFig. 12 (15.5 C) to Fig. 13 (38.5℃). The steepness of the drop-off at 0.5 um decreases as the absorber temperatureincreases due to the growth of the sub-0.5 um particles into larger particles that were detected by the PDI. was 15.5℃ (10-min. average). Fig. 13. PDI analyses taken on 11/21/2013 starting at 11:16 at an H,SO, injection rate of 1.5 mL/min. Samples were not consecutive. Absorber outlet temperature was 38.5℃(10-min. average). 3.5. Pilot Plant Data Reconciliation Data from the pilot plant campaign at the J.J. Pickle Research Campus (PRC) were used to validate absorber modelsdeveloped in Aspen Plus within the Independence thermodynamic and kinetic framework The model validationprocess included quantification of error in the pilot plant data and reconciliation of pilot results with model predictionby variation of global model correction factors. The error quantification and pilot plant data verification found thatCO2 and PZ component material balances closed within 95% confidence intervals, confirming internal consistency inthe pilot data. The two model parameters used to reconcile the November 2013 campaign were CO lean loading and effectiveinterfacial mass transfer area of the packing.. The results indicated that a 7.3% correction in lean CO2 loading or a39% decrease in the packing mass transfer area enabled the model to match pilot plant mass and energy balance results(Table 5). Surprisingly, these results were consistent with the data reconciliation completed for the October 2011campaign even though the pilot plant operating conditions were different (Table 6). The November 2013 campaignwas conducted with 3.7 m PZ instead of 8 m PZ and used RSP 250 instead of GTC 350Z. RSP 250 has a dry masstransfer area of 250 m/m’and a corrugation angle of 45 degrees, whereas GTC 350Z has an area of 350 m²/m’and acorrugation angle of70 degrees. One potential sources of bias may be the manual titrations for loading measurements completed for the pilot plantcampaign or the bench-scale data used to develop the Aspen Plus@ solvent model. Table 5. Model Corrections Required for November 2013 and October 2011 PZ Pilot Plant Campaigns. Parameter Correction Factor: Correction Factor: November2013 October 2011 CO2 Correction 1.073+0.013 1.075 +0.011 Interfacial Area 0.61 +0.01 0.74+0.03 Interfacial Area (Corrected for different packing used) 0.74+0.01 0.74+0.03 Table 6. Operating Conditions for the November 2013 and October 2011 Pilot Campaigns. Campaign November 2013 October 2011 Solvent Concentration (m) 3.6-3.75 7.2-7.9 Gas Rate (actual m’/min) 9.9 9.9-19 Liquid Rate (m/hr) 2.7 2.7-3.9 Absorber Packing [Type/Sp. Area (m /m)/Angle] Hybrid/250/Y Structured/350/Z Intercooling Yes/No Yes Number of Runs 4 11 4. Conclusions The 2013 SRP pilot plant campaign demonstrated 75 and 90% CO2 removal with 3.7 m PZ and reliable operationwith the modified single-stage flash with cold rich bypass.’The gas rate was 9.9 m/min and the liquid to gas (L/G)ratio was 3.7-4.0 (mass/mass). Some issues with the reliable operation the LVI aerosol generator were identified. APhase Doppler Interferometer (PDI) analyzer from Artium Technologies, Inc. was used to measure PZ aerosol dropletsizes and distributions at the absorber gas outlet. An FTIR system with new upgraded heated probes was used to makemeasurements of total PZ concentrations. Measurements by the PDI, FTIR, and manual stack sampling LVI allshowed that PZ aerosols were formed when the LVI was operating properly. The results showed that PDI was ableto measure aerosol droplets down to 0.5 microns, which was the limit of the demonstration unit that was used. A third generation PDI instrument with a 0.1 micron resolution limit will be developed and tested in a future pilot plantcampaign. Acknowledgements This work was supported by the CO Capture Pilot Plant Program (C2P3), Texas Carbon Management Program(TxCMP), U.S. Department of Energy Award Number DE-FE0005654 and DE-FE0013188, Emerson ProcessManagement, and Raschig-Jaeger Technologies. The authors declare the following competing financial interest(s): One author of this publication consults forSouthern Company and for Neumann Systems Group on the development of amine scrubbing technology. The termsof this arrangement have been reviewed and approved by the University of Texas at Austin in accordance with itspolicy on objectivity in research. The authors have financial interests in intellectual property owned by the UniversityofTexas that includes ideas reported in this paper. Disclaimer:“This report was prepared as an account of work sponsored by an agency of the United StatesGovernment. Neither the United States Government nor any agency thereof, nor any of their employees, makes anywarranty, express or implied, or assumes any legal liability or responsibility for the accuracy, completeness, orusefulness of any information, apparatus, product, or process disclosed, or represents that its use would not infringeprivately owned rights. Reference herein to any specific commercial product, process, or service by trade name,trademark, manufacturer, or otherwise does not necessarily constitute or imply its endorsement, recommendation, orfavoring by the United States Government or any agency thereof. The views and opinions of authors expressed hereindo not necessarily state or reflect those of the United States Government or any agency thereof." References ( [1] G. T. Rochelle, E. Chen, S. A. Freeman, D . H. Van W a gener, Q. Xu and A. K. V oice,"Aqueous PZ as the newstandard for CO2 capture technology," Chem Eng J., vol. 171, no . 3,p . 725-733,2011. ) ( [2] S. Freeman, R. Dugas, D. Van Wagener, T. Nguyen and G. Rochelle, "Carbon dioxide capture withconcentrated, aqueous piperazine," International Journal ofGreenhouse Gas Control, vol. 4, no. 2, pp. 1 1 9- 124,2010. ) ( [3] S. M. Fulk and G. T. Rochelle, "Quantification of total piperazine emissions by FTIR under variable bench-scale absorber conditions. Presented at G HGT-12, Austin, Texas, October 5-9, 2014," Energy Procedia, 2015. ) Amine aerosol testing was conducted at the University of Texas at Austin CO2 capture pilot plant using concentrated piperazine(3.7 molal) and high temperature flash with cold rich bypass (140 °C). Two methods of piperazine aerosols generation were tested:H2SO4 injection with a liquid vaporizer injector, and direct injection 20 ppm of SO2 into the synthetic flue gas. A Phase DopplerInterferometer (PDI) analyzer from Artium Technologies was used to measure piperazine aerosol droplet sizes and distributions atthe absorber gas outlet. A FTIR system with new upgraded heated probes was used to make measurements of total PZconcentrations at the absorber gas inlet and outlet. A manual sampling train method was used to provide secondary validation ofFTIR and PDI measurements.
关闭-
1/16
-
2/16
还剩14页未读,是否继续阅读?
继续免费阅读全文产品配置单

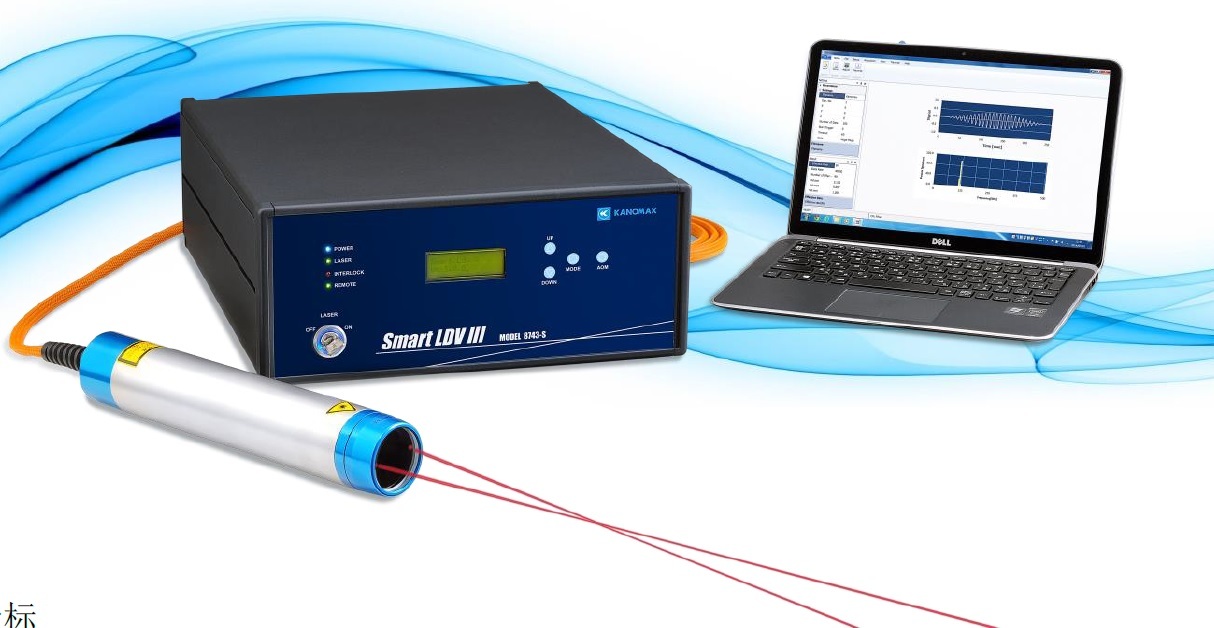

北京欧兰科技发展有限公司为您提供《哌嗪(对二氮己环)中液滴粒径和速度分布检测方案(干涉仪)》,该方案主要用于其他中液滴粒径和速度分布检测,参考标准《暂无》,《哌嗪(对二氮己环)中液滴粒径和速度分布检测方案(干涉仪)》用到的仪器有激光相位多普勒干涉仪LDV,PDI,PDPA,PDA、Artium PDI-FP 双量程可机载飞行探头、紧凑型激光多普勒测速仪(LDV)、德国LaVision PIV/PLIF粒子成像测速场仪。
我要纠错
推荐专场


相关方案
 咨询
咨询