方案详情文
智能文字提取功能测试中
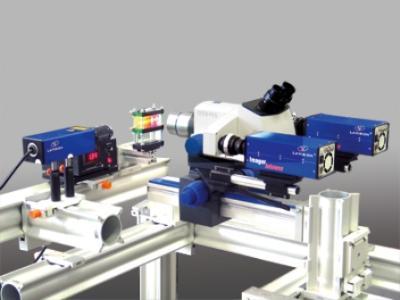
June 19-23, 2005, Houston, TX,USA Proceedings of FEDSM2005 2005 ASME Fluids Engineering Division Summer Meeting and Exhibition FEDSM2005-77097 A COMPUTATIONAL AND EXPERIMENTAL INVESTIGATION OF FLOW IN AN INTRACRANIAL SIDE-WALL ANEURYSM Ross Miller Francine Battaglia Graduate Student Assistant Professor Michael G. OlsenAssistant Professor Department of Mechanical Engineering lowa State University ABSTRACT Pulsatileefflowpatterns in an intracranialside-wallaneurysm of a human carotidaartery were investigatedexperimentally using microscopic particle image velocimetryona flexible wall model. Numerical calculations3 wereperformed on a stiff-walled artery with the same geometry andflow conditions. Experimental results showed cyclical vortexformation anddecay withintltheaneurysm. Numericalsimulations agreed well with the experimental results andindicate that vortex position and magnitude are due to pulsatileflow conditions rather than wall elasticity. However, thepresent results suggest that wall compliance plays a role insustainingthe pressure gradientss rneededfor Vortexdevelopment. Key words:: computational fluiddynamics, microscopicparticle image velocimetry, aneurysm INTRODUCTION Stroke is the third-leading cause of death and the leadingcause of long-term disability in the United States [1]. Acommoncause of strokemortality is subarachnoidhemorrhaging (SAH) due to intracranial aneurysms [2]. Anintracranial aneurysm is a balloon-like sac that forms on thecerebral arteries at the base of the brain. One surgicaltechnique for SAH cases is endovascular surgical occlusion(ESO) in which platinum coils are placed within the aneurysmsac to occlude blood flow in this region. In the ESO procedure,the surgeon makes a small incision in the patient’s groin andguides a small catheter through an artery into the blood vesselcontaining the aneurysm. The catheter is carefully guided intothe aneurysm where the coil detaches. The coil conforms to theaneurysm’s shape and packs the sac tightly in order to cut off blood flow into the aneurysm and thereby prevent rupture.Coil occlusionisisconsiderably lesss evasiveethannothertechniques and has been used frequently in recent years. Another recent technique for dealing with aneurysms is theapplication of stent grafts, in which a stent inserted into theaffected artery crosses over the aneurysm neck and occludesblood flow into the sac.The difficulty in successful stentgrafting lies in creating a stent that is dense enough to occludeflow to the aneurysm, yet porous enough to still allow theexchange of nutrients between the arterial wall and the blood.Recent research has focused on qualifying the effects of stentgeometry on blood flow in aneurysms. Most researchers haveusedinvitro experimental models[3-6] although somenumerical models have been employed [7,8]. To effectively understand and perform surgery such asESO and stent grafting, a complete understanding of the fluidmechanics of blood flow through intracranial aneurysms isrequired. This knowledge will allow surgeons and medicalprofessionals to predict aneurysm growth rates, potentials forsac rupture, and the responsesof individual patientstoparticular therapeutic methods. Numerical simulations have been used during the lastdecade to analyze blood flow phenomena in aneurysms [9-11,15-171.l.Unlike experiments, numerical simulations can berelatively inexpensive to conduct. Computational fluiddynamics (CFD) simulations provide a means of comparingand validating experimental work without the often difficultprocess of observing a real pYstenhysiological system.Previousefforts in numerical simulations of aneurysm flow have shownthe presence of many flow phenomena. Bluestein et al. [9]performed laminar and turbulent simulations of flow in ananeurysm with a steady inlet velocity. Results showed that arecirculation region formed within the aneurysm and promoted thrombosis (the obstruction of blood vessels by local clotting)and rupture conditions.The recirculation region generatedoscillating wall shear stress gradients and high levels of wallshear at the distal end of the aneurysm, which is the mostcommon location of aneurysm rupture.The recirculationregion was observed to be considerably larger and stronger inlaminar flow conditions than in turbulent flow conditions. It ismore physiologically realistic to use an inlet velocity thatmimics the pulse cycle by varying in time instead of the steadyvelocity used in Bluestein’s study.Steinman et al. [10]CFnpresentedda CFD model of pulsatilefflowwithin ananatomically realistic carotid aneurysm constructed from invivo imaging of a human subject.Their model successfullyreproduced velocity streamlines from an earlier in vivo modelof similar geometry and demonstrated regions of elevated wallshear stress. Fatouraee and Amini [11] used a commercial CFDsoftware package (FLUENT) to simulate the geometry andflow patterns found from magnetic resonance angiography(MRA) of an abdominal aortic aneurysm (AAA). Using MRAimaging techniques on an in vitro model of an AAA, flowstreamlines were reconstructed by applying an innovativealgorithm involving the stream function. FFlowyppatternscalculated using FLUENT were found to be in close agreementwith the MRA results. In the present research, numerical simulations of flow in anintracranial side-wall aneurysm have been performed. Thenumerical results are compared to experimental results of flowin an accurately sized experimental model of a human carotidartery witha side-wallaneurysmcas measureduusingmicroscopic particle image velocimetry (microPIV). Theobjectives of the research are to investigate the importance ofusing inelastic wallboundaries in the CFD model, toinvestigate the effect of pulsatile flow conditions on the flowpatterns in the aneurysm, and to validate the numerical andexperimental methods used in this research as a means tofaithfully represent real blood flow in the human cardiovascularsystem. NOMENCLATURE AAA: abdominal aortic aneurysm CFD: computational fluid dynamics MicroPIV: microscopic particle image velocimetry MRA: magnetic resonance angiography WSS: wall shear stress f: focal number of the microPIV lens d: particle diameter M: magnification 2: wavelength of emitted light u,v:streamwise and cross-stream velocity components METHODS Experimental Setup Experiments were performed for flow in an actual-sizedflexible-wall model of a human carotid artery with a side-wall aneurysm. The artery diameter was approximately 4 mm andthe aneurysm diameter was between 7 and 8 mm. A pumpingdevicethatsuppliedapproximatelytheesamee pressurewaveform found in an actual aneurysm replicated flow throughthe artery model. The velocity waveform generated for anentire phase of the pulse cycle in shown in the dashed curve inFig. 1. The slight negative velocity near 120°was due tolimitations of the reciprocity pump used to produce thewaveforms. In an actual physiological system, velocity shouldremain at or above zero for the entire pulse cycle. Figure 1. Inlet boundary conditions used in the numericalsimulations for pump flow conditions andphysiological flow conditions The working fluid used for the experiments was a mixtureof deionized water and 7 um tracing particles with a mixtureconcentration of 3.117 particles permL of water. At such a lowparticle concentration, the working fluid can be considered asingle-phase, Newtonian fluid, whereas blood is a multi-phase,non-Newtonian fluid. However, in arteries the size of thecarotid artery modeled in the experiment, it is generally safe toassume that non-Newtonian effectsareenegligible [121.Instantaneous velocity fields within the aneurysm at variousphases of the pulse cycle were measured using microscopicparticle image velocimetry(microPIV). The microPIV system is shown in Fig. 2. The aneurysmmodel is immersed in a water/glycerin mixture in a clear-bottomed container to reduce any optical distortions due torefraction, and the container is placed on the stage of aninverted biological microscope (Nikon model T-300 InvertedMicroscope). The workinggfluid containing fluorescentmicrospheres is then forced through the aneurysm model by theheart pump. The light from a New Wave Research GeminiNd:YAG PIV laser is expanded before entering the microscopethrough an aperture in the back. The laser light is then directedtowards the microchannel by a dichroic mirror and passesthrough a microscope objective, illuminating the seed particles.The laser is capable of producing up to 120 mJ per laser pulse, but only a small fraction of this light is necessary for themicroPIV experiments (less than 3 mJ per pulse). An opticalattenuator is therefore used to reduce the laser energy toapproximately 3 mJ/pulse. The fluorescent seed particles are excited by the laser lightand emit light at a peak excitation wavelength of612 nm. Abeamsplitter removes the illuminating and background lightsuch that only the emitted light from the particles reaches theCCD camera. Two images are captured per realization, and thetwo images are analyzed using a cross-correlation technique toyield the instantaneous velocity vector field. The PIV systemand software include a LaVision Flowmaster 3 camera andDaVis analysis software (Lavision Inc., Ypsilanti,MI). Figure 2. Schematic of the microPIV system used to capturethe experimental data The measurement depth (termed the depth of correlation inmicroPIV) can be determined using an equation derived byOlsen and Adrian [13] where e=0.01; is the focal number of the lens; dp is theparticle diameter; M is the magnification, and a is thewavelength of light emitted by the particle (note that analternative equation for the depth of correlation derived byMeinhart et al. [14] yields a similar result for the depth ofcorrelation). In the present experiments, a 20X 0.45 NAobjective was used, yielding a depth of correlation of 8.3 um.The interrogation windows in these experiments measure 28um square. Adjacent interrogation windows were overlappedby 50%, yielding a spatial resolution of 14 um. This spatialresolution allowed for 22 vectors to be measured across thewidth of the microchannel. Achieving this spatial resolutionrequired a volumetric particle concentration of approximately0.0567%. This volume fraction of seed particles is smallenough that any two-phase effects are negligible, and theworking fluid can be considered a single-phase fluid. The timing between laser pulses was set such that theparticlesmovedapproximately 1/4h of anninterrogationwindow between pulses. The interrogation windows measured64 camerapixels square, thus the particlesnmovedapproximately 16 pixels between laser pulses. The particleimage size projected onto the CCD sensor was approximately 4pixels. Assuming that the measured velocity is accurate towithin1/10tof a particle image diameter resultsin anexperimental uncertainly of less than±2.5%. Numerical Simulation Three-dimensional simulations of flow in the aneurysmwere performed using FLUENT 6.1[20] and GAMBIT 2.1[21] for grid generation.The governing equations wereformulated using standard finite volume procedures. A second-order upwind scheme was employed for discretization of theadvection terms in the momentum equation. Diffusion termswere discretized using second-order central differences.Animplicit segregated solver was used to correct for the pressurefield. Pressure-velocity coupling was based on the SIMPLEmethod..Pulsatile flow simulations for transient conditionsused a second-order discretization for the time derivatives. The boundary conditions specified for the numerical modelwere a transient velocity waveform (in accordance with theexperimental velocity waveform shown in Fig. 1) at the inlet,an outflow condition at the outlet, and no-slip conditions at therigid artery walls and aneurysm boundaries. The outf0Wcondition used an extrapolation procedure to define pressurebased on known values at nearbycells. The artery and aneurysm geometries were created usingGAMBIT.l.The numerical geometry is shown in Fig. 3a,illustrating the size of the aneurysm relative to the artery. Themodel was meshed with a total of approximately 33,000 cells.Using the tet/hybrid meshing scheme, the 3D mesh consistedprimarily of tetrahedral-shaped cells..Figure 3b shows themesh generated by GAMBIT in the x-y-plane at z =0 position.The mesh was validated using the grid convergence indexmethod [22,23] to quantify discretization error. A comparisonfor extrapolated errors and grid convergence indices foraneurysm neck pressures and downstream u-velocities on 3successively finer meshes is shown in Table 1. The resultsindicate that a 33.000 cell mesh was sufficient for relativelygrid-independent solutions. Convergence in time was attainedwhen normalized residuals of pressure and velocity dropped byat least three orders of magnitude. A time step of 1/360 s was used so that one time steprepresented one degree (out of 360 total degrees) of a pulsecycle. Simulations were performed running FLUENT inparallel using 2 nodes and 2 gigabytes of memory on a 44 nodeXeon cluster. Each pulsatile simulation required approximately9 hours of computational time to reach convergence. In order to investigate the validity of the pump used in theexperiment, the numerical simulation wasrunnwith twodifferent inlet conditions shown in Fig. 1. The first case usedthe inlet condition based on the experimental velocity profile Table 1. Mesh convergence studies for a coarse (3), medium (2), and fine (1) mesh. Superscript notation refers to acomparison between two meshes. Grid N cells (x,y,z)=(10.0,2.4,0)mm (x,y,z)=(17.0,0,0)mm Fine (1) 33209 91.37 6.59E-2 Medium (2) 16706 90.58 6.69E-2 Coarse (3) 6682 84.29 4.48E-2 Apparent order (p) 6.43 10.69 Approximate (a) relative error 32 a 6.94% 32.93% e.21 0.86% 1.44% Extrapolated (ext) relative error ,332 1.12% 1.29% ext 21 0.26% 0.14% ext Grid convergence index GCTy32medium 1.41% 1.63% GCI: 0.32% 0.17% (a) (b) generated by the pump in the microPIV system, where thevelocity briefly is negative near 120°. A second case for theinlet condition, shown by the solid line in Fig. 1 is modified toremove the artificial negative velocities and more accuratelyrepresents a physiological velocity function. The velocitydistributions of the two waveforms are otherwise exactly thesame. Finally, in order to investigate the effects ofthe pulsatileflow conditions, a third numerical simulation featuring aconstant inlet velocity was performed. The simulation was stilltransient and used the same time step as the two previoussimulations, however the inlet velocity did not vary with thephase of the pulse cycle. RESULTS AND DISCUSSION Aniimportantflowphenomenon1 o0bservedinttheexperiments was the formation and decay of vorticity withinthe aneurysm. A vortex formed inside the aneurysm at lowarterial flow velocities. The vortex magnitude was strongest atlow arterial velocities and decreased as velocity increased. Thelocation of the vortex within the aneurysm also varied with thephase of the pulse cycle. Numerical simulationswereperformed to determine if the computational model accuratelypredicted the physics observed in the experiments. The first simulation used a fixed velocity of 0.11 m/s at theinlet of the artery whereby the same velocity inlet persistedover the course of the simulation. The intent was to investigate the effects of inlet conditions on the vortex formation in theaneurysm. A small vortex developed near the center of theaneurysm and remained constant in both magnitude andposition, producing a steady state solution. This simulationdemonstrated that variations in vortex magnitude and positionwere not present when the inlet velocity was constant.Furthermore, although the governing equations of flow werediscretized in time as well as space, the results led to a steadystate solution, demonstrating that the pulsatile nature of bloodflow impacts the vortex development, as will be discussed later. The second set of simulations was conducted to determineif the small negative velocities that occur for a slight durationin the experimental waveform (shown in Fig. 1, labeled“pump”) resulted in unrealistic flow patterns compared toactual intracranial arterial flows, which have velocities at orabove zero over the entire waveform cycle. Two simulationswere performed, one case using the experimental waveformand the other case using a slightly modified waveform th:i1atmore closely resembles a physiological waveform.Figure 4comparess velocity vectors for the simulations using themeasured experimental inlet condition and the modified (i.e.,physiological) inlet condition. At the pulse cycle phase of 130°(Fig. 4b), the velocity data are nearly equivalent, with a maximum percent difference of less than 1%.The onlysignificant disagreement was for phases ranging from 115°-125°owing to the fact that the experimental waveform withnegative velocities produced reverse flow. Figure 4a illustratesthe subtle differences for the 120° phase where reverse flow inthe artery induces the fluid to move upstream, i.e., from right toleft. Otherwise, all other phases within the pulse cycle resultedin virtually identical numerical simulations irrespective of thewaveforms. Based on this conclusion that the small negativevelocities in the experimental waveform did not adverselyaffect the overall results, the final set of simulations iscompared directly to the experimental results. Figures 5a-d present velocity vectors at pulse phases of40°, 60°,240° and 360°, respectively, for the numericalsimulations (left frames) and the experiments (right frames).Each set of frames depicts the flowfield for the center plane ofthe aneurysm..The primary vortex is indicated by circulatingvectors near the aneurysm sac. At a pulse phase of 40°(Fig.5a), the velocity is near the maximum in the cycle cycle (referto Fig. 1). The numerical results show a stronger and moreclearly developed vortex near the aneurysm neck. At thisphase, the flow is primarily through the artery although a smallvortex eddy does form within the aneurysm. Fig. 5b presents results when the phase is 60°, which corresponds to a phase onthe descent of the pulse cycle. The flow tends to travel straightthrough the artery. It is during this deceleration phase that thestrength of the vortex in the aneurysm peaks. A large vortexeddy is present near the distal wall of the aneurysm, and thesimulations agree with the experiments. Figures 5c and 5d areresults during the diastolic phase and at the initial phase of thepulse cycle, respectively. The flow field travels straightthrough the artery, and there is a small vortex near the center ofthe aneurysm sac. In addition to the velocity vectors for the entire field inFig. 5, Fig. 6 compares local experimental and numerical u-velocity profiles in the z =0 plane at x-locations of 3 mm, 10mm, and 17 mm (upstream, center and downstream of theaneurysm) for pulse phases of 40°, 60°, 240°, and 360°. \Allfour phases show very good qualitative agreement between theprofiles at all three locations and demonstrate the ability of theCFD simulations to accurately reproduce experimental flow.Small discrepancies between the experimental and numericalprofiles arelikely due to difficulties in measuring theexperimental velocity data. Even witih microPIV it is difficultto measure data near the system’s walls due to the largecurvature of the aneurysm model causing optical distortions,because the index of refraction of the working fluid (water) didnot exactly match the index of refraction of the aneurysmmodel.l. The microPIV data was originally captured in fourseparate pieces that were later joined together, which may haveintroduced some errors in properly aligning the vectors for eachpiece. The discrepancy in vortex development at a pulse phase of40°(Fig. 5a) is most likely due to the difference in wallconditionsEbetweenttheexperimentsand the numericalsimulations.The experiments featured a model with elasticwalls capable of stretching and temporarily deforming. Duringthe experiments, the diameter of the aneurysm sac w. wasobserved to expand and contract by a few percent over thecourse of the waveform. The numerical model was unable toreproduce this condition because FLUENTconstrainsboundariesas1rigid walls. Inn spite of the observeddiscrepancies, the velocities are in good agreement at otherphases. More importantly, the numerical model was able torecreate the motion of the vortex shown in the experimentalmodel, leading to the conclusion that the variation of the vortexposition over time is a function of the pulsatile flow conditions,and not the presence of elasticity of the wall material. Thesefindings are in agreement with the results of previous numericalmodels [15-17, 19] that also showed the development of avortex that varied in position and intensity during the pulsecycle Oscillating wall shear stress is an important phenomenonin interaneurysmal flow that correlates with aneurysm rupture[16]. Finol and Amon [17] used a numerical model to showthat the temporal evolution of the vortex influenced oscillatorybehavior of wall shear stress (WSS) and WSS gradients alongthe aneurysm walls. The highest levels of WSS and WSS gradients were obtained along the distal end of the aneurysmwall when the arterial flow velocity was at its peak. Althoughthe model of Finol and Amon used a two-aneurysm geometry(unlike the single-aneurysm geometry in the present research),other researchers have noted similar results in single-aneurysmgeometries. Fukushima, et al. [16] noted that the distal end isthe most frequent site of aneurysm rupture. The Fukushimastudy supported this conclusion by demonstrating high vortex-induced WSS along the distal aneurysm wall with a numericalmodel, and suggested that unstable wall shears and pressurefluctuations may be associated with aneurysm growth (alongthe distal direction)) and eventual rupture. The presentsimulations correlate well with Fukushima [16] and also showcyclical vortex position and intensity during the pulse cycle,accompanied by a strong vortex near the distal aneurysm wallduring peak arterial velocity. Figure 7 shows WSS contourswithin the aneurysm and artery at various pulse phases. As thearterial inlet velocity (u) increases, the WSS along the distalaneurysm wall rises, reaching a maximum of 0.52 N/m whichcorresponds to the peak inlet velocity at the 40°pulse phase. The variations in vortex strength within the aneurysm canbe explained by the pressure gradients between the artery andthe aneurysm. Figure 8 shows pressure contours in the entire x-y-plane at z =0 for pulse phases of 40°, 60°, 240° and 360,respectively. Figure 9 shows the local pressure profiles and v-velocity profiles across the neck for these same phases. Theweaker vortex in the aneurysm at 240° and 360°correspond tosmall pressure gradients, while the strong vortex at 40°corresponds to a much larger gradient. The profiles in Fig. 9show that the phases with strong vortices have greater neckpressure gradients and elevated v-velocity near the distalaneurysm wall. At low velocities, the pressure gradient is smalland the flow tends enter into the aneurysm and form a vortexnear the center. At higher velocities, the large pressure gradientwithin the aneurysm sac and the artery causes the vortex tomove downward and forward towards the aneurysm neck. Overall, the numerical simulations compare well with theexperiments and provide confidence that simulations can beused to further examine blood flow behavior within intracranialside-wall aneurysms. Of particular interest is the potential useof numerical simulations to?predict the success of coilocclusion medical procedures. The use of simulations is arelatively inexpensive, safe and nonintrusive method that canbe used as a diagnostic tool. Furthermore, simulations canprovide continuous, detailed flow field information that is oftendifficult to measure and obtain in experiments. For example,the full three-dimensional velocity and pressure fields can bepredicted via numericalsimulations.whereas, experimentsprovide velocity fields at planes. SUMMARY Numerical simulations were performed for flow in anintracranial aneurysm and compared with experimental results.As a first step, the effect of inlet conditions was examined using a constant velocity specified at the artery inlet. Althoughsimulations predicted the formation of a vortex within the .010F .005F .000 .010F .005 .000 .000 .010 .005 三 A .000 .000 .010F .005 .000 .000 .005 .010 .015 .020 x(m) .010F .020 .020 .020 .000 .005 .010 .015 .020 x(m) Figure 5.Velocity vectors for the simulations (left frames) and experiments (right frames) at pulse phases of (a) 40°, (b) 60°,(c)240°, and (d)360° .008- x=3mm .008 x=10mm .0081 x=17mm .3 .3 3 .3 u-velocity (m/s) u-velocity (m/s) (d) Figure 6. Streamwise velocity profiles compared between CFD simulations and microPIV experiments downstream of, at the centerof, and upstream of the aneurysm. Pulse phases shown are (a) 40°, (b)60°, (c) 240° and (d) 360° Figure 7. Contours of wall shear stress (WSS) near the distal aneurysm wall at pulse phases of (a) 40°, (b) 60°, (c) 240° and (d) 360° aneurysm, the flow wassteady and therefore the vortexposition never changed.1.This result lends support to theconclusion that vortex position is a function of the pulsatileflow condition and not wall elasticity. Next, the inlet conditionfor the simulations was based on the pulse phase cyclecorresponding to the experimental pump. The negativevelocities shown by the experimental waveform inlet conditionwas due to the reciprocity pump used in the experiments.Simulations were conducted to test the waveform based on theexperiments and a modified waveform. It was found that thesmall negative velocities created by the pump had a negligibleimpact on the over flow as was demonstrated by the numericalsimulations. The results comparing the simulations with experimentswere found to be in good agreement. There was evidence thatthe simulations predicted the motion of the flow entering theaneurysm neck and the vortex formation. However, thecomparison at a pulse phase of 40° showed that the simulationpredicted a stronger aneurysm vortex than was observed in theexperiments.The differences were likely due to the pressuregradients. As noted previously, the location and magnitude ofthe vortex within the aneurysm varied with the pulse cyclephase, which is a function of the pressure gradient. It seemsthat wall compliance plays a role in sustaining pressure gradients and developing the vortex that forms during rapidacceleration and deceleration of the pulse cycle when thevelocity changes dramatically.y.Verifying this claim wouldrequire experimental pressure datawithin the artery andaneurysm. Althoughtthe experimental waveform was notphysiologically realistic, and most likely the negative valuescould have been eliminated if a more expensive centrifugalpump was used, no major differences appeared between theobserved experimental results and the numerical results asidefrom the previously noted discrepancy at 40°. If highlylocalized results specific to the pulse cycle near 120° aredesired for an experimental model, the more expensive pumpcapable of producing a more realistic velocity waveform maybe needed. However, for experiments such as those conductedfor this research, the less expensive pump will produce verygood results. As a final comment, there is evidence to suggest that wallelasticity may be important. However, currently elastic wallsare complex and expensive to model numerically. lResultsbased on this research shows that the effects of elastic walls arenegligible at times, but are an important consideration forfuture simulations. ACKNOWLEDGMENTS The authors would like to thank the computer andtechnical support by the High Performance Computing Centerat Iowa State University. REFERENCES ( Hademenos GJ a n d M a ssoud TF (1 9 97). “Biophysical Mechanisms Of Stroke.” Stroke, 28(10), 2067-2077. ) ( Juvela S, Poussa K and P orras M ( 2001). “FactorsAffecting gf Formation t and Growth of Intracranial Aneurysms: A Long-Term Follow-Up Study. " S S troke.32(2),485-91. ) ( [3] Lieber BB, Livescu V, Hopkins LN and Wakhloo AK (2002). “Particle Image V elocimetry A ssessment ofStent D esign I nfluence o n I ntra-Aneurysmal (F Flow."Annals of Biomedical Engineering, 30(6), 768-777. ) [4] Liou TM, Liou SN and Chu KL (2004).“Intra-Aneurysmal Flow with Helix and Mesh Stent PlacementAcross Side-Wall Aneurysm Pore of a Straight ParentVessel.”Journal of Biomechanical Engineering, 126(1),36-43. [5] R , Han MH and Cha SH (2002). “Changes ofFlow Characteristics by Stenting in Aneurysm Models:Influence of Aneurysm Geometry and Stent Porosity.”Annals of Biomedical Engineering, 30(7), 894-904. [6] Sadasivan C, Lieber BB, Gounis MJ, Lopes DK andHopkins LN (2002).“Angiographic Quantification ofContrast Medium Washout from Cerebral Aneurysmsafter Stent FPlacement.” AmericanJournal ofNeuroradiology, 23(7),1214-1221. [7 Morris L, Delassus P, Walsh M and McGloughlin T(2004)..“A Mathematical Model to Predict the In VivoPulsatile Drag Forces Acting on Bifurcated Stent GraftsUsed in Endovascular Treatment of Abdominal AorticAneurysms (AAA).” Journal of Biomechanics,37(7),1087-1095. [81 Stuhne GR and Steinman DA (2004).“Finite-ElementModeling of the Hemodynamics of Stented Aneurysms.”Journal of Biomechanical Engineering, 126(3),382-387. [91 Bluestein D, Niu L, Schoephoerster RT and DewanjeeMK (1996). “Steady Flow in an Aneurysm Model:Correlation Between Fluid Dynamics and Blood PlateletDeposition.”Journal of Biomechanical Engineering,118(3),280-286. [10]Steinman DA, Milner JS, Norley CJ, Lownie SP andHoldsworth DW (2002). “Computed Blood FlowDynamicsinAnatomically Realistic CerebralanAneurysm.” 4thWorld Congress of Biomechanics,Calgary, AB, August 4-9, 2002. [111] Fatouraee N and Amini AA (2000)..“Recovery of FlowPatterns in an Abdominal Aortic Aneurysm Phantomfrom Phase ContrastMRI. IEEE Workshop onMathematical Methods in Biomedical Imaging Analysis,Hilton Head, SC, June 11-12, 2000. ( Ku D N (1997). “Blood F low I n A r teries.” Annual Review of Fluid Mechanics, 29,399-434. ) ( Olsen M G and Adrian RJ ( 2 000).“Out-of-Focus Effects on Particlee I mag eV isibilit y and C o rrelation inMicroscopic Particle I mage Velocimetry.” Experiments in Fluids, 29(7), S166-S174. ) ( 141 Meinhart CD, Werely ST and G ray MHB (2000). “Volume Illumination F or T w o-Dimensional Particle Image Velocimetry." Measurement Science and Technology, 1 1(6), 809-814. ) ( 1151 Wille S (1981 ) . Pulsatile Pressure and Flow in a n Arterial Aneurysm Simulated in a Mathematical Model.Journal of Biomedical Engineering, 3, 153-158. ) ( [161 Fukushima T, Matsuzawa T, an d Homma T ( 1 989).Visualization and F inite E lement A n alysis of Pulsatile Flow in Abdominal Aortic Aneurysm. B iorheology, 2 6,109-130. ) ( 171 Finol EA and Amon C H (2001). Blood Flow i nAbdominal A ortic A Aneurysms: Pulsatile F Flow Hemodynamics. J o urnal of Biomechanical Engineering,123(5),474-484. ) ( 181 Henkes H,Fischer S, Weber W,Mi l oslavski E, F e lber S,Brew S , and Kuehne D (2004). Endovascular CoilOcclusion o f 1811 I ntracranial1 Aneurysms: : E arlyAngiographic and C l inical R esults. Neurosurgery, 54(2),280-285. ) ( 1191 Chitanvis SM, Hademenos G , and P owers W J ( 1 995).Hemodynamic A s sessment of the D e velopment a n dRupture of Intracranial Aneurysms U sing ComputationalSimulations. N eurology R e search, 17(6), 426-434. ) 纠四四 ( FLUENT 6.1 U s er’s Guide. F l uent Inc., Lebanon, NH, 2003. ) ( GAMBIT 2.0.4 User’s Guide e. Fluent Inc. , Lebanon, NH, 2001. ) ( Celik I, Chen JC, Roache PJ, and Scheurer G 1993).Quantification of uncertainty in computational f luid dynamics. A SME Fluids Engineering D ivision Summer Meeting, Washington,DC, June 20-24,1993. ) ( [231 ] Celik I and Karatekin O (1997). Numerical experiments on application of f Richardson h extrapolation onnonuniform g rids.Journal of F luids Engineering, 1 19,584-590 ) Copyright O by ASME
关闭-
1/12
-
2/12
还剩10页未读,是否继续阅读?
继续免费阅读全文产品配置单

北京欧兰科技发展有限公司为您提供《颅内侧壁动脉瘤中流动特性的计算和实验研究检测方案(粒子图像测速)》,该方案主要用于癌细胞/肿瘤细胞中流动特性的计算和实验研究检测,参考标准《暂无》,《颅内侧壁动脉瘤中流动特性的计算和实验研究检测方案(粒子图像测速)》用到的仪器有显微粒子成像测速系统(Micro PIV)、PLIF平面激光诱导荧光火焰燃烧检测系统。
我要纠错
推荐专场


相关方案
 咨询
咨询