Hydrolysis Products中Hydrolysis Products as Ethanolamines检测方案(液相色谱仪)
检测样品 废水
检测项目 有机污染物

 钻石会员
8138 篇解决方案
钻石会员
8138 篇解决方案
方案详情文
智能文字提取功能测试中
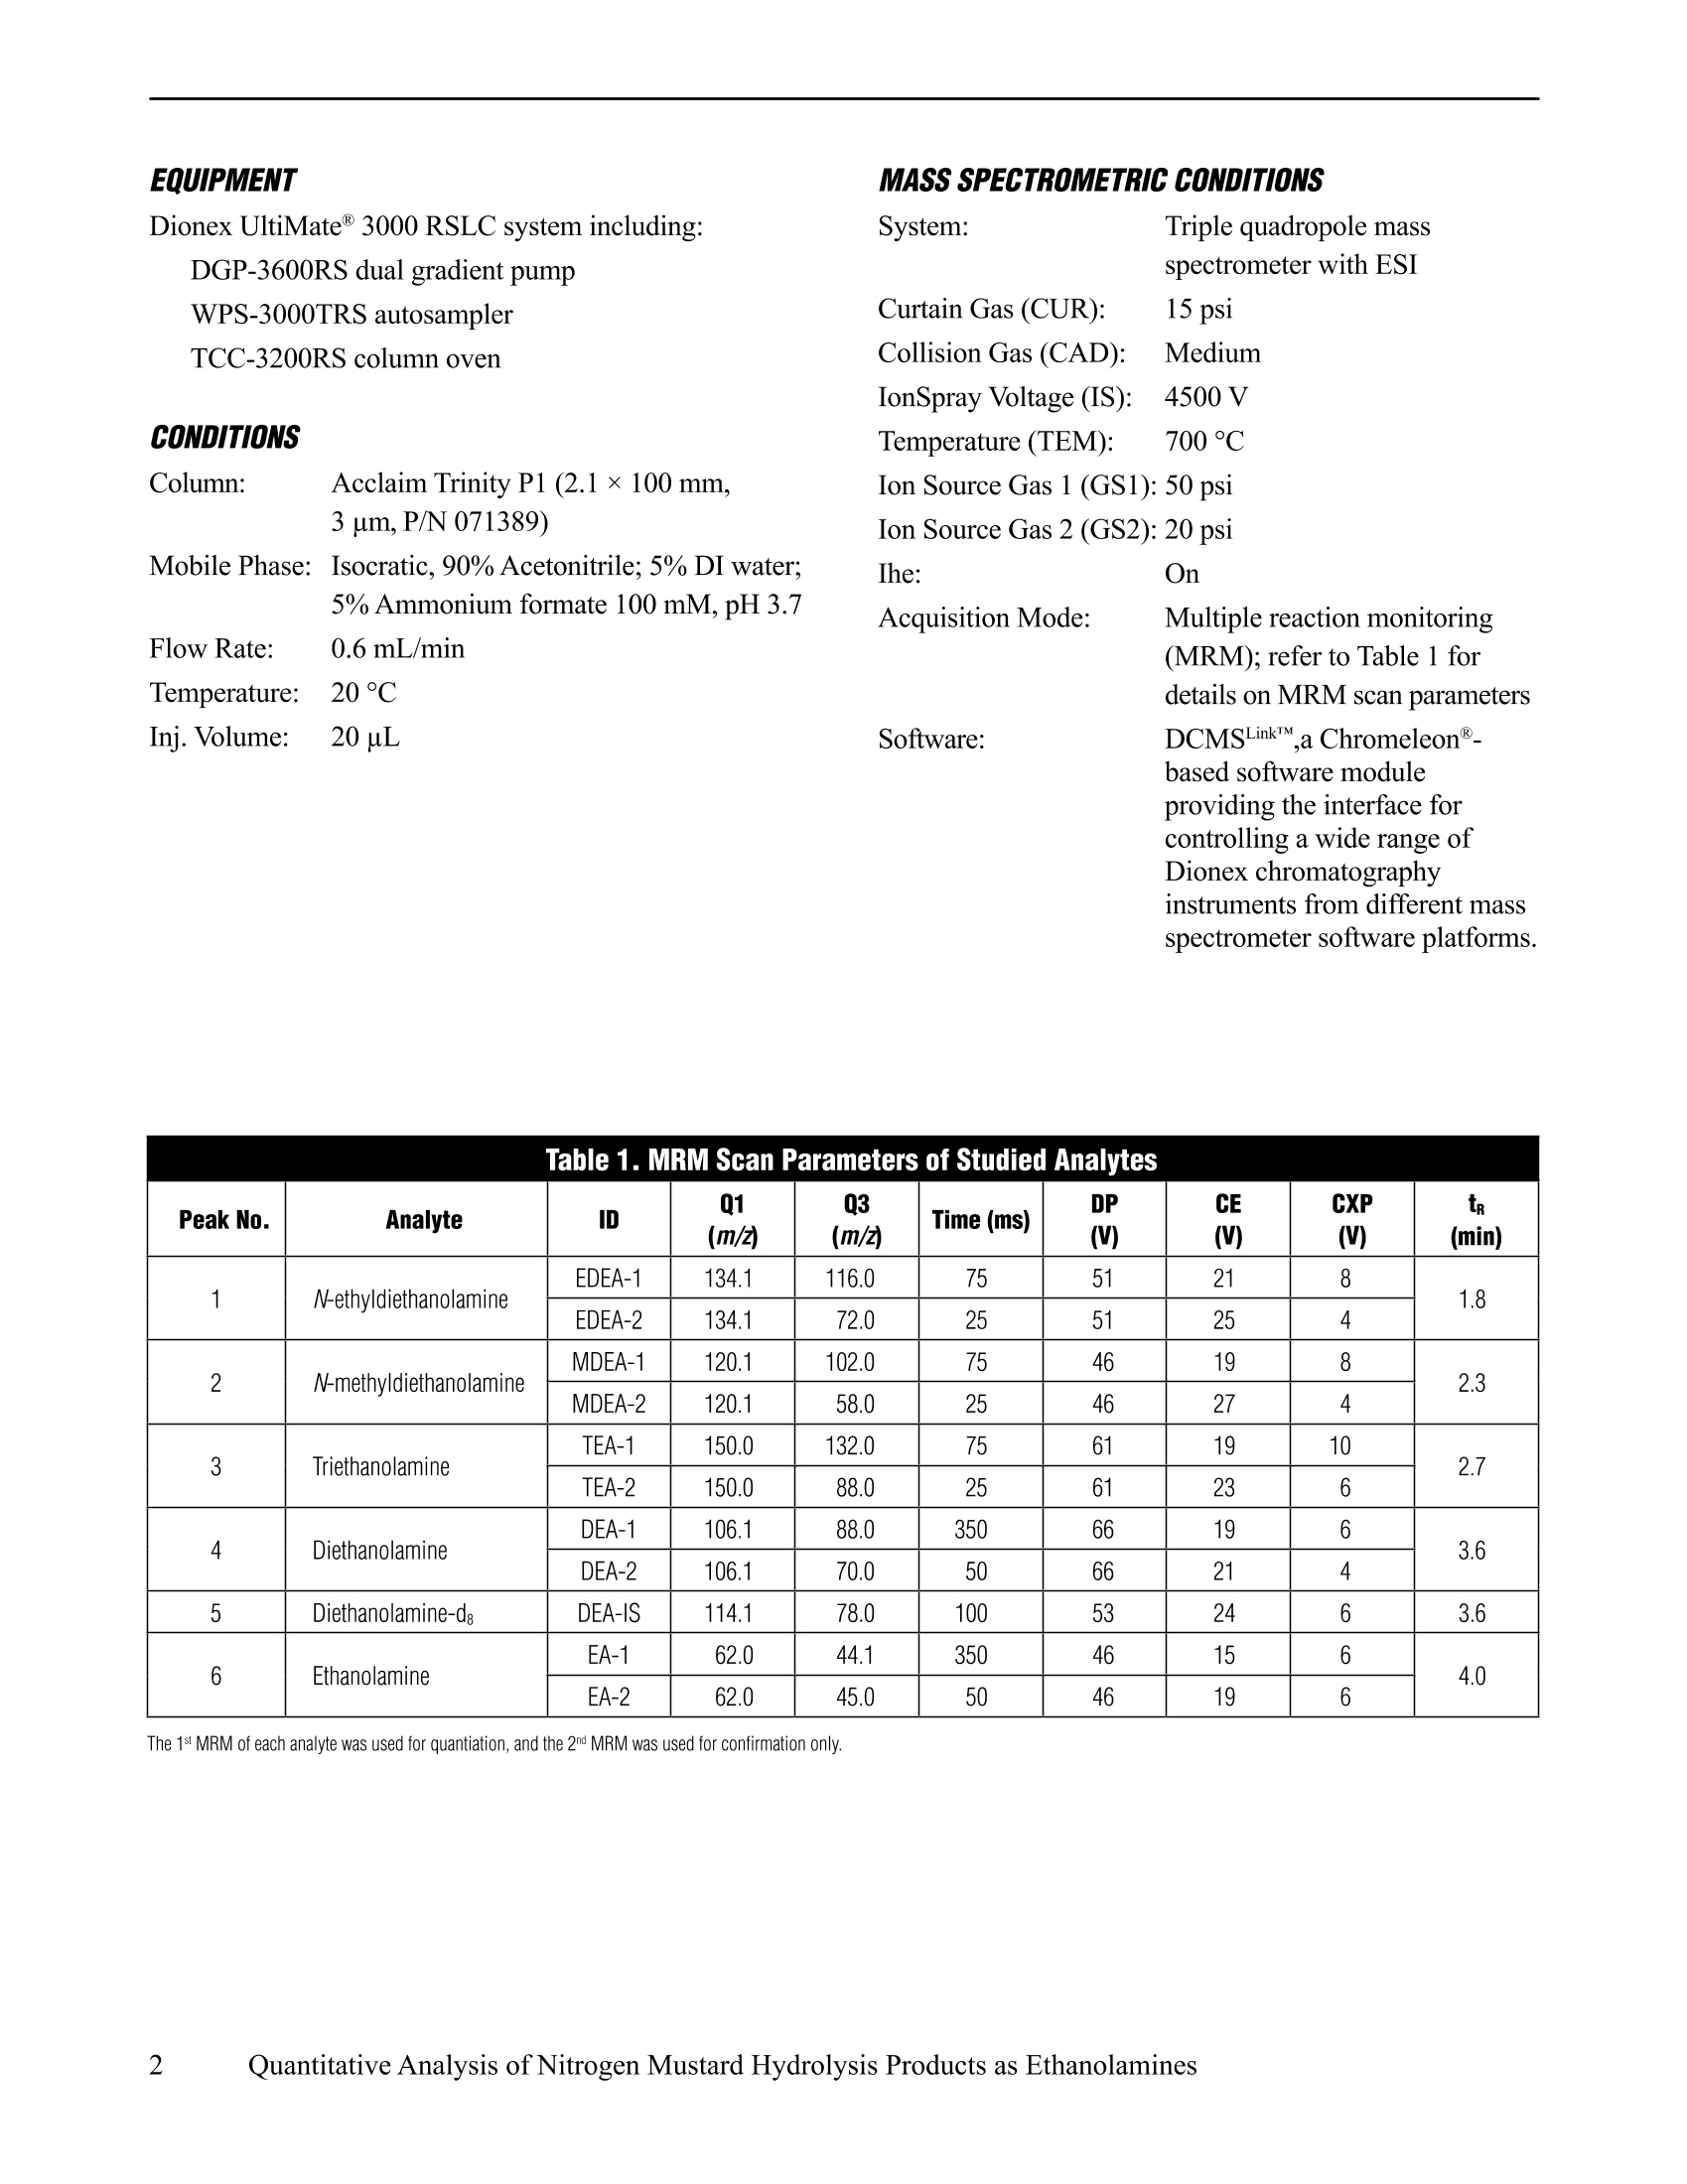
Application Note 271DIONEXNow sold under theThermo Scientific brandThermoS CIENTIFIC Quantitative Analysis of Nitrogen MustardHydrolysis Products as Ethanolamines INTRODUCTION Ethanolamines have been used as bio-andenvironmental markers for nitrogen mustards (HN1, HN2,and HN3), which are listed on the Chemical WeaponsConvention Schedule of Chemicals to monitor potentialexposures. Direct quantification of exposure to HN1,HN2, and HN3 is difficult due to their reactivity, extentof metabolism, and short half-life.?Nitrogen mustardsreadily react with biomolecules and are found in urineas the hydrolysis products: N-methyldiethanolamine(MDEA), N-ethyldiethanolamine (EDEA), andtriethanolamine (TEA).3 Over half a million tons of ethanolamines areproduced annually and used as emulsifying agents,detergents, ingredients in bactericides and cosmetics, andalso in the pesticide manufacturing process. Inefficientremoval and/or inappropriate disposal of ethanolamimesmay cause adverse effects to the environment. To monitor human and environmental exposure tonitrogen mustard, and also the removal of ethanolaminesfrom industrial discharged waste, a quantitative analyticalmethod is desired. Reported methods for ethanolamines analysis includeGC or LC separation with MS detection. The GC-MSmethods involve labor-intensive derivatization whichlimits throughput, and reported LC methods usually sufferfrom poor retention and chromatographic separation withreversed-phase (RP) columns. A fast LC-MS/MS methodreported the total separation of MDEA, EDEA, and TEA.However, the estimated retention factor (k) for the first-eluted TEA was less than one, making the method subjectto possible interference from sample matrices, which wasconfirmed in the same report. This study reports a rapid separation liquidchromatography (RSLC) tandem mass spectrometric(MS/MS) method for quantitative analysis of ethanolaminesin environmental water samples. An AcclaimTrinity P1Mixed-Mode column featuring reversed-phase, anion-exchange, and cation-exchange retention mechanisms wasused to provide retention and resolution for all analyteswithin 5 min. The MS detector was operated in multiplereaction monitoring (MRM) mode, and an isotope labeledinternal standard (IStd) was used to provide selective andsensitive detection and to ensure quantification accuracy. EQUIPMENT Dionex UltiMate@3000 RSLC system including: MASS SPECTROMETRIC CONDITIONS System: Triple quadropole mass DGP-3600RS dual gradient pumpspectrometer with ESIWPS-3000TRS autosamplerCurtain Gas (CUR): 15 psiTCC-3200RS column ovenCollision Gas (CAD): MediumIonSpray Voltage (IS): 4500 VCONDITIONSTemperature (TEM): 700°CColumn: Acclaim Trinity P1 (2.1 ×100 mm,Ion Source Gas 1 (GS1): 50 psi3 um, P/N 071389)Ion Source Gas 2 (GS2): 20 psiMobile Phase: Isocratic, 90% Acetonitrile; 5% DI water;Ihe: On5% Ammonium formate 100 mM, pH 3.7Acquisition Mode: Multiple reaction monitoringFlow Rate: 0.6 mL/min(MRM); refer to Table 1 forTemperature: 20 °Cdetails on MRM scan parametersInj. Volume: 20 pLSoftware: DCMSLinkTM,a Chromeleon@-based software moduleproviding the interface forcontrolling a wide range ofDionex chromatographyinstruments from different mass Table 1. MRM Scan Parameters of Studied Analytes Peak No. Analyte ID Q1 (m/Z) Q3 (m/z) Time (ms) DP (V) CE (V) CXP (V) te (min) 1 N-ethyldiethanolamine EDEA-1 134.1 116.0 75 51 21 8 1.8 EDEA-2 134.1 72.0 25 51 25 4 2 N-methyldiethanolamine MDEA-1 120.1 102.0 75 46 19 8 2.3 MDEA-2 120.1 58.0 25 46 27 4 3 Triethanolamine TEA-1 150.0 132.0 75 61 19 10 2.7 TEA-2 150.0 88.0 25 61 23 6 4 Diethanolamine DEA-1 106.1 88.0 350 66 19 6 3.6 DEA-2 106.1 70.0 50 66 21 4 5 Diethanolamine-d DEA-IS 114.1 78.0 100 53 24 6 3.6 6 Ethanolamine EA-1 62.0 44.1 350 46 15 6 4.0 EA-2 62.0 45.0 50 46 19 6 The 1st MRM of each analyte was used for quantiation, and the 2md MRM was used for confirmation only. OH HO OH HO D OH H,N H D-D H D -D Ethanolamine (EA) Diethanolamine (DEA) Diethanolamine-dg(DEA-IS) CAS: 141-43-5 CAS: 111-42-2 CAS: 103691-51-6 Chemical Formula:C,H,NO Chemical Formula: CHNO, Chemical Formula: CH,D NO, Exact Mass:61.05 Molecular Weight: 61.08 Exact Mass: 105.08 Molecular Weight: 105.14 Exact Mass: 113.13 Molecular Weight: 113.18 HO OH HO. .OH HO .OH N -OH N-Methyldiethanolamine (MDEA) N-Ethyldiethanolamine (EDEA) Triethanolamine (TEA) CAS: 105-59-9 CAS: 139-87-7 CAS: 102-71-6 Chemical Formula: C.H,NO, Chemical Formula: C,H, NO, Chemical Formula: CH NO, Exact Mass: 119.09 Molecular Weight: 119.16 Exact Mass: 133.11 Molecular Weight: 133.19 Exact Mass: 149.11 Molecular Weight: 149.19 27914 Figure 1. Chemical structures ofstudied compounds. PREPARATION OF SOLUTIONS AND REAGENTSChemical and Reagents Standards of studied analytes were purchased fromSigma-Aldrich: ethanolamine (EA, CAS: 141-43-5,Aldrich: 411000), diethanolamine (DEA, CAS: 111-42-2,Fluka: 31589),N-methyldiethanolamine (MDEA, CAS:105-59-9, Aldrich: 471828), N-ethyldiethanolamine(EDEA, CAS: 139-87-7 Aldrich: 112062), triethanolamine(TEA, CAS: 102-71-6, Fluka: 90279). Isotope labeledinternal standard (IStd) diethanolamine-d,(DEA-IS)was purchased from C/D/N Isotopes (CAS: 103691-51-6,D-5308). Figure 1 shows the chemical structures andrelated information. Ammonium formate was purchased from Aldrich(516961). Acetonitrile was obtained from Burdick &Jackson (HPLC grade,AH015-4). Deionized water(18.2 MQ-cm resistance) used in this study was obtainedfrom a Millipore water station. All chemicals were dissolved in deionized(DI)water to prepare individual primary stock solutionsat 1000 pg/mL (ppm). Working stock solutions wereprepared for each analyte by diluting primary stocksolutions in DI water to 1 ppm, 100 ppb, 10 ppb, and1 ppb to prepare calibration standards. A working stocksolution for the internal standard was prepared at100 ppb in deionized water for the preparation ofcalibration standards and to spike unknown samples.Calibration standards were prepared in DI water at 8levels: 0.05 ppb, 0.1 ppb, 0.5 ppb, 1 ppb, 2 ppb, 5 ppb,10 ppb, and 20 ppb. Each level contains all five targetanalytes with internal standard spiked at 1 ppb. Sample Preparation Surface water samples were collected in HDPEplastic bottles and stored under refrigeration at 4 °℃until analysis. An aliquot of each water sample wasspiked with internal standard at 1 ppb in a 1.5 mLautosampler vial and analyzed directly (filter the surfacewater samples when necessary, e.g., if suspended particlesare observed). RESULTS AND DISCUSSION Chromatography As shown in Figure 2, all five target analytes wereseparated to baseline within 4.5 min. A retention factor(k') of 3.3 for the first-eluted EDEA indicated sufficientretention for all analytes and thus ensured the separationof targeted analytes from early eluting species. Differentfrom general RP columns, the Acclaim Trinity P1Mixed-Mode column features RP and ion exchangemechanisms, thus providing unique selectivity forionizable organics. For the mixed-mode column, eluentstrength is affected by organic modifier composition,buffer type, buffer pH, and buffer concentration. Referto the column manual for more information on methoddevelopment and modification. The conditions describedin the experimental section were developed to achievesufficient retention and total resolution for all targetanalytes with consideration of method throughput.Although the separation was completed within 4.5 min,the total run time was set at 8 min to elute anypossible strongly retained species and thus improvemethod ruggedness. Mass Spectrometry The aim of this study was to develop a selectiveand sensitive method for the direct analysis of tracelevel ethanolamines in environmental water samples,therefore, MS/MS instrumentation was selected for itssensitivity and ability to provide trace level detection.In addition, the selectivity of MS/MS instrumentationallows minimal sample preparation and cleanups. TheMS/MS instrument was tuned and run in MRM mode.With continuous infusing of individual standards, eachtarget analyte showed a strong protonated molecular ion[M+H]* in positive ESI mode, and was used as the Q1MSprecursor ion for MRM experiments. Product ions wereselected using the Compound Optimization option fromthe instrument operating software. The three most intenseMRM transitions were selected as MRM candidates forfurther selectivity evaluation. The MRM selectivity wasevaluated by analyzing individual standards with respectto chromatographic separation and MS/MS detection withMRM candidate transitions. Figure 2. MRM chromatograms of five ethanolamines byRSLC-MS/MS on an Acclaim Trinity Pl column with 0.5 ppb ofeach analyte. The two final MRM transitions were selected thatshowed specific MS peaks with better intensity. It is worthnoting that interference was observed for both DEA MRMchannels from TEA and EDEA; and this can be explainedby the source region fragmentation of TEA and EDEA:[M-C,H,OH+H],and [M-C,H+H]t, respectively, whichhave the identical m/z as the precursor ion of DEA at106 m/z. This observation also indicated thatchromatographic separation for EDEA, TEA, and DEAare crucial for quantification accuracy. The scan timefor MRM scans was optimized to focus on quantitativeMRMs and MRMs with less intensity in order to achievebetter signal-to-noise ratio (S/N) for those mentionedMRMs, thus providing balanced overall methodperformance. The detailed MRM scan parameters arelisted in Table 1. The TurboV with ESI ionization sourceparameters were optimized by a series of runs withvarying parameter settings, and the optimum settings arelisted in the experimental section. Method Performance As mentioned earlier, the selectivity for this methodwas evaluated by observing the specific MRM peaks atthe specific retention times for each analyte. Althoughinterference was observed in both MRM channels forDEA, ([M-C,H,OH+H]+ from TEA, and [M-C,H +H]+from EDEA), as seen in Figure 3, these interferencepeaks were chromatographically separated and thusdid not affect the method selectivity for the accuratequantification of DEA. Carryover was evaluated byinjecting a reagent blank (DI water) after the highestcalibration standard at 20 ppb. No quantifiable peak wasobserved at the specific retention time for each analytethus indicating no observed carryover for this method. Linearity was evaluated and calibration curves weregenerated with duplicate assays of eight calibrationstandards from 0.05 ppb to 20 ppb using isotope labeledDEA-d, as the internal standard. Linear regression wasused to fit all experimental data with 1/x weightingfactor. Excellent linearity was achieved from 0.05 ppb(except EA from 0.2 ppb) to 20 ppb with correlation ofdetermination (r) greater than 0.999 for each analyte. Figure 4 shows the calibration curve for DEAas an example. Run-to-run precision and accuracywas evaluated by seven replicate assays of the 0.5ppb standard and measured by RSD and %Accuracy(calculated by Observed Amount/Specified Amount×100%). Method detection limit (MDL) was statisticallycalculated for each analyte using the standard deviationobtained from the seven replicate analysis of a 0.5 ppbstandard following this equation: MDL=sxt where sis the standard deviation and t is the Student's t at 99%confidence interval. Excellent precision was observedwith RSDs ranging from 3.26% (MDEA) to 5.49%(TEA).The calculated MDL ranged from 0.050 ppb (MDEA) to0.092 ppb (TEA). Figure 3. Chromatographically separated MRM interferencesfor DEA. Figure 4. Calibration curve ofDEA (106.1→88.0m/z) from 0.05to 20 ppb using isotope labeled DEA-d, as internal standard. Table 2. Calibration, RSD, Detection, and Reporting Limits Analytes Calibration r Mean Accuracy(%) RSD MDL LLOQ (ppb) S/N atLLOQ LRL EDEA v=4.64x+0.00242 0.9993 0.463 97.57 3.58 0.052 0.05 106.8 0.052 MDEA v=4.73x-0.0109 0.9996 0.484 96.77 3.26 0.050 0.05 54.5 0.050 TEA v=4.22x+0.169 0.9994 0.530 106.0 5.49 0.092 0.05 26 0.092 DEA v=0.703x+0.00759 0.9999 0.508 101.5 3.85 0.061 0.05 24.9 0.061 EA v=0.217x-0.00756 0.9990 0.510 101.9 5.34 0.085 0.20 13.1 0.20 All concentrations were in the unit of ppb. aCalculated based on seven replicate assays of a standard at 0.5 ppb. The lower limit of quantification (LLOQ) wasdetermined as the lowest calibration standard consistentlyshowing S/N greater than 10. The LLOQ for allanalytes were reported as 0.05 ppb, except EA, which was0.2 ppb. Figure 5 shows the MRM chromatograms ofeach analyte at LLOQ. The lowest reporting limit (LRL)for each analyte is the lowest concentration that can bereported by this method and was determined as the higherconcentration between MDL and LLOQ. The results formethod performance evaluations are summarized in Table 2. Figure 5. MRM chromatograms of five ethanolamines at LLOO. Analysis of Water Samples This method was used to analyze local municipalwater samples, a local creek water sample, and a Nevadalake water sample. Following the procedures in theExperimental section, these samples were spiked with theinternal standard and analyzed directly. None of the testedsamples showed concentrations of target analytes abovethe lowest reporting limit, and thus the local creek waterand the Nevada lake water were used as blank matricesto evaluate the method recovery. Each matrix was spikedwith ethanolamines at three levels: 0.5 ppb, 5 ppb, and20 ppb with three replicates at each level, and the internalstandard was spiked at 1 ppb. As summarized in Table 3, consistent recoverieswere observed for most analytes at different levels in twodifferent matrices. However, differences in concentrationand matrices showed significant effects on the recovery ofEA: 37.8% for 0.5 ppb vs 61.9% for 5 ppb and 70.0% for20 ppb in Matrix A; not detected for 0.5 ppb vs 20.2% for5 ppb and 22.8% for 20 ppb in Matrix B. Higher recovery was observed for samples spikedat higher levels, and prepared in Matrix A. It is worthnoting that the recovery for DEA was observed near100%, indicating the benefit of using isotope labeledanalogues as an internal standard correcting thematrix effect on that specific analyte. The deviation ofrecoveries from 100% indicates the different extents ofmatrix effects on each analyte, i.e., significant relativesignal enhancement for EDEA and MDEA. It was also noticed that EA exhibited short-terminstability, although the samples were placed inthe thermally controlled autosampler at 10 ℃ andsheltered from light. The duplicate assays of a batchof samples run on the following day of the samplepreparation showed no detectable EA, suggestingimmediate analysis after sample preparation isrequired. The stability of prepared sample in targetmatrices should also be evaluated to avoid degradation. Table 3. Recoveries of Ethanolamines in Two Water Matrices Analyte Matrix A: Local Creek Water Matrix B: Nevada Lake Water 0.5 ppb 5 ppb 20 ppb 0.5 ppb 5 ppb 20 ppb %RVYa %RSD %RVYa RSD %RVYa %RSD %RVYa %RSD %RVYa %RSD %RVYa %RSD EDEA 136.0 0.78 135.6 1.81 131.3 1.34 133.8 1.76 123.9 1.03 118.3 1.71 MDEA 145.9 1.87 137.2 1.83 142.2 2.34 140.7 0.70 127.5 1.97 127.8 2.01 TEA 83.9 2.08 86.8 1.83 95.0 1.58 79.3 4.92 85.4 0.81 93.7 0.82 DEA 98.5 1.54 101.8 0.52 100.2 0.29 103.3 3.89 100.5 0.83 101.8 0.28 EA 37.8 1.83 61.9 1.66 70.0 0.71 N/A N/A 20.2 8.65 22.8 1.08 CONCLUSION An RSLC-MS/MS method for quantitative analysisof five ethanolamines was developed and described. Byusing a mixed-mode analytical column and selectiveMRM MS/MS detection, this method showed significantimprovements over previously reported methods withminimum sample preparation, total chromatographicresolution, capability of sub-ppb level quantification,and high throughput. Application of this method to theanalysis of surface waters was demonstrated and showedno quantifiable amounts above the LRLs. Matrix effectsand recovery were evaluated using two surface watermatrices and the results indicated better quantitationaccuracy for DEA by using an isotope labeled analogueas an internal standard. 1.Conference on Disarmament. The Convention onthe Prohibition of the Development, Production,Stockpiling and Use of Chemical Weapons and ontheir Destruction. United Nations Document CD/1170, Geneva, Switzerland, 1992. 2. Black,R.M.; Read,R.W.,J. Chromatogr, A 1998,449,261-270. 3. Opresko,D.M.; Young, R.A.; Faust,R.A.; Talmage,S.S.; Watson, A.P.; Ross, R.H.; Davidson, K.A.; King,J., In Reviews of Environmental Contamination andToxicology, Vol.156, G.W. Ware, Ed. Springer, NewYork,NY, 1998,127-133. 4Edser, C., Focus on Surfactants 2004, 7, 1-2.5 Ohsawa, I.; Seto, Y.; J. Chromatogr, A 2006, 1122,242-248. 6. Lemire, S.W.; Barr, J.R.; Ashley, D.L.; Olson, C.;Hayes,Y., J. Anal. Toxicol. 2004, 28, 320-326. 7. Campo,P.; Suidan, M.; Chai,Y.; Davis, J. Talanta2010,80,1110-1115. 8. Peru, K.; Headley, J.; Doucette, W.; Rapid Commun.Mass Spectrom. 2004,18,1629-1634. 9. Dionex Document No. 065306-01, Product Manualfor Acclaim Trinity Pl Columns, available online athttp://www.dionex.com/en-us/webdocs/75675-Man-065306-01-ACCLAIM-TRINITY-P1-Feb09.pdf Acclaim, Chromeleon, and UltiMate are registered trademarks and DCMSLink and Trinity are trademarks of Dionex Corporation. Dionex Corporation North America Europe Asia Pacific 9001 1228 Titan Way U.S./Canada (847) 295-7500 Austria (43) 1616 51 25 Benelux (31) 20 683 9768(32)3 353 4294 Australia (61) 29420 5233 China (852) 2428 3282 India (91) 22 2764 2735 01 P.O. Box 3603 Denmark (45) 36 36 90 90 France (33) 1 39 30 01 10 Germany (49) 6126 991 0 Japan (81) 6 6885 1213 Korea (82) 2 2653 2580 Singapore (65) 6289 1190 Sunnyvale, CA South America lreland (353) 1644 0064 Italy (39) 02 51 62 1267 Sweden (46) 8 473 3380 Taiwan (886) 2 87516655 94088-3603 Switzerland (41) 62 205 9966 United Kingdom (44) 1276 691722 LPN2684 PDF 1/11 (408)737-0700 Brazil (55)11 3731 5140 www.dionex.com C2011Dionex Corporation uantitative Analysis of Nitrogen Mustard Hydrolysis Products as Ethanolamines pplication Note An RSLC-MS/MS method for quantitative analysis of five ethanolamines was developed and described. By using a mixed-mode analytical column and selective MRM MS/MS detection, this method showed significant improvements over previously reported methods with minimum sample preparation, totalchromatographic resolution, capability of sub-ppb level quantification, and high throughput. Application of this method to the analysis of surface waters was demonstrated and showed no quantifiable amounts above the LRLs. Matrix effects and recovery were evaluated using two surface water matrices and the results indicated better quantitation accuracy for DEA by using an isotope labeled analogue as an internal standard.
关闭-
1/8
-
2/8
还剩6页未读,是否继续阅读?
继续免费阅读全文产品配置单
赛默飞色谱与质谱为您提供《Hydrolysis Products中Hydrolysis Products as Ethanolamines检测方案(液相色谱仪)》,该方案主要用于废水中有机污染物检测,参考标准《暂无》,《Hydrolysis Products中Hydrolysis Products as Ethanolamines检测方案(液相色谱仪)》用到的仪器有null。
我要纠错
相关方案
 咨询
咨询