
方案详情文
智能文字提取功能测试中
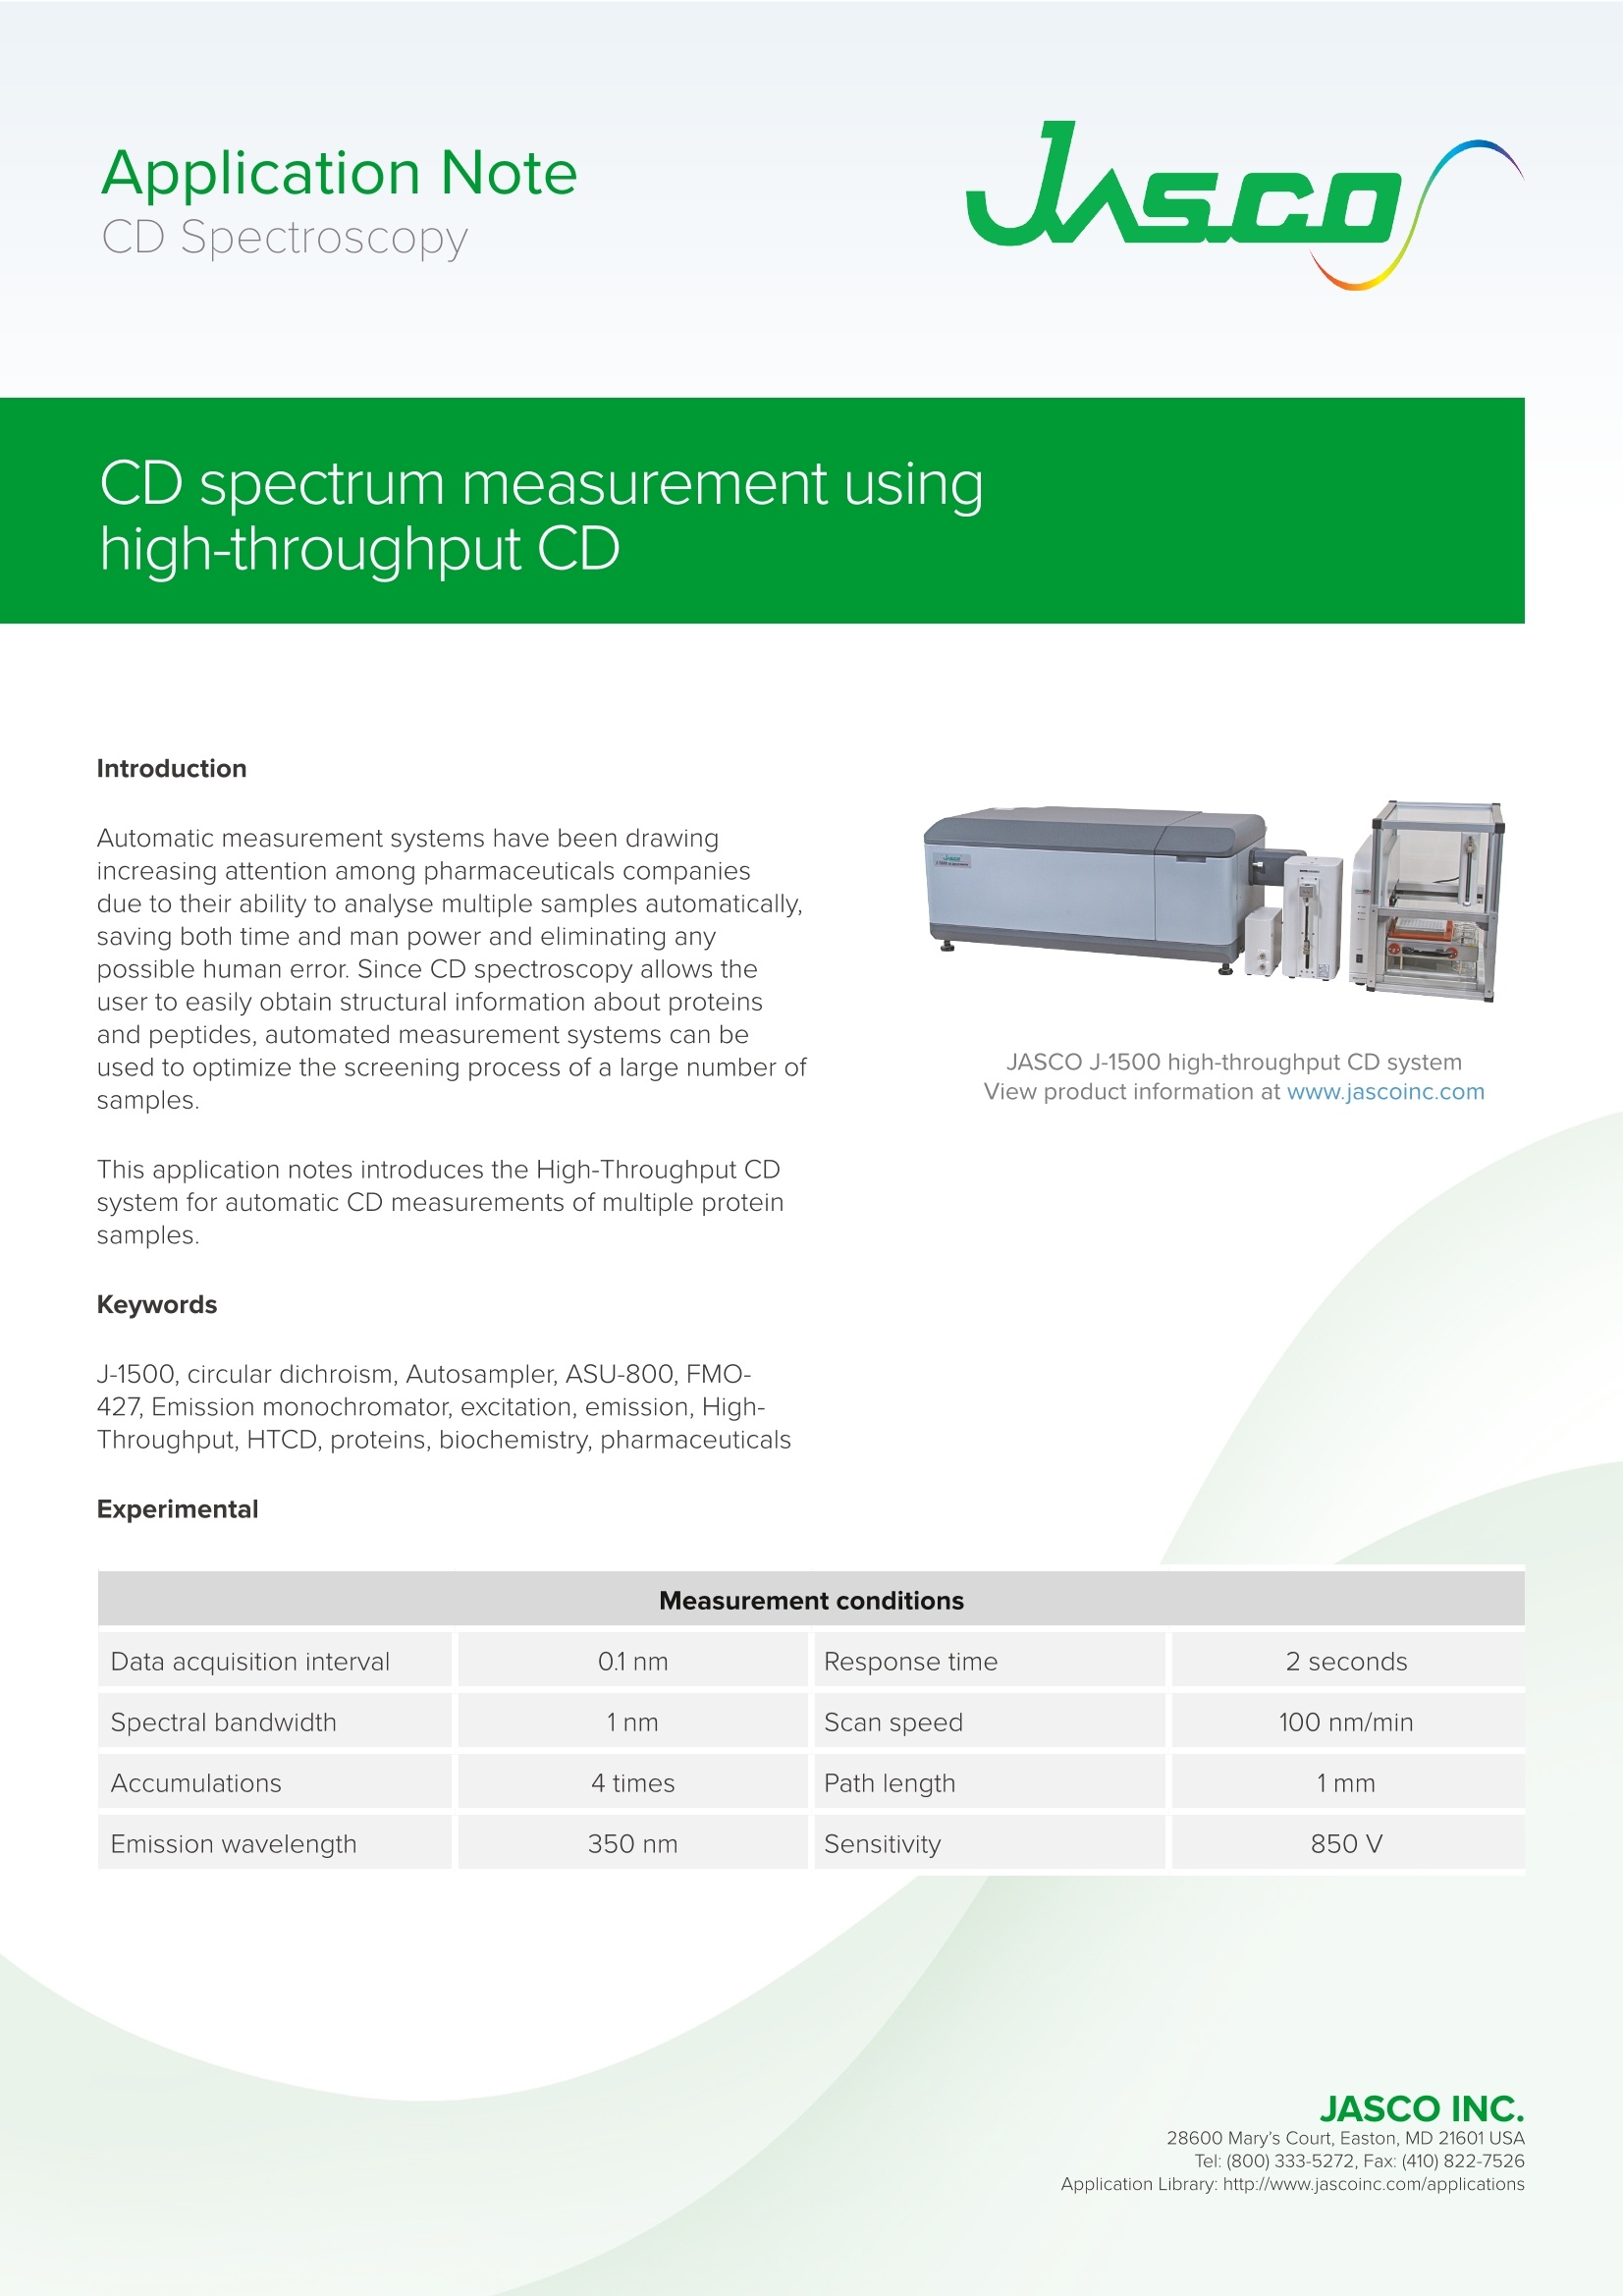
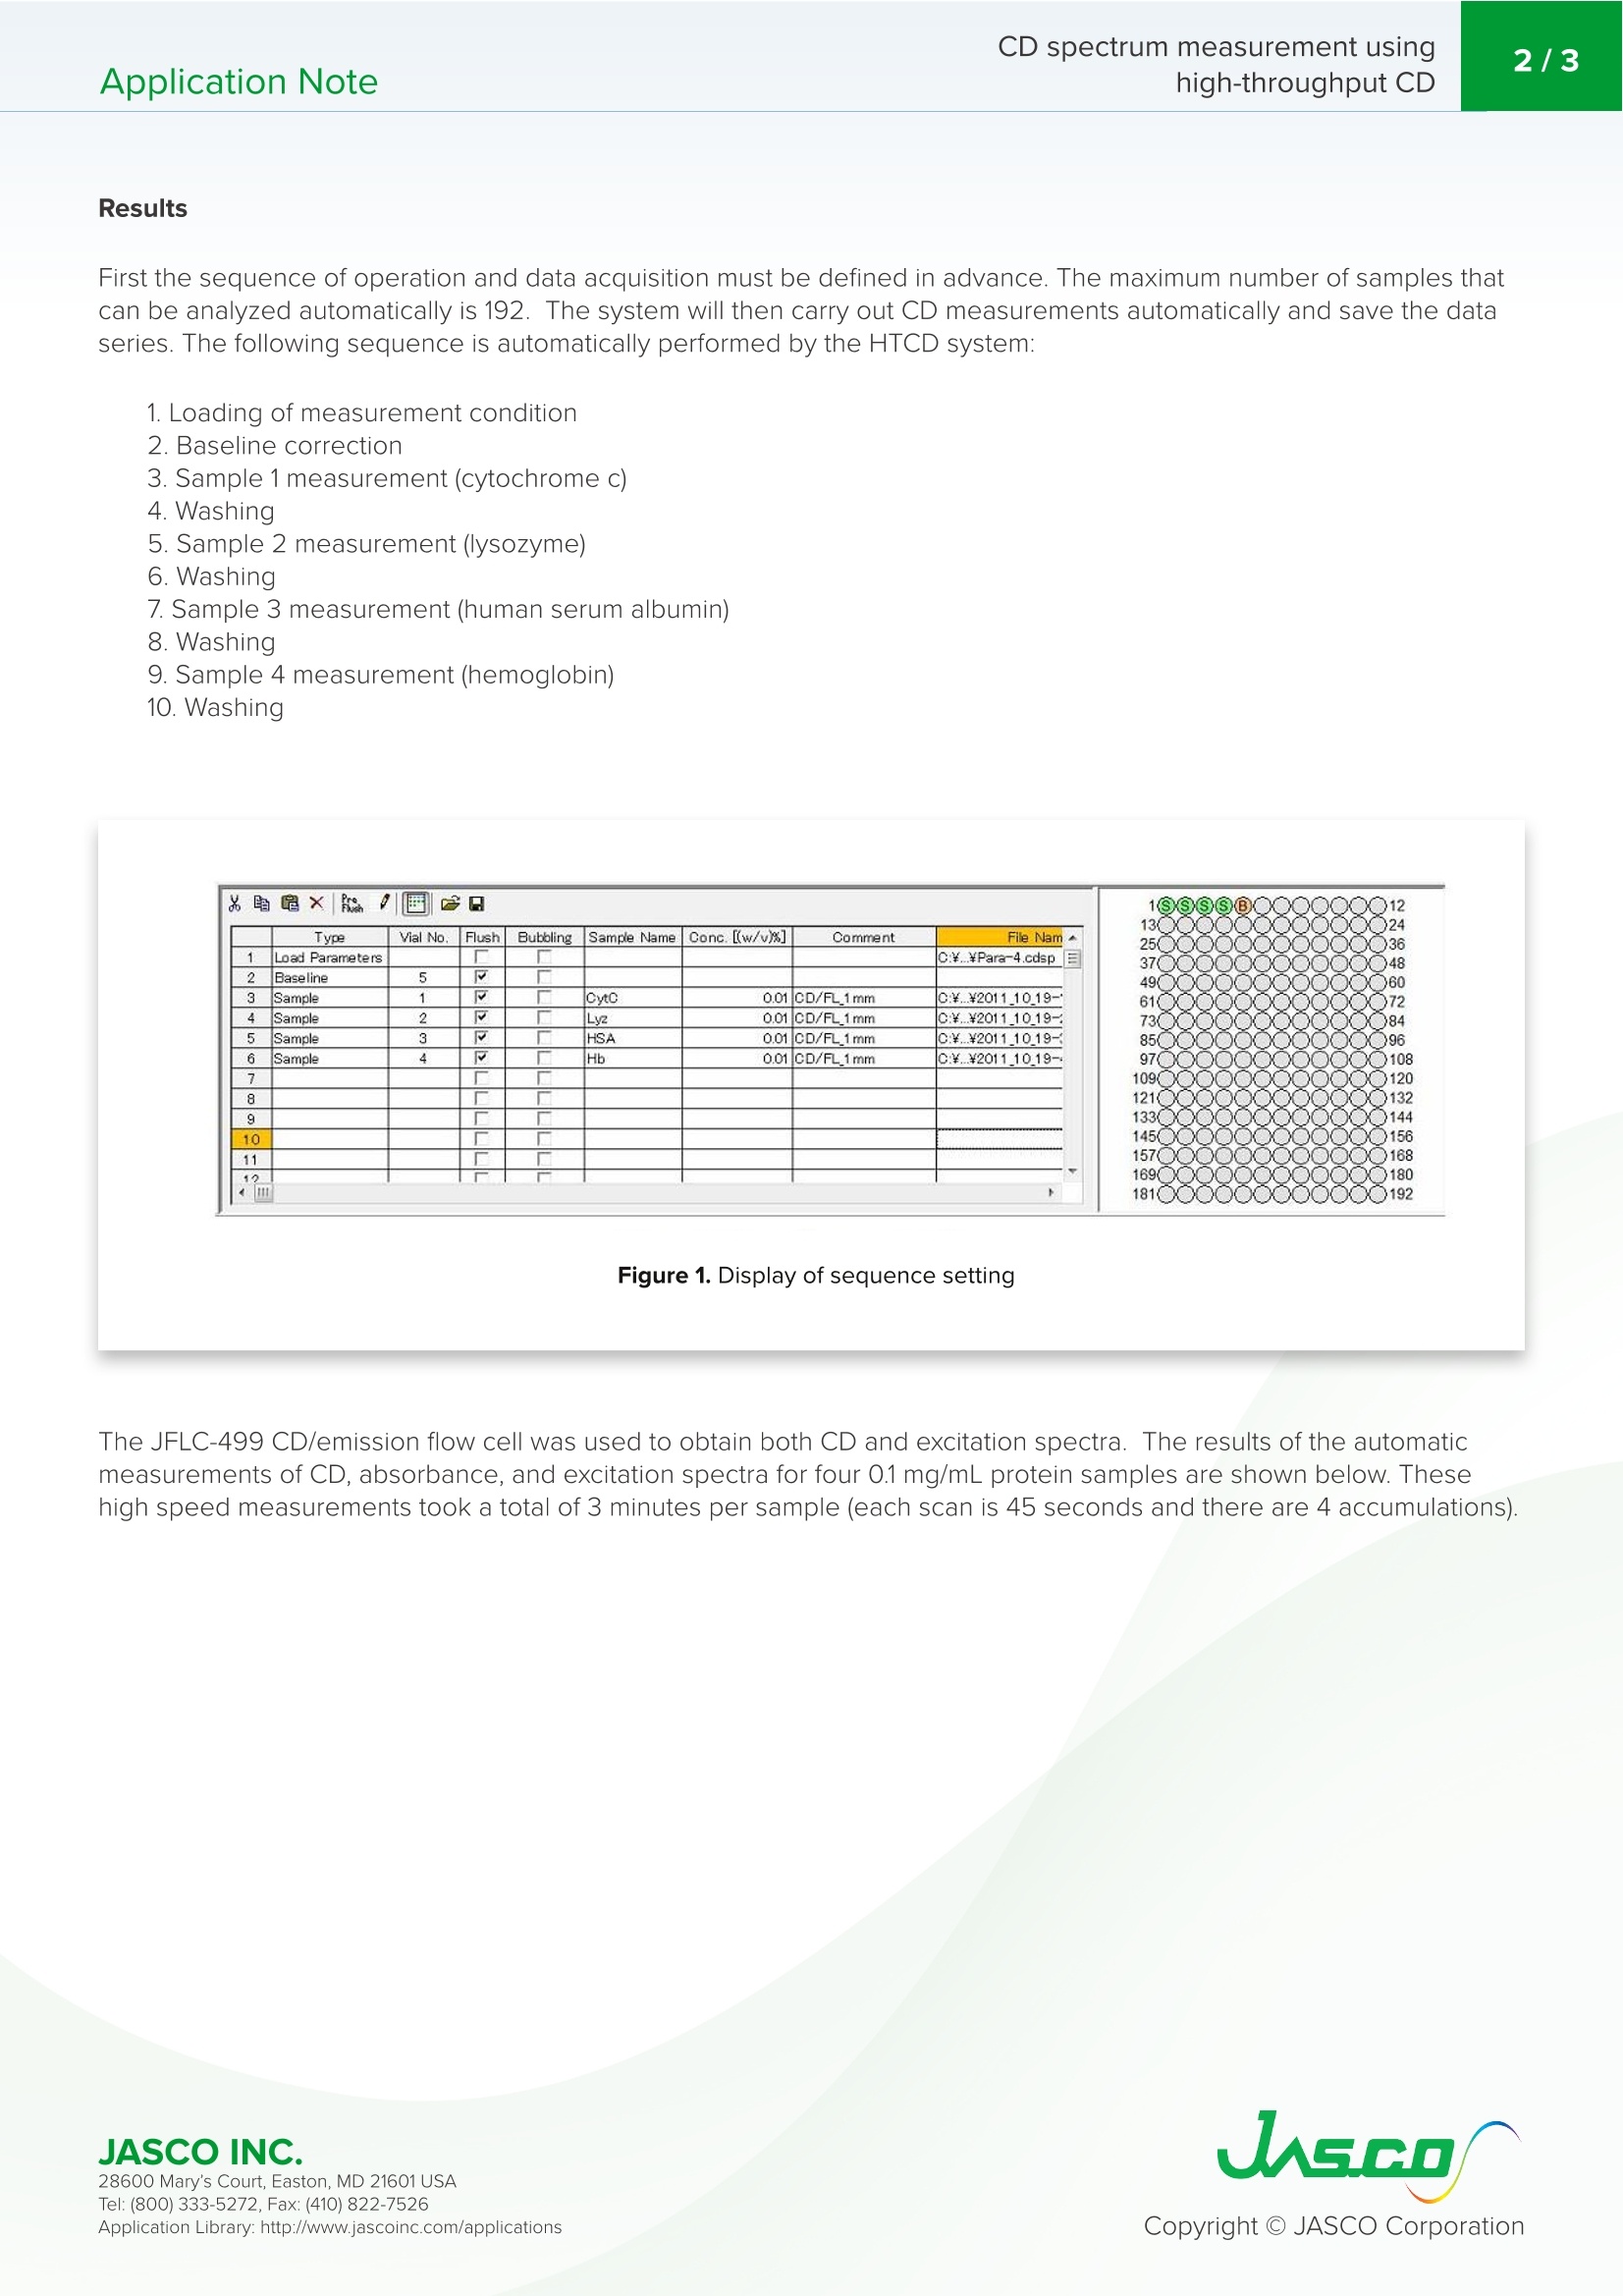
Application Note CD spectrum measurement usinghigh-throughput CD2/3Application Note CDD SSpectroscopy CD spectrum measurement using high-throughput CD Introduction Automatic measurement systems have been drawingincreasing attention among pharmaceuticals companiesdue to their ability to analyse multiple samples automatically,saving both time and man power and eliminating anypossible human error. Since CD spectroscopy allows theuser to easily obtain structural information about proteinsand peptides, automated measurement systems can beused to optimize the screening process of a large number ofsamples. JASCO J-1500 high-throughput CD systemView product information at www.jascoinc.com This application notes introduces the High-Throughput CDsystem for automatic CD measurements of multiple proteinsamples. Keywords J-1500, circular dichroism, Autosampler, ASU-800,FMO-427, Emission monochromator, excitation, emission, High-Throughput, HTCD, proteins, biochemistry, pharmaceuticals Experimental Data acquisition interval 0.1nm Response time 2 seconds Spectral bandwidth 1nm Scan speed 100 nm/min Accumulations 4 times Path length 1mm Emission wavelength 350 nm Sensitivity 850V Results First the sequence of operation and data acquisition must be defined in advance. The maximum number of samples thatcan be analyzed automatically is 192. The system will then carry out CD measurements automatically and save the dataseries. The following sequence is automatically performed by the HTCD system: 1. Loading of measurement condition 2. Baseline correction 3.Sample 1 measurement (cytochrome c) 4. Washing 5. Sample 2 measurement (lysozyme) 6. Washing 7. Sample 3 measurement (human serum albumin) 8. Washing 9. Sample 4 measurement (hemoglobin) 10. Washing Figure 1. Display of sequence setting The JFLC-499 CD/emission flow cell was used to obtain both CD and excitation spectra. The results of the automaticmeasurements of CD, absorbance, and excitation spectra for four 0.1 mg/mL protein samples are shown below. Thesehigh speed measurements took a total of 3 minutes per sample (each scan is 45 seconds and there are 4 accumulations) 28600 Mary’s Court, Easton, MD 21601 USA Figure 2. CD (top), absorbance (middle), and excitation(bottom) spectra of cytochrome c. Figure 4. CD (top), absorbance (middle), and excitation(bottom) spectra of human serum albumin. Figure 3. CD (top), absorbance (middle), and excitation(bottom) spectra of lysozyme. Figure 5. CD (top), absorbance (middle), and excitation(bottom) spectra of hemoglobin. Conclusion This application note demonstrates that high quality data can be measured for three different spectroscopy techniques(CD, absorption, and excitation) in a matter of minutes. The J-1500 coupled with the HTCD system allows over 100samples to be measured automatically without human operation, saving time and eliminating human error. JASCO INC. 28600 Mary’s Court, Easton, MD 21601 USA JASCO INC.Mary's Court, Easton, MD USATel: ( Fax: ( pplication Library: http://www.jascoinc.com/applications JASCO INC.Tel: ( Fax: ( pplication Library: http://www.jascoinc.com/applicationsCopyright O JASCO Corporation 这一应用说明表明,三种不同的光谱技术(CD、吸收和激发)可以在几分钟内测量到高质量的数据。J-1500与 HTCD系统可自动测量100多个样本,无需人工操作,节省时间,消除人为错误。
关闭-
1/3
-
2/3
还剩1页未读,是否继续阅读?
继续免费阅读全文产品配置单

JASCO 公司为您提供《蛋白质中圆二色光谱检测方案(圆二色光谱仪)》,该方案主要用于其他中圆二色光谱检测,参考标准《暂无》,《蛋白质中圆二色光谱检测方案(圆二色光谱仪)》用到的仪器有JASCO日本分光 圆二色光谱仪/圆二色谱 J-1500。
我要纠错
相关方案
 咨询
咨询