泰勒-库埃特湍流中速度场检测方案(CCD相机)
检测样品
航天
检测项目
速度场
关联设备
共3种
下载方案
方案详情文
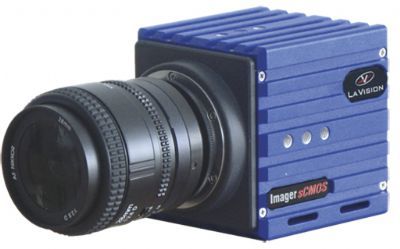
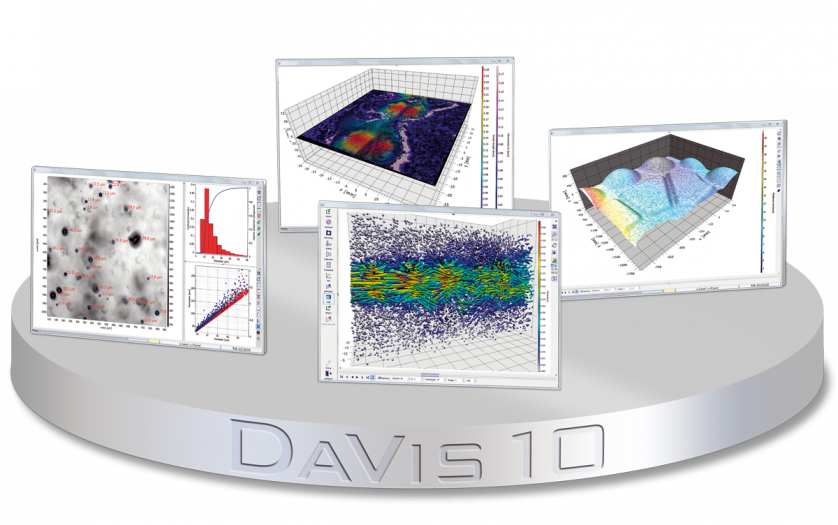
采用LaVision公司由科研型CMOS相机和DaVis软件平台构成的粒子成像测速系统,对在泰勒-库埃特湍流中,使用疏水内筒实现气泡减阻的方法进行了实验测量研究。
智能文字提取功能测试中
883 A61-1 883 A61-2P. A. Bullee and others J. Fluid Mech.(2020), vol. 883, A61.CThe Author(s) 2019This is an Open Access article, distributed under the terms of the Creative Commons Attribution-NonCommercial-ShareAlike licence (http://creativecommons.org/licenses/by-nc-sa/4.0/),which permits non-commercial re-use, distribution, and reproduction in any medium, provided the sameCreative Commons licence is included and the original work is properly cited. The written permission ofCambridge University Press must be obtained for commercial re-use.doi:10.1017/jfm.2019.894 Bubbly drag reduction using a hydrophobic innercylinder in Taylor-Couette turbulence Pim A. Bulleel2, Ruben A. Verschoof, Dennis Bakhuis,Sander G. Huisman, Chao Sun4,,+, Rob G. H. Lammertink2+and Detlef Lohse1,3,+ Physics of Fluids, Max Planck Center Twente for Complex Fluid Dynamics, MESA+ Research Instituteand J. M. Burgers Centre for Fluid Dynamics, University of Twente, P.O. Box 217,7500 AE Enschede, The Netherlands Soft matter, Fluidics and Interfaces, MESA+ Research Institute, University of Twente, P.O. Box 217,7500 AE Enschede, The Netherlands Max Planck Institute for Dynamics and Self-Organization, Am Fassberg 17, 37077 Gottingen, GermanyCenter for Combustion Energy and Department of Energy and Power Engineering, Tsinghua University,100084 Beijing, China (Received 7 June 2019; revised 28 August 2019; accepted 25 October2019) In this study we experimentally investigate bubbly drag reduction in a highly turbulentflow of water with dispersed air at 5.0×10100 cm²) usually have a random roughness structure(Hokmabad & Ghaemi2016). We refer the reader to the review article by Li et al.(2007) for a broader introduction to SH surfaces. An overview of various experimental and numerical studies in the laminar and lowReynolds number (Re) turbulent regime is given in the review article by Rothstein(2010). Under laminar flow conditions, the behaviour of SH surfaces is typicallystudied in microchannels. Drag reduction is then quantified by defining a slip length,a slip velocity or by a decrease in pressure drop over the channel (Tsai et al. 2009;Haase et al.2013; Park et al. 2015). As many industrial flows are highly turbulent,it is crucial to study the behaviour of such surfaces in the high Reynolds numberflow regime. For marine vessels for example, Reynolds numbers are of the orderof Re=0(10°). Superhydrophobic DR in laminar flow only depends on the geometry of theasperities on the surface that set the slip length and determine the slip velocity. Forturbulent flows, SH drag reduction also depends on the Reynolds number (Park, Park& Kim 2013). With increasing Re, the thickness of the viscous sublayer decreases,which is the most relevant length scale when comparing the geometric features of thesuperhydrophobic surface (Daniello, Waterhouse & Rothstein 2009). In the near-wallregion inside the boundary layer of a turbulent flow, the momentum transfer isdominated by molecular interactions, whereas the role of turbulent momentum transferis negligible. In other words, viscous stress dominates over Reynolds stress. Alteringthis region affects the entire boundary layer and hence the drag. The outer edge ofthe viscous sublayer is typically given by a distance yusl=5v/ur=58, from the wall,where v is the kinematic viscosity, and ur =√tw/p the friction velocity for wall shear stress tw and density p. The viscous length scale 8,=v/ur is the usual scalingparameter for non-dimensional+ization to vis’e+cous wall unit-s, indicated by a superscript+', e.g.yt=y/8.. We divide the literature on turbulent flow over hydrophobic surfaces into tworegimes: low (but still turbulent) Re turbulence (Re <10) and high Re turbulence(Re> 10). In these regimes, a difference between single-phase and two-phase flowcan be made, although most of the research so far has focussed on single-phase flow.Note that in single-phase flow, i.e. when no air is actively added to the workingliquid, air might be trapped by the SH surface when the surface is submerged inthe working liquid. In two-phase flow, gas is actively dispersed by (for instance air)bubble injection into the working liquid. An overview of the different surface parameters found in the literature focussing onDR with SH surfaces is shown in table 1. TABLE 1. Overview of the literature on drag reduction of turbulent flows over superhydrophobic surfaces, illustrating different surface designparameters k+ and w+ corresponding to the largest drag reduction found by different authors. The horizontal line separates the low Returbulence from the high Re turbulence as introduced in 82. Author Phase Flow type SH surface Re DRmax Surface roughness Srinivasan et al. (2011) Single Taylor-Couette Random 1.6x10-8.0×104 22% k+=1.4" w+=2.54 Rastegari & Akhavan (2018) Single Channel (LB) Longitudinal grooves 3.6×10 61.1% w+=8 .Daniello et al. (2009) Single Channel Ridges 3.0×10³-6.0×10 50% w+> 1 Martell, Perot & Rothstein (2009) Single Channel (DNS) Ridges 4.2x10³a 40% w+ as large Posts as possible Rosenberg et al. (2016) Single Taylor-Couette Triangular ridges 6.0×10³-9.0×10³ 10% k+=3.9 w+=5.6 Van Buren & Smits (2017) Single Taylor-Couette Ridges 6.0×10³-1.0×10⁴ 9% w+=35 Park et al. (2013) Single Channel (DNS) Ridges 4.2×10³-1.7×10⁴ 90% w+=100 Gose et al. (2018) Single Channel Random 1.0×10⁴-3.0×10⁴ 90% k+<0.5cd Panchanathan et al.(2018) Single Taylor-Couette Square pillars 4.7×10+ 3% k+=13.6" w+=27.14 Du et al. (2017) Two Channel Random 1.2×x10 20% Not enough info given Fukuda et al.(2000) Two Channel Random 5.0×10⁴-4.0×10 50%° No info given Flat plate 3.0×10-1.7x10 50 %° Ship model 9.0×10-8.0×10 20% Aljallis et al.(2013) Single Flat plate Random 3.0×10-3.0×10 30% No info given Ling et al. (2016) Single Channel Random + ridges 1.0×10° 36% k+=0.68C Park et al. (2014) Single Channel Ridges 1.0×10-1.0×10 75% w+ <1 Reholon & Ghaemi (2018) Single Cylindrical object Random 5.0×10-1.5×10 36% k+=0.5 Bidkar et al. (2014) Single Channel Random 1.0×10-9.0×10 30% k+<0.5 “Derived from data in paper. Normalized with value for no-slip surface. Optimal value obtained from parameter sweep. Additional surface characterization. ‘Decreasing with Re /No DR for ReL>10°. 2.1.1. Low Re turbulence Using channel flow, Daniello et al. (2009) studie1daa variety of SH surfacesconsisting of streamwise-aligned ridges, with varying ridge spacing w+=1-4. Overthe whole range of 3×10°0 Hz), bubbles are formed and distributed in the radialand axial directions over the gap due to turbulent mixing. PIV measurements can be doneonly when there are no bubbles present in the working liquid (二=0%). The PIV lasersheet is placed at cylinder mid-height and the flow is observed through a window in thebottom plate using a mirror and a camera. By partly filling the apparatus, as in figure 1, we vary the volume fraction of aira in the working fluid from 0% to 6%. The turbulence mixes the air and water,generating bubbles that are distributed over the height and over the gap between thecylinders (van Gils et al. 2013). 3.2. Torque measurements The inner cylinder is composed of three sections. The torque exerted by the fluid onthe inner cylinder is measured using a Honeywell 2404-1K hollow reaction torquesensor that is placed inside the middle section of the inner cylinder, as indicated infigure 1. Only the torque on the middle section of length Lmid=0.536 m is taken intoaccount to reduce end-plate effects between the rotating lid of the inner cylinder andthe stationary lid of the outer cylinder. We express the torque in non-dimensional formusing the skin friction coefficient where T denotes the torque, p andv are the density and kinematic viscosity,respectively, of the working fluid. The drag reduction for the hydrophobic coating and the hydrophilic reference isdetermined using (3.3). This shows the influence of adding bubbles to the flow on the drag. The differencein drag reduction ADR between a hydrophobic inner cylinder (IC) and a hydrophilicIC is defined as 883 A61-11 In order to provide insight into the influence of the hydrophobic IC on the flow, wedefine a net drag reduction as Here, Cf,hydrophobic (a) is the skin friction coefficient for the hydrophobic IC anddifferent values of a, and Cr,hydrophilic(c=0) is the skin friction coefficient for thesmooth hydrophillic inner cylinder, without air bubbles present in the flow (a=0).In (3.3) the focus is only on the influence of bubbles on the drag, with either ahydrophobic or a hydrophilic IC, whereas (3.5) show the influence of both dragreducing measures: bubbles and a hydrophobic coating. 3.3. Hydrophobic coating In the hydrophobic case, the IC of the T’C is fully coated with a 3M MembranaAccurel@ PP 2E HF flat sheet membrane. This porous hydrophobic polypropylenematerial is commercially available in the large quantities that are needed to cover thecomplete IC. This coating is supplied on rolls that have a width of approximately27 cm. It is attached to the inner cylinder using double-sided adhesive tape. Fromvisual inspection it is estimated that 99 % of the IC is covered by the coating, seefigure 4. We used a Dataphysics OCA 15EC device to measure the contact angle hysteresisfor both the hydrophobic coating and the reference case, which is the hydrophilic,uncoated steel IC. The hydrophobic coating has advancing and receding water contactangles of 152°±2°and 120°±5°,respectively. For the hydrophilic IC, an advancingcontact angle of 93°±2° was found. The receding contact angle is set at 10°, whichis the lowest angle the set-up could measure. 3.4. Roughness The machining process to fabricate the standard hydrophilic IC givesalisurfaceroughness of kic=1.6 um. The viscous length scale 8, is derived from the measuredtorque data, as discussed in Huisman et al. (2013). For the maximum Reynoldsnumber Remax = 1.8 ×10° used in this research, the viscous length scale reachesits lowest value of 8, = 1.9 um. The resulting roughness in wall units k.~0.8.Therefore, the uncoated hydrophilic IC can be assumed to be a hydrodynamicallysmooth surface. The average roughness of the coating is analysed from its pore size using 24different scanning electron microscope (SEM) images, made using three differentmagnifications, as shown in figure 2. The coating consists of an isotropic sponge-likestructure, meaning that the cross-section looks similar to the top and bottom surfaces.Therefore we use SEM images of the top surface to evaluate the size and roughnessof the pores. The SEM images show a distribution of pore sizes, in the range of1-10 um. The pores that correspond to the smaller length scale are found in regionsseparated by pores of the larger length scale. The size distribution is quantified withthe image processing program ImageJ,using edge detection of the thresholded image(Analyse Particles tool). Eight different images of the smallest magnification wereused for this. The images were pre-processed by subtracting a sliding backgroundand by applying a local mean threshold algorithm. Erosion and dilation were usedto remove small scale noise. It is difficult to define the error for the pore size P.A. Bullee and others FIGURE 2. SEM photos of the side of the coating that is exposed to the flow. (a) Focuseson a region composed of smaller pores. (b) Shows a region with larger pores. distribution, since it is difficult to evaluate the edge of a pore from the perspectiveof the flow. For instance, in figure 2, when inspecting the large pores at highestmagnification, we see thin thread-like fibres that span across a pore. Whereas in theimage analysis this might be detected as an edge, the flow might experience thisdifferently. However, from the SEM images and the pore size distribution it is clearthat multiple roughness length scales are present on the surface of the coating. Hence,dependent on Re, a larger or smaller fraction of the surface plays a role in influencingthe flow. The resulting distribution of binned pore sizes is shown in figure 3. Thecombined area of all pores with diameter D, over the total area, the fraction A/Ao, isplotted versus Dp. A maximum is found at Dp=2.5 um, although the larger lengthscales that are more relevant to the flow are also found. 3.5. Experimental procedure During a measurement period of one hour and a half, the IC was accelerated in stepsfrom 5 to 18 Hz, corresponding to a range of Re between 5 × 10° and 1.8 × 10,while continuously measuring the torque exerted by the fluid on the inner cylinder.Every variation of a hydrophobic IC with α>0% was measured four times. Betweenchanging the volume per cent of air a, the reference case of a=0% air is measuredtwice, to account for changes to the coating caused by the flow itself. An overviewof the measurements is shown in order of execution in table 2. 3.6. Flow visualization A Nikon D800E camera was used to capture still images of the flow. This providesinsight into the presence of an air plastron: air captured by the coating is visiblein the form of a silvery reflection on the surface (Shirtcliffe et al. 2006; Danielloet al. 2009; McHale et al. 2009; Poetes et al. 2010; McHale, Flynn & Newton 2011;Dong et al. 2013; Park et al. 2014, 2015; Saranadhi et al. 2016). This can be seen infigure 4, where the highlighted area points out locations where the incident light is of Bubbly DR using a hydrophobic IC in TC turbulence FIGURE 3. Pore size diameter D, (roughness) distribution of the coating as a fraction ofthe coverage A of the total area of the coating Ao. A range of length scales are observed,corresponding to the different regions identified in figure 2. The equivalent circle diameterhas been used as a measure of the size Dp=2√Ap/n. Surface a (%) ωi (Hz) Measurements Hydrophobic 0 5-18 2 2 5-18 4 0 5-18 2 4 5-18 4 0 5-18 2 6 5-14 4 0 5-18 2 Hydrophilic 0 5-18 2 2 5-18 3 4 5-13.4 3 4 15.8-18 3 6 5-14 3 TABLE 2. Overview of the measurement parameter space, in order of execution. Betweenchanging the volume percentage of air a, the reference case of a=0% air was measuredtwice, to account for changes to the coating caused by the flow itself. Deviations from thestandard frequency range ωi=5-18 Hz were the result of heavy vibrations in the system,forcing us to skip a certain frequency range. the right angle to see the plastron. It was found that an air plastron was present duringthe measurements featuring a hydrophobic IC. To test the stability of the plastron andforce the surface in a wetted state, the surface tension was lowered by adding TritonXsurfactant whilst rotating the inner cylinder at Re=1.0×10° with single-phase flowconditions. From image analysis it was determined that after 1.5 ×10⁻⁴ mol 1-1TritonX was added, the silvery reflection completely disappeared. At this concentrationof TritonX the surface tension is approximately 35 mN m- (Gobel & Joppien 1997).So both surface tension and Laplace pressure are approximately half the values asthose for pure water. P. A. Bullee and others FIGURE 4.Digitally enhanced photograph of the inner cylinder, covered with thehydrophobic coating and visible through the transparent outer cylinder. It is estimated that99 % of the inner cylinder is covered by the hydrophobic coating. The silvery reflection,which is typically associated with the presence of an air plastron, is visible as a darkershaded region. This plastron can only be observed under certain angles of incident ligh.t.The curved surface of the inner cylinder explains why the plastron is only visible in anarrow vertical band. 3.6.1. Velocity profile measurements Particle image velocimetry was used to obtain local flow field information. Wemeasured the velocity field in the (r,0) plane; ue= ue(r, 0, t) and ur=ur(r, 0, t).This can only be achieved for single-phase flow with a=0, since the air bubblesotherwise scatter the light significantly. The laser light sheet (Quantel Evergreen145 laser, 532 nm) used to illuminate the seeding particles added to the flow(Dantec fluorescent polyamide,with a distribution of diameters ≤ 20 pm)wasplaced at mid-height of the cylinder. Images were captured using a LaVision sCMOS(2560 ×2160 pixel) camera through the window in the bottom plate of the set-up.Figure 1 gives a schematic overview of the measurement set-up. Average velocityfields were calculated from 1000 image pairs using LaVision DaVis software in amulti-pass method, starting at a window size of 64× 64 pixel decreasing to a finalsize of 24 × 24 pixel with 50% overlap. A calibration is required to transform pixelsto metres. To this end, image analysis is used to locate the edges of the inner andouter cylinders. Since the measured fields are in Cartesian coordinates, a coordinatetransformation is necessary to obtain finally the radial and azimuthal velocities u, andu in the cylindrical coordinate system. 4. Results and discussion 4.1. Torque measurements First, the results of the torque measurements in single-phase flow are presented anddiscussed, where drag reduction is purely the result of a hydrophobic surface capturing FIGURE 5. (a) Plot of the drag reduction as in (3.5) versus Re, with a=0 for thehydrophobic inner cylinder. (b) Evolution of the thickness of the viscous sublayer (y+=5),the viscous length scale (y+=1) and half the viscous length scale (y+=0.5) with Re. Thedesign parameters w+<1 and k+<0.5 for the hydrophobic surface are suggested by Parket al. (2014) and Bidkar et al. (2014) respectively to result in drag-reducing behaviourof the surface and are shown here as a reference for the reader. These values are derivedfrom the torque measurements and give therefore an averaged, global value. From figure 6we find that for our lowest Re tested, the majority of the roughness length scales is belowk+=1 and part of it is below k+=0.5. The DR plot however shows a nearly constantincrease of the drag by approximately 14 % over the whole range of Re measured. an air plastron. Second, we show the results for two-phase flow, where air bubbles areadded to the flow, that provide bubbly DR and might also add to the stability of theair plastron. 4.1.1. Single-phase flow In the top of figure 5, the drag reduction, as defined in (3.5), is plotted versusRe, for the hydrophobic inner cylinder with a=0. This shows an increase in thedrag of approximately 14% over the whole range of Re measured. The bottom figureshows the evolution of the thickness of the viscous sublayer (y+=5), the viscouslength scale and the design parameter suggested by Park et al. (2014) (y+=1), andthe design parameter suggested by Bidkar et al. (2014)(y+=0.5), with the Reynoldsnumber. In figure 6 we show the roughness of the surface expressed in wall units forfour different values of Re: the minimum, the maximum and two intermediate values,for which we use the same data as in figure 3. For the lowest Re=0.5 ×10°, themajority of the roughness length scales is less than k+=1 and part of it is even lessthan k+=0.5. However, over the whole range of Re measured we find a constantincrease of the drag of approximately 14%. For a rough, wetted surface, an increase P. A. Bullee and others FIGURE 6. Roughness distribution of the surface as coverage fraction of the total areaA/Ao, expressed in wall units for four different values of Re. Apart from the maximumand the minimum values of Re used in this research, the normalized roughnesses for twointermediate values of Re are shown as well. The wall unit normalization is obtained usingdata from the torque measurements that give an averaged, global value of the wall shearstress. 4.1.2. Two-phase flow In figure 7, DR is shown as defined in (3.3), comparing results for a hydrophobicinner cylinder to a hydrophilic inner cylinder, plotted versus Re. For both hydrophobicand hydrophilic cases, a=0% is the reference case for determining the level of dragreduction that results from the introduction of bubbles (>0%) to the flow. As anadditional effect, the introduction of air bubbles to the working liquid might also lead FIGURE 7. Plot of the drag reduction based on skin friction coefficient C as definedin (3.3) versus Re. Compared to figure 9, the drag reduction here is determined usingthe same IC as used for the α>0 measurement (so either hydrophobic or hydrophilic)with α=0 (Cf,o), whereas in figure 9 the reference is the hydrophilic IC with a=0.A more efficient bubbly drag reduction mechanism is found for the hydrophobic coatingwhen the void fraction α≥4%. For α=2% roughness effects dominate, resulting in lessoverall DR. Only every second data point is shown to improve readability of the plot. Theshaded regions represent the spread in the data. The size of the error bars based on theaccuracy of the torque sensor is smaller than the marker size. Due to heavy vibrationsin the set-up resulting from a non-symmetric distribution of air, no data were acquired inthe region between Re=1.3×10° and Re=1.6×10° for α=4% and for Re > 1.4×10°whenα=6%. to enhanced stability of the air plastron (Lv et al. 2014). With increasing Re, moreDR is found for all measurements. This is in line with the previous findings (van denBerg et al. 2005; van Gils et al. 2013; Spandan et al. 2018). Comparing the hydrophobic IC to the hydrophilic IC, more bubbly DR is found(figure 7) over nearly the whole range of Re when α≥4%. Only when Re <7×10,a slight increase of drag is found for o=6%. In this range of low Re, the uncertaintyof the torque sensor is the highest, as can be seen from the shaded areas in figure 7that give an indication of the repeatability of the experiments by showing the spreadin the data by comparing the extremes of individual measurements. For the smallestamount of air added, a=2 %, the hydrophobic IC gives more DR compared to thehydrophilic IC up to Re=10. For larger Re, between 1.0×10° and 1.8 ×10°, thehydrophobic IC gives less DR compared to the hydrophilic IC. We explain the difference between α=2% and α≥4% in figure 7 as a resultof two competing effects: (i) a more effective bubbly drag reduction in the presenceof a hydrophobic wall, and (ii) a drag increase due to the roughness of this samehydrophobic wall. When the thickness of the viscous sublayer, yusl=5y+ decreaseswith increasing Re, a larger fraction of the pores on the surface of the hydrophobicIC are of a length scale relevant to the flow, as can be seen in figure 5. The balancebetween these two competing effects determines whether the bubbly DR is moreeffective when using a rough hydrophobic IC compared to a smooth hydrophilic IC.For larger void fractions α≥4%, the more effective bubbly DR dominates, resultingin more overall DR. P. A. Bullee and others FIGIURRE 8. Plot of ADR=DRhydrophobic-DRhydrophilic from figure 7 versus Re. For o=2,ADR decreases with increasing Re, owing to the influence of roughness. For a≥4, ADRshows an increase with Re, meaning that the effect of increase in bubbly drag reductiondue the hydrophobic coating is stronger than the effect of roughness. Figure 8 shows the difference ADR between hydrophobic and hydrophilic casesfrom figure 7, as defined in (3.4). The difference in ADR between α =4%%andα=6% in figure 8 is small compared to the difference between α=2% and o=4%,or α=2% and =6%. This suggests that the influence of the hydrophobic IC onthe bubbly DR is limited, i.e. that a minimum amount of air is required to effectivelyreduce the drag - here =4% -but further increasing a will not result in an evenstronger influence of the hydrophobic IC on the bubbly DR. Nor does ADR increasewith Re for Re >10° and α≥4%, but rather it levels off and starts to decrease.This indicates that,O o1f the two effects, the more effective DR from the hydrophobicwall initially grows faster with Re, until ADR is maximum. With further increasingRe, around Re=1.1×10, the balance starts to tilt and the drag increase from theroughness is now the faster growing effect, indicated by the negative slope of ADRfor α=4% and α=6% in figure 8. It is tempting to attribute this to wetting of thecoating, caused by the wall shear stresses that become larger with Re. However, ifthis were the case, a clear difference would be visible between the initial and repeatedmeasurements for the same a, since the wetted state is the energetically more stableone. It is safe to assume that if the coating - or part of it - is wetted, it will nottransit back to a non-wetted state between measurements. The reason for the changein balance should therefore be sought elsewhere. The definition of DRnet in (3.5) is used in figure 9 to study the combined effectof both air bubbles (a>0%) and a hydrophobic IC, using the hydrophilic IC witha=0 % as a reference for all cases. Compared to figure 7, all data obtained using thehydrophobic IC are shifted downwards by approximately 15 %. For the lines a=0 %and a=2%, the shift in DRnet is nearly constant, whereas for α=4% and α=6%the difference in DRnet goes down with increasing Re, owing to the same competingmechanisms as discussed previously. Nonetheless, it is clear from figure 9 that, for allvalues of a, the use of a hydrophobic IC results in a less efficient net DR compared toa hydrophilic IC. The introduction of the hydrophobic coating adds roughness to theotherwise hydrodynamically smooth hydrophilic surface, which in this case explainsthe significant change in the net drag force. FIGURE9. Plot of the net drag reduction (DRnet) based on skin friction coefficientC (3.5) versus Re. Compared to figure 7, the drag reduction here is determined using thehydrophilic IC with a=0 as the reference (Cf,0,hydrophilic), whereas in figure 7 the referenceis the same IC as used for the α>0 measurement (so either hydrophobic or hydrophilic)with a=0. For all values of a, the use of the coating results in less efficient net DRcompared to an uncoated cylinder. Only every second data point is shown to improvereadability of the plot. The shaded regions represent the spread in the data. The size ofthe error bars based on the accuracy of the torque sensor is smaller than the marker size.Due to heavy vibrations in the set-up resulting from a non-symmetric distribution of air,no data were acquired in the region between Re=1.3×10°and Re=1.6×10° for α=4%and for Re>1.4x10⁶ when α=6% 4.2. Repeatability and measurement errors of torque measurements For the highest Reynolds number achieved in this research, namely Re=1.8×10°, theshear stress at the surface tw=T/2urLmid is 274 Pa. To ensure that the hydrophobiccoating applied to the IC is not adversely affected by this high shear stress,wemeasured the a=0% reference measurement twice after every series of a>0%measurements, as indicated in table 2. The skin friction coefficients found in the=0% measurements have a spread of 3 %. This spread shows no trend, whichsuggests that the properties of the coating remain constant throughout the experiments.This was also confirmed by visual inspection of the coating and by comparison ofSEM images of the coating taken before and after the measurements. The repeated measurements of a=2%,4% and 6% show a spread in skin frictioncoefficient of 2%, 4% and 2%, respectively, again suggesting good measurementrepeatability. The accuracy of the torque sensor is rated by the manufacturer to be±0.25% of its maximum rated output. Error regression analysis has shown that thelargest error in figures 7 and 9 is slightly smaller than the markers used. The dataspread is reflected by the shaded regions in figures 7 and 9. These regions are derivedby using the minimum and maximum values from the repeated measurements for Cr,oand Cf,a. 4.3. Velocity profiles Shown in figure 10 are the results for the velocity profiles from the PIV measurements.Plotted are the azimuthal velocities normalized with the velocity of the inner cylinder P. A. Bullee and others (r-r;)/d FIGURE 10. Plot of azimuthal velocity normalized with inner cylinder velocity ug/u;versus the normalized gap width between inner and outer cylinder (r-r)/d. The workingfluid is without air, so a=0%. Compared is the rough hydrophobic coating with thesmooth hydrophilic steel inner cylinder. The hydrophilic data are provided by Huismanet al. (2013) using the same experimental set-up. The inset shows the region close to theinner cylinder. ue/ui, versus the normalized position between the inner and outer cylinder (r-r;)/d,for different Reynolds numbers. We compare the hydrophilic IC to the hydrophobicIC, for a single-phase flow with α=0%. A clear difference is seen in the region closeto the IC, with larger velocities for the hydrophobic IC compared to the hydrophilicIC at similar Reynolds numbers. This is attributed to the larger roughness of thehydrophobic IC compared to the hydrophilic IC. A rougher surface can transport moreenergy to the flow compared to a smooth surface, resulting in larger velocities in thenear-wall region for the same driving of the flow (Zhu et al. 2018). In other flowconfigurations, when the wall is not used to drive the flow, lower velocities will befound for more rough surfaces (Flack & Schultz 2010; MacDonald et al. 2016; Busseet al. 2017). For larger Re we find larger velocities close to the IC, indicating thatthe effect of the roughness is stronger with larger Re. This reflects the reduction inthickness of the viscous sublayer, which results in a larger fraction of the small scaleroughness (pores) of the hydrophobic IC becoming a relevant length scale to the flow. 5. Summary and conclusions The influence of a hydrophobic wall on drag reduction was studied in a highlyturbulent Taylor-Couette flow. We applied a hydrophobic coating to the otherwisesmooth and hydrophilic inner cylinder (IC) of the Taylor-Couette set-up. Insingle-phase flow, we found a constant increase in drag of approximately 14 %for the rough hydrophobic wall compared to the smooth hydrophilic wall over thewhole range of Reynolds numbers 5.0×10
关闭
-
1/24
-
2/24
北京欧兰科技发展有限公司为您提供《泰勒-库埃特湍流中速度场检测方案(CCD相机)》,该方案主要用于航天中速度场检测,参考标准《暂无》,《泰勒-库埃特湍流中速度场检测方案(CCD相机)》用到的仪器有Imager sCMOS PIV相机、德国LaVision PIV/PLIF粒子成像测速场仪、LaVision DaVis 智能成像软件平台。
我要纠错







 咨询
咨询