方案详情文
智能文字提取功能测试中
https://ntrs.nasa.gov/search.jsp?R=201500021112019-11-28T19:05:33+00:00ZNASA/TM-2015-218475AIAA-2014-3435 NASA STI Program . .. in Profile Fundamental Study of a Single Point Lean DirectInjector Part I: Effect of Air Swirler Angle andInjector Tip Location on Spray Characteristics Sarah A. Tedder, Yolanda R. Hicks, Kathleen M. Tacina, and Robert C. AndersonGlenn Research Center, Cleveland, Ohio Since its founding, NASA has been dedicated to theadvancement of aeronautics and space science. TheNASA Scientific and Technical Information (STI)program plays a key part in helping NASA maintainthis important role. The NASA STI Program operates under the auspicesof the Agency Chief Information Officer. It collects,organizes, provides for archiving, and disseminatesNASA's STI. The NASA STI program provides accessto the NASA Aeronautics and Space Database andits public interface, the NASA Technical ReportsServer, thus providing one of the largest collectionsof aeronautical and space science STI in the world.Results are published in both non-NASA channelsand by NASA in the NASA STI Report Series, whichincludes the following report types: TECHNICAL PUBLICATION. Reports ofcompleted research or a major significant phaseof research that present the results of NASAprograms and include extensive data or theoreticalanalysis. Includes compilations of significantscientific and technical data and informationdeemed to be of continuing reference value.NASA counterpart of peer-reviewed formalprofessional papers but has less stringentlimitations on manuscript length and extent ofgraphic presentations. TECHNICAL MEMORANDUM. Scientificand technical findings that are preliminary orof specialized interest, e.g., quick releasereports, working papers, and bibliographies thatcontain minimal annotation. Does not containextensive analysis. CONTRACTOR REPORT. Scientific andtechnical findings by NASA-sponsoredcontractors and grantees. CONFERENCE PUBLICATION. Collectedpapers from scientific and technicalconferences, symposia, seminars, or othermeetings sponsored or cosponsored by NASA. SPECIAL PUBLICATION. Scientific.technical, or historical information fromNASA programs, projects, and missions, oftenconcerned with subjects having substantialpublic interest. 自 TECHNICAL TRANSLATION. English-language translations of foreign scientific andtechnical material pertinent to NASA's mission. Specialized services also include organizingand publishing research results, distributingspecialized research announcements and feeds,providing information desk and personal searchsupport, and enabling data exchange services. For more information about the NASA STIprogram, see the following: Access the NASA STI program home page athttp://www.sti.nasa.gov E-mail your question to help@sti.nasa.gov Phone the NASA STI Information Desk at757-864-9658 Write to: NASA STI Information DeskMail Stop 148NASA Langley Research CenterHampton, VA 23681-2199 Fundamental Study of a Single Point Lean DirectInjector Part I: Effect of Air Swirler Angle andInjector Tip Location on Spray Characteristics Sarah A. Tedder, Yolanda R. Hicks, Kathleen M. Tacina, and Robert C. AndersonGlenn Research Center, Cleveland, Ohio Prepared for the 50th Joint Propulsion Conference cosponsored by AIAA, ASME, SAE, and ASEE Cleveland, Ohio, July 28-30, 2014 National Aeronautics and Space Administration Glenn Research Center Cleveland,Ohio 44135 Acknowledgments This work was supported by the Supersonics and Aeronautical Sciences Projects of the NASA Fundamental Aeronautics Program.We also thank Aimee Bogner, Derek Podboy, and Kurt Rusmisel for their technical support. This report contains preliminary findings,subject to revision as analysis proceeds. Trade names and trademarks are used in this report for identificationonly. Their usage does not constitute an official endorsement,either expressed or implied, by the National Aeronautics andSpace Administration. Level of Review: This material has been technically reviewed by technical management. Available from NASA STI Information DeskMail Stop 148NASA Langley Research CenterHampton, VA 23681-2199 National Technical Information Service 5301 Shawnee Road Alexandria, VA 22312 Fundamental Study of a Single Point Lean Direct InjectorPart I: Effect of Air Swirler Angle and Injector TipLocation on Spray Characteristics Sarah A. Tedder, Yolanda R. Hicks, Kathleen M. Tacina, and Robert C. AndersonNational Aeronautics and Space AdministrationGlenn Research Center Cleveland, Ohio 44135 Abstract Lean direct injection (LDI) is a combustion concept to reduce oxides of nitrogen (NOx) for nextgeneration aircraft gas turbine engines. These newer engines have cycles that increase fuel efficiencythrough increased operating pressures, which increase combustor inlet temperatures. NOx formation ratesincrease with higher temperatures; the LDI strategy avoids high temperature by staying fuel lean andaway from stoichiometric burning. Thus, LDI relies on rapid and uniform fuel/air mixing. To understandthis mixing process, a series of fundamental experiments are underway in the Combustion and DynamicsFacility at NASA Glenn Research Center. This first set of experiments examines cold flow(non-combusting) mixing using air and water. Using laser diagnostics, the effects of air swirler angle andinjector tip location on the spray distribution, recirculation zone, and droplet size distribution areexamined. Of the three swirler angles examined, 60° is determined to have the most even spraydistribution. The injector tip location primarily shifts the flow without changing the structure, unless theflow includes a recirculation zone. When a recirculation zone is present, minimum axial velocitydecreases as the injector tip moves downstream towards the venturi exit; also the droplets become moreuniform in size and angular distribution. Nomenclature CFD computational fluid dynamics D, venturi throat diameter FNus injector flow number distance upstream of venturi throat LDI lean direct injection, lean direct injector PIV particle image velocimetry PLS planar laser scatter distance from LDI exit S swirl number SV swirler venturi Introduction For more than 40 years, NASA has sustained programs to reduce the environmental effects ofaviation. A major focus of these programs has been reducing the emissions of nitrogen oxides (NOx).NOx emissions decrease the protective ozone layer in the stratosphere and increase smog and ozone in thelower troposphere (Ref.1). To prevent damage to the protective ozone layer, NASA programs havefocused on reducing NOx at cruise for supersonic flight. To reduce the emissions of NOx in the lower troposphere, NASA programs have also focused on reducing NOx emissions during the landing-takeoffcycle in subsonic flight. In addition to decreasing NOx emissions, NASA has also addressed the reduction of carbon dioxideemissions by increasing engine fuel efficiency. Increased fuel efficiency is typically achieved byincreasing the engine operating pressure ratio, which increases combustor inlet temperature; however,NOx formation rates increase with higher temperatures. Without an improvement in combustortechnology, higher efficiency engines will have higher, not lower, NOx emissions. Therefore, improvedlow-NOx combustor technologies need to be developed. In order to reduce NOx emissions,NASA is exploring fuel-lean front-end concepts. Historically,turbine engines for aircraft use rich-front-end combustors in order to ensure stable combustion in flight. Inthese combustors the primary combustion zone is fuel-rich-only part of the combustion air entersthrough the fuel/air mixers; the rest enters through downstream dilution jets, allowing combustion to becompleted (Refs. 2 to 4). In contrast, lean-front-end combustors operate fuel-lean throughout: All of thecombustor air except that used for liner cooling enters through the combustor dome. Lean front endcombustion concepts include lean, premixed, prevaporized (LPP), lean partially premixed, and lean directinjection (LDI) combustion (Refs. 2, 5 to 9). This paper focuses on an LDI combustion concept. LDI and other lean front end combustion concepts minimize local flame temperature. This keeps NOxemissions low because NOx is an exponential function of local temperature. To minimize NOx emissions,fuel-lean combustion needs to avoid local near-stoichiometric zones where the flame temperature is high.Avoiding these zones requires rapid and uniform fuel/air mixing. LDI accomplishes this mixing in part byreplacing one traditionally-sized fuel/air mixer with multiple smaller fuel/air mixers. However, previousexperiments have shown that decreasing the size and increasing the number of fuel/air mixers alone doesnot sufficiently improve mixing: fuel/air mixer design is also important. Multiple fuel/air mixer designs have been studied. There are several ways an individual fuel/air mixercan be constructed. On the air side, a radial, axial, or discrete jet swirler may be used. With any of thesetypes of swirlers, the swirl number can be varied. A venturi can be placed downstream of the air swirler,or the venturi can be omitted. On the fuel side, a simplex orhe y eair assist-atomizer can be used. For a simplexatomizer, flow number (i.e., effective flow area) can be varied. In addition, once a fuel/air mixer designhas been chosen, the size and number of the mixer elements can be varied. In order to choose the best fuel/air mixer design for an LDI combustor, it is critical to understand thefuel/air mixing process. Understanding fuel/air mixing requires knowledge both of large overall featuressuch as recirculation zones and precessing vortices, and of smaller eddies where much of the mixingoccurs. To better understand the mixing process, the NASA Fundamental Aeronautics/AeronauticalSciences project is conducting a series of tests in the 5-atm Combustion and Dynamics Facility (CDF)flametube rig at NASA Glenn Research Center. The baseline swirl-venturi (SV) LDI fuel/air mixer (Refs. 2 and 6) was used for these studies. Thebaseline SV-LDI fuel/air mixer consists of an axial swirler followed by a venturi. Fuel is injected througha simplex fuel injector; the fuel injector tip is at or just upstream of the venturi throat. This first set of experiments examines cold flow mixing using water. It studies the effect of air swirlerangle and fuel injector tip location on the cold flow droplet size and velocity fields. Testing was done at atemperature of 700 K and a pressure of 517-kPa. Water was used in place of jet fuel to prevent auto-ignition during long run times. Diagnostic measurements included particle image velocimetry, 30 kHzhigh-speed video images of planar laser scatter, and shadowgraph images for droplet size measurement.The results from these measurements are used to examine the effects of air swirler angle and injector tiplocation on the spray distribution, recirculation zone, and droplet size distribution. Experimental Facilities and HardwareCombustion and Dynamic Facility (CDF) All testing was done at NASA Glenn Research Center in the Combustion and Dynamics Facility(CDF). A schematic of the CDF test rig is shown in Figure 1. The CDF is orientated vertically, with theflow going down. The CDF can supply non-vitiated air preheated up to 810 K at air flow rates up to0.35 kg/sec and pressures up to 517-kPa. The combustor test section has a circular cross-sectionnominally 7.62-cm in diameter. Three sets of double-paned windows, spaced 90° apart around itscircumference, are used to gain optical access to the water-cooled combustor. The two opposing windowsare aligned to provide access in the x direction, while the third window is on the -y side of the combustor.The windows are flat and have a small offset away from the combustor circumference. The windowsmeasure 6.1-cm tall (axial direction) by 5.8-cm wide (azimuthal). Figure 2 shows a cross sectional detaildrawing of the combustor, which defines the coordinate system and shows the window positions. Figure 1.-Schematic of the test hardware.This schematic is not to scale. Figure2.-Cross sectional detail of combustor.Shown by red arrows are the windoworientation and definition of the coordinatesystem used. Z is into the page. LDI Hardware As illustrated in Figures 3 and 4, the baseline SV-LDI fuel/air mixer consists of a simplex pressure-swirl fuel injector and an air passage with a six-bladed, helical axial air swirler followed by a converging-diverging venturi section. The diameter of the venturi throat (D:) is 13.0 mm. The simplex fuel injector isinserted through the center of the air swirler. The fuel injector tip is placed at one of three distancesupstream of the venturi throat, h/D: 0, 0.16, or 0.31 throat diameters. The injector flow number, FNus,(as defined by Lefebvre (Ref. 10)) is 0.7. The helical axial air swirlers have six blades. Each blade has aninside diameter of 9.4 mm and an outside diameter of 22 mm. The blades angles for three configurationsstudied here are 45°,52.5°, and 60°. The calculated swirl numbers, as defined by Beer and Chigier(Ref. 11), are 0.59, 0.77, and 1.02, respectively. This baseline SV-LDI fuel/air mixer is nominally 2.54-cm in diameter. However, the flametube is7.62-cm in diameter. In this study, the fuel/air mixer was mounted in the center of the flametube andsurrounded by co-flow air; the co-flow enters the flametube through a screen that simulates the pressuredrop across the fuel/air mixer. The test hardware is shown in Figure 4. Figure 3.-Schematic drawing of a single SV-LDI fuel/air mixer. a) b) Figure 4.-Cross section of the single SV-LDI module. Detailed drawings showing a cross section of the singleSV-LDI module in its spool piece;(a) and a bottom view that shows the screen inserted around the module (b). TABLE 1.-TEST CONDITIONS [Common conditions for both test points, 500 and 700: Air: Pressure=517.1 kPa, Temperature=700 K. The water was at room temperature, approximately 298 K.] Test point Reference velocity, m/s Air flow rate.kg/s Water flow rate.kg/h Water/Air ratio APinjector,kPa 500 9.1 0.107 3.89 0.100 672 700 12.2 0.143 4.09 0.008 738 Test Conditions Results from two test conditions are presented in the results and discussion section. These testconditions will be referred to as test points 500 and 700. These conditions are detailed in Table 1. Thecombustor air inlet temperature and pressure were the same for both test points 700 K and 517 kPa. Thetest point 500 has a lower reference velocity and a higher water to air ratio than the 700 test point. Thewater was injected at the same ambient temperature (~298 K) for both test conditions. Optical Instrumentation For the work presented here, we measured water droplet velocities and sizes in preheated air.Two-dimensional velocity measurements were obtained using particle image velocimetry (PIV). Theshadowgraph technique was used to obtain drop sizes and instantaneous velocity measurements of waterspray. Planar laser scatter (PLS) was used to visualize liquid drops at a high frame rate and to developlimited pseudo time-series PIV. High frame rate PLS images were also used to develop spray patternhistograms. All techniques were laser-based. The lasers were located in a separate room and the light wastransmitted to the test rig using mirrors, and then conditioned to the appropriate measurement volume viacombinations of lenses. The details of the experimental setups are outlined below. Standard PIV and PLS, used similar optical arrangements. The laser light for PIV and PLS enteredand exited the combustor in the x-direction via the two opposing windows at 0°and 180°, and the camera,which received the 90°-scattered light was positioned to collect the light via the window at 90°. Forshadowgraphy, a line-of-sight technique, the light source and camera were positioned on opposite sides,using the two opposing windows. PIV data were obtained using a dual head, frequency-doubled Nd:YAG laser operating at 15 Hz. Thelaser pulse width was 3-5 ns. The spatially-overlapped laser beams were expanded into vertically-orientedsheets using a cylindrical lens. The sheets were approximately 45-mm-high by 0.3-mm thick, entered thecombustor through the 180° window, and exited through the 0° window. The sheet axis was aligned withthe flow direction. Images were acquired through the 90° window, collecting light scattered from waterdroplets that passed through the laser sheet, to capture liquid phase velocity. To collect the light, we usedan f=105-mm, f/4 lens, outfitted with a 532-nm narrowband interference filter. An interline transferCCD camera (1600x1200 pixels) captured the scattered light from adjacent laser pulses onto twoindividual frames. This collection scheme imaged a region that spanned roughly 50-mm in the x-direction(along the laser sheet axis) by 38-mm axially (z-direction). The time between frames was typically 5 us.All synchronization was handled using a LaVision, Inc. programmable timing unit, PTU-9. Cross-correlation methods were then applied to create a displacement vector field for each image pair.LaVision’s DaVis software version 7.2 was used to collect the images and version 8.2 was used toproduce 2-D fields of the axial-horizontal (z-x) velocity components in the y=0 plane. Shadowgraph images were produced using the same laser and camera. However, for the shadowgraphmeasurements the laser was expanded into a cone using a spherical lens, which in turn struck afluorescent plate, producing a bright, yellow-orange background field. Light was collected on the oppositeside with a long-range catadioptric microscope and stored on the camera. The system magnification wassuch that each image provided a field of view of approximately 2.2-mm in the y-direction, by 1.7-mmhigh (z-direction), with a depth of field of approximately 1-mm. Each image was considered to emanate from a “point”in space, and the whole optical system was traversed in 1- or 2-mm increments in thex-direction, along y=0, with occasional data collected along x=0. PLS images were acquired using a continuous wave Nd:YAG laser with a total power output of ~1.1 W. As with PIV, the laser beam was formed into a vertical sheet (approximately 40-mm high,positioned along y=0). The laser sheet entered via the 0° window and exited through the 180° window.We used a 12-bit, grayscale, high-speed camera that has a CMOS array with 1024×1024 pixel resolution.The high-speed camera was set up square to the rig and focused on the vertical plane at y=0. The high-speed camera frame rate and resolution are variable.The camera can frame as fast as 5400-frames/s(5.4-kps) at full resolution (which provides the maximum field-of view image size), and faster at lowerresolutions. A frame rate of 30-kps and a resolution of 512×352 pixels was used. The light was collectedusing an f=60-mm, f/2.8 lens. The default exposure is 1/(frame rate), or 33.3 us, which was used for allPLS images. Results and Discussion The effects of air swirler angle and injector tip location on the velocity field and droplet sizedistribution are presented in this section. First, we discuss effects of the air swirler angle on the spraydistribution, droplet size, and recirculation zone. We then discuss the injector tip location effect on spraydistribution, droplet size, and recirculation zone. Air Swirler Angle This subsection examines the effect of air swirler angle when the injector tip is located at the venturithroat. Spray Distribution An even distribution of droplets in the injector spray improves the mixing of fuel and oxidizer,reducing production of NOx by minimizing the occurrence of pockets of increased temperature caused bylocal peaks in fuel air ratio. One importanaks 11t parameter used to characterize the droplet distribution is thespray angle. The spray angles can be observed qualitatively by examining the measured PIV velocity fields.Shown in Figure 5(a) to (c) are PIV velocity fields at y=0, at test condition 500, with the injector tip atthe venturi throat. These results indicate qualitatively that the spray angle of the droplets increases withincreasing swirler angle. 10oEoc一 15 涵即伯佑体位们 20 25 30 a) Figure 5.-Average Velocity Fields. Average velocity fields at y =0 for water spray measured with PIV measuredat test condition 500 with injector tip at the venturi throat. Increasing air swirler angle from left to right: (a) 45,(b) 52.5, (c) 60° The flow is from top to bottom. We also measured the spray pattern using the high-speed images of PLS. For each condition weanalyzed 1000 high-speed image frames using IDL (Ref. 12) and software (Ref. 13) which finds andmeasures roughly circular features within an image. For each of the features, a distance, r, and anglerelative to the vertical measured from (x,y,z)=(0,0,0) were determined. Spray pattern histograms weredeveloped by creating software“bins”which were 3°wide with an r that ranged from 10 to 30 mm. Thesoftware counted the features found in each bin throughout the 1000 frames analyzed. Results of thisanalysis are shown in Figure 6, where all three plots are shown with the same scale. These histogramsclearly indicate that the spray was a hollow cone, as expected from a simplex fuel injector. They alsoindicate that the number of droplets found in the center of the hollow cone increases with increasingswirler angle. Using the droplet distribution histograms, we define the spray angle as the difference between the binangle where the total count reached 5 percent and the angle where the count reached 95 percent. Thesecalculated spray angles are plotted versus swirler angle in Figure 7. The trend in Figure 7 closely matchesthe trends observed in the PIV velocity field in Figure 5 (increasing spray angle with increasing swirlerangle). In addition, in Figure 7, one can note that the spray angle is higher at point 500 than at point 700for swirler angles of 45°and 52.5°, but not for 60°. a) Figure 6.—Histograms of Droplet Distributions. Occurrences of droplets at angles relative to center of air mixerexit at test condition 500 with injector tip at the venturi throat. Increasing air swirler angle from left to right:(a)45,(b)52.5, (c) 60. Figure 7.-Effect of air swirler angle on spray angle. Spray angledistribution versus air swirler angle at test conditions 500 and 700.The injector tip is at the venturi throat. Figure 8.-Sauter mean diameter versus radial position. Plot ofdroplet diameter versus radial location, x, for test condition 500with the injector tip at the throat of the venturi. Droplet Size The Sauter mean diameter (SMD) is plotted versus radial position for each swirler angle in Figure 8.These measurements were collected at test point 500 with the injector tip at the throat. The SMD ismeasured at points along a line perpendicular to the flow at an axial location, z= 11 mm, downstream ofventuri exit. The droplet size distribution is similar for swirler angles 45° and 52.5°with smaller dropletsoccurring towards the center of the spray and larger droplets near the outer edges. For these swirler anglesthe SMD ranges from 80 um to below 20 um. For swirler angle 60°, the size distribution is narrower,spanning from 30 to 60 um across the scan. This may be a result of the presence of the recirculation zoneproduced by the 60° swirler angle as discussed in the next section. Recirculation Zone In gas turbine combustors, swirl is used to improve fuel/air mixing and to mix the combustionproducts with the unburned fuel and air, thereby decreasing flame length and increasing flame stability.Usually, the swirl is strong enough to cause reverse flow and a central recirculation zone formsdownstream of the fuel/air mixer (Ref. 10). Previous work on swirling jets has shown that a centralrecirculation zone forms when the swirl number is greater than about 0.6 (Refs. 10, 11, and 14).Furthermore, a diverging flow passage has been shown to increase the diameter and mass of fluid in therecirculation zone (Ref. 11). Since the SV-LDI geometry includes a converging-diverging venturi, a central recirculation zonewould be expected as long as the swirl number was near 0.6. Therefore, the minimum swirler vane anglewas chosen to be 45°, corresponding to a swirl number of 0.59 (Ref.6). However, subsequent opticaldiagnostic measurements (Ref. 15) and CFD calculations (Ref. 16) showed that with a swirler angle of45° no central recirculation zone formed. This was true both for a single 2.54-cm SV-LDI fuel/air mixerin a 2.54-cm by 2.54-cm square duct (Refs. 15 and 16) and an array of 3 by 3 fuel/air mixers in a 7.62-cmby 7.62-cm square duct (Ref. 16). In fact, the experiments conducted by Fu (Ref. 15) on a single 2.54-cmSV-LDI in the 2.54-cm by 2.54-cm square duct showed that a strong central recirculation zone did notform until the swirler angle was well above 45°. In this experiment, Fu (Ref. 15) varied the swirler angle from 40° to 65° in 5° increments. No central recirculation zone formed until the swirler angle was 55°;and even then, the central recirculation zone did extend to the venturi exit-it started about 22-mmdownstream of the venturi exit. The central recirculation zone did not extend to the venturi exit until theswirler angle was 60°, S= 1.02 (Ref. 15). For a 3 by 3 array of fuel/air 60° swirler angle mixers, previousCFD calculations (Ref. 16) and experimental measurements (Ref. 17) also showed a recirculation zoneextending to the venturi exit. The experiment presented in this paper differs from these previous experiments (Refs. 15 to 17) as itwas done on a single 2.54-cm SV-LDI fuel/air mixer in a 7.62-cm circular duct. A single fuel/air mixerwas studied to allow for detailed measurements to be taken without interaction from surrounding fuel/airmixers. However, this means that the boundary conditions, i.e., confinement, were significantly differentthan it would be in a more realistic case of seven 2.54-cm fuel/air mixers in the same 7.62-cm circularduct. Previous research (Refs. 11, 14,15, and 18) has shown that confinement can significantly affect thevelocity field and recirculation zone. Therefore, to partially simulate the effects of multiple fuel/airmixers, a coflow was used. Although this experiment had a coflow whereas the previous research did not(Refs. 16 and 17), the current results are consistent: a recirculation zone was observed for the 60° swirlerbut not for the 45°swirler. There was also no recirculation zone for the 52.5°swirler. In this work the value and location of the minimum axial velocity for various swirler angles was usedas an indicator of the effect swirler angle (shown in Fig.9). This was done since the neither the 45°swirler nor the 52.5° swirler case produced a recirculation zone. Figure 9(a) shows that the minimumaxial velocity decreases with increasing swirler angle. In Figure 9(b) for both the 45° swirler and the52.5°swirler, the minimum axial velocity is at the downstream edge of the field of view, z~36 mm; thismeans that the actual location of the minimum axial velocity may be farther downstream and that theminimum velocity may be lower. For the 60° swirler, the location of the minimum axial velocity (i.e.,greatest reverse flow) is much farther upstream. a Figure 9.-Effect of Swirler Angle on Minimum Axial Velocity. The injector tip is at the venturi throat and test conditionis 500. Shown are a) minimum axial velocity and b) axial location of this minimum axial velocity versus swirler angle. Injector Tip Location This subsection examines the effect of the injector tip location on spray distribution and droplet sizedistribution for all three swirler angles, and the recirculation zone for the 60° swirler angle. Spray Distribution To examine the spray distribution, PIV results along the y=0 combustor position are shown at bothconditions 500 and 700 in Figures 10 and 11 for swirler angle 45°, and in Figure 12 at test condition 500 forswirler angle 60°. The flow is from top to bottom. From left to right in these figures, h/D: is 0,-0.16, and-0.31. In Figures 10 and 11, the results show that the spray angle increases as the injector tip is movedfarther upstream of the throat. For the 60° swirler (Fig. 12), it is harder to discern by eye, but the trendappears to be opposite. A more quantitative consideration of the effect is shown in Figure 13, which showsplots of spray angle versus injector tip location calculated from the histograms as described in the spraydistribution section above. These graphs show agreement with the visual observations made for the PIVimages, and emphasize that there is only a minor change of spray angle for the 60° air swirler with injectortip position (Fig. 13(c)). EEoEoc一30 a) -10 如佰50 20 Figure 10.-Average Velocity Fields, 45°swirler, Condition 500. Average velocity fields for water spray measured withPIV at test condition 500 with 45°swirler angle. Injector tip distances upstream of the throat, h/Dt are a) 0, b) 0.16,and c) 0.31. The flow is from top to bottom. 石和们50 a) Figure 11.-Average Velocity Fields, 45°swirler, Condition 700. Average velocity fields for water spray measured withPIV at test condition 700 with 45°swirler angle. Injector tip distances upstream of the throat, h/Dr are a) 0, b) 0.16,and c) 0.31. The flow is from top to bottom. 如侣佰位8 : 0 10 20 a) radial position,mm Figure 12.-Average Velocity Fields, 60° swirler.Average velocity fields for water spray measured with PIV at test condition500 with 60°swirler angle. Injector tip distances upstream of the throat,h/Dt are a) 0, b) 0.16, and c) 0.31. The flow isfrom top to bottom. Figure 13.-Effect of Injector Tip Location on Spray Angle. Plots of spray angle versus location of injector tip diametermeasured in h/Dt. From left to right the plots are for swirler angles 45, 52.5,and, 60° 6000 5000 3000 20001 1003001 50 a) Figure 14.—Histograms of Droplet Distributions of Swirler Angle 60°. Occurrences of droplets at angles relative tocenter of air mixer exit at test condition 700 with injector tip at the venturi throat. Injector tip distance upstream ofthe throat in throat diameters: (a) at throat, (b) 0.16, (c) 0.31. To understand the effect of the injector tip location further, the histograms from the 60°swirler areexamined. Figure 14(a) to (c) show histograms of the droplet distributions for the range of spray anglesmeasured for test condition 700 with h/Dtof0,-0.16, and-0.31. The histograms show that thedistribution becomes more uniform as the injector tip is moved closer to the throat. Droplet Size Figure 15 shows the SMD for the various injector tip locations, measured across the flow at the axiallocation z = 11 mm (11 mm downstream of venturi exit). The plots show that as the injector tip movesdownstream the droplet sizes are larger in the center region of the of the flow from~x=-10 mm to10 mm. This is most evident for Figure 15(a) for swirler angle 60°, test condition 700. This trend is alsoseen for Figure 15(b) for swirler angle 52.5°, test condition 700. There are many possible reasons forincrease in uniformity of the droplet sizes such as: a simple shift of the flow downstream or dropletcoagulation. To determine the cause of these trends, droplets sizes need to be measured at several moreaxial locations. Recirculation Zone The recirculation zone generated using the 60° swirler was characterized based on its size andminimum velocity.The velocity field for the 60° swirler flow, as seen in Figure 12, shows that the regionmeasured with the PIV in this experiment does not include the stagnation point of the recirculation zone.The field of view only includes the top portion of the primary zone as shown in the drawingrepresentation of the flow in Figure 16. Because of this limited field of view, the outer bounds of therecirculation zone cannot be determined.Hence in order to measure the width of the recirculation zone,the zero velocity line is used instead. The maximum width of zero velocity area of the recirculation zoneis plotted versus the injector tip location in Figure 17(a). This plot shows that the recirculation zone has awidth that is almost constant, but is slightly wider with the injector tip at the throat. The location of thismaximum width plotted versus the location of the injector tip is shown in Figure 17(b). The locationshows a shifting of the maximum width downstream as the injector tip proceeds downstream, whichreflects a simple shifting of the flow downstream. a) b) Figure 15.-Droplet Size Distribution Effect of Injector Tip. a) Plot of droplet size verses versus x (radial) locationfor a range of injector tip locations at test condition 700 and swirler angle 60°b) Plot of droplet size versus radiallocation for a range of injector tip locations at test condition 700 and swirler angle 52.5° Figure 16.—Drawing of the recirculation zone. Drawingof the flow with a recirculation zone. The field of viewfor this experiment only include the area above thedashed line. a) Figure 17.—Measures of Recirculation Zone Size. a) Plot of maximum width versus injector tiplocation diameterupstream of throat. b) Plot of location of maximum width versus injector tip location. Swirler angle 60°and testcondition 500. a) Figure 18.—Measures of Strength of Recirculation for 60° Swirler. a) Plot of minimum axial velocity and b) axiallocation of minimum velocity versus injector tip location. Test condition 500. The minimum axial velocity of the recirculation zone was also measured and is shown in Figure 18.Figure 18(a) shows that the minimum axial velocity increases as the injector tip is moved furtherupstream the throat. This trend shows that the location of the injector tip may have an effect on the flowstructure when a recirculation zone is present. The location of this maximum reverse flow is shown inFigure 18(b) plotted against the location of the injector tip. This plot shows a shifting of the maximumvelocity downstream as the injector tip is moved downstream. Summary The swirler angle has a large effect on the spray angle and the formation of a recirculation zone asshown in References 15, 19, and 20. The larger the swirler angle the wider the spray angle and the morelikely the formation of the recirculation zone. Recirculation only occurred for swirl number S =1.02,corresponding to the 60° swirler. The injector tip location appears to only shift the flow without changingthe structure for most flows. For flows with a recirculation zone, the droplets became more uniform insize and angular distribution the closer the injector tip was to the venturi throat. This relationship betweeninjector tip location and recirculation zone was also shown by considering the minimum axial velocity.The minimum axial velocity increases as the injector tip was moved upstream towards the venturi throat. References 1..Lee, D.S., Pitari, G.,Grewe, V., Grierens, V., Penner, J.E., Petzold, A., Prather M.J., Schumann,U., Bais, A., Berntsen, T., Iachetti,D., Lim, L.L., and Sausen, R.,“Atmospheric Environment,”Vol.44, pp. 4678-4734,2010. 2Tacina,R.R.,“Low-NOx potential of gas turbine engines,”AIAA-1989-0550, 1989.3 Chang, C.T. and Holdeman, J.D., “Low emissions RQL flametube combustor test results,”NASA/TM—2001-211107,2001. 4. Peterson, C.O., Sowa, W.A., and Samuelson, G.S.,"Performance of a model rich burn-quick mix-leanburn combustor at elevated temperature and pressure,”NASA/CR—2002-21192,2002. 5..Lee, C.M., Bianco, J.,Deur, J.M., and Ghorashi, B., “Nitric oxide formation in a lean premixedprevaporized Jet A/air flame tube: an experimental and analytical study,”NASA/TM—2001-105722,1992. 6.Tacina,R., Lee, P., and Wey, C.,“A lean-direct-injection combustor using a 9 point swirl-venturi fuelinjector,”ISABE-2005-1106,2005. 7.Tacina, R., Mao, C.-P., and Wey, C.,“Experimental investigation of a multiplex fuel injector modulewith discrete jet swirlers for low emissions combustors,"AIAA-2004-0135,2004. 8.Tacina, R., Wey, C., Laing,P., and Mansour, A.,“A low-NOx lean-direct injection, multipointintegrated module combustor concept for advanced aircraft gas turbines,”NASA/TM—2002-211347,2005. 9.Bianco,J.,“NASA Lewis Research Center’s combustor test facilities and capabilities,”AIAA-1995-2681,1995. 10.Lefebvre, A.H. Gas Turbine Combustion, 2"d ed., Taylor and Francis, Philadelphia, 1998. 11.Beer,J.M. and Chigier, N.A. Combustion Aerodynamics, 1t ed., John Wiley & Sons, Inc.,New York, 1972. IDL, Exelis Visual Information Solutions, Software Package, Ver. 8.3, Boulder, Colorado, 2013.B4 Feature.pro, John C. Crocker and David G. Grier, Emory University, Atlanta, Ga, 1996. Gupta, A.K., Lilley, D.G., and Syred, N., Swirl Flows, Abacus Press, Kent, UK, 1984. Fu, Y.,“Aerodynamics and Combustion of Axial Swirlers,”Ph.D. Dissertation, University ofCincinnati,2008. 16.Ajmani, K., Mongia, H.C., and Lee, P.,“Evaluation of CFD Best Practices for Combustor Design:Part I -Non-Reacting Flows,”AIAA-2013-1144,2013. 17.Hicks Y.R., Heath, C.M., Anderson, R.C., and Tacina, K.M.“Investigations of a combustor using a9-point swirl-venturi fuel injector: recent experimental results,”ISABE-2011-1106, 2011. 18.Alekseenko,S.V., Kuibin, P.A.,Okulov, V.L.,Theory of Concentrated Vortices, Springer-Verlag,Berlin, 2007. 19.Kilik, E.,“The Influence of swirler design parameters on the aerodynamics of the downstreamrecirculation region."Ph. D. Dissertation, School of Mechanical Engineering, Cranfield Institute ofTechnology, 1976. 20.Bafuwa, G.G. and Maccalum, N.R.L,“Turbulent Swirling Flames Issuing from vane Swirlers,”18" Meeting of Aerodynamics Panel, I.F.R.F. 1970. February February Lean direct injection (LDI) is a combustion concept to reduce oxides of nitrogen (NOx) for next generation aircraft gas turbine engines. These newer engines have cycles that increase fuel efficiency through increased operating pressures, which increase combustor inlet temperatures. NOx formation rates increase with higher temperatures; the LDI strategy avoids high temperature by staying fuel lean and away from stoichiometric burning. Thus, LDI relies on rapid and uniform fuel/air mixing. To understand this mixing process, a series of fundamental experiments are underway in the Combustion and Dynamics Facility at NASA Glenn Research Center. This first set of experiments examines cold flow (non-combusting) mixing using air and water. Using laser diagnostics, the effects of air swirler angle andinjector tip location on the spray distribution, recirculation zone, and droplet size distribution are examined. Of the three swirler angles examined, 60 is determined to have the most even spray distribution. The injector tip location primarily shifts the flow without changing the structure, unless the flow includes a recirculation zone. When a recirculation zone is present, minimum axial velocity decreases as the injector tip moves downstream towards the venturi exit; also the droplets become more uniform in size and angular distribution.
关闭-
1/20
-
2/20
还剩18页未读,是否继续阅读?
继续免费阅读全文产品配置单
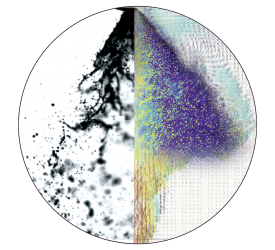
北京欧兰科技发展有限公司为您提供《空气旋流器中速度场和喷雾几何形态检测方案(粒子图像测速)》,该方案主要用于航天中速度场和喷雾几何形态检测,参考标准《暂无》,《空气旋流器中速度场和喷雾几何形态检测方案(粒子图像测速)》用到的仪器有德国LaVision PIV/PLIF粒子成像测速场仪、LaVision SprayMaster 喷雾成像测量系统、LaVision DaVis 智能成像软件平台。
我要纠错
推荐专场
相关方案







 咨询
咨询