方案详情文
智能文字提取功能测试中
Analysis of the absorption layer of CIGS solar cell by laser-induced breakdown spectroscopy 激光诱导击穿光谱法分析CIGS太阳能电池的吸收层 Laser induced breakdown spectroscopy (LIBS) was applied for the elemental analysis of thin CuIn1-xGaxSe2 (CIGS) absorption layer deposited on Mo-coated soda-lime glass by coevaporation technique. The optimal laser and detection parameters for LIBS measurement of CIGS absorption layer (1.23 μm) were investigated. The calibration results of Ga/In ratio with respect to the concentration ratios measured by x-ray fluorescence and inductively coupled plasma optical emission spectroscopy showed good linearity. 摘要采用激光诱导击穿光谱法(LIBS)对共蒸发法制备的涂Mo钠钙玻璃上的CuIn1-xGaxSe2 (CIGS)吸收层进行了元素分析。研究了LIBS检测1.23μm厚的CIGS吸收层的最佳激光和检测参数。Ga/In比值与x射线荧光和电感耦合等离子体发射光谱测量的浓度比值的校准结果具有良好的线性关系。 INTRODUCTION 引言 Compound semiconductor films of copper indium gallium diselenide [CuIn1-xGaxSe2] (CIGS) have recently received tremendous interest as the emerging materials for photovoltaic applications due to compelling technical benefits that include reduction of material usage and high photoconversion efficiency [1-3]. Although there exist several factors that influence on the efficiency performance of CIGS solar devices, the targeted and consistent performance characteristics of the CIGS solar devices is achieved from a rigorous control of the chemical composition of the CIGS absorber film tailored for its energy band structure. The CIGS quaternary compound is a semiconductor with a band gap energy ranging from 1.04 to 1.7 eV that depends on the [Ga]/[In+Ga] ratio varying from 25 to 30% for current high-efficiency devices [4]. Many recent CIGS researches highlight ways to improve the optoelectronic properties of CIGS absorber films and their dependence on the chemical composition of the layer [1-3]. Accurate analytical technique for determining elemental composition of CIGS films is a critical part for these research efforts. 近年来,复合半导体薄膜(CuIn1-xGaxSe2) (CIGS)作为光伏应用的新兴材料受到了极大的关注,因为它具有显著的技术优势,包括减少材料的使用和较高的光转换效率。虽然有几个因素影响CIGS太阳能器件的效率性能,CIGS太阳能器件的目标和一致的性能特征是通过严格控制CIGS吸收膜的化学成分来实现的,CIGS吸收膜是为其能带结构量身定制的。CIGS四元化合物是一种带隙能量为1.04 ~ 1.7 eV的半导体,该半导体的带隙能量取决于[Ga]/[In+Ga]的比,从25%到30%不等,适用于当前的高效器件。近年来的许多CIGS研究着重于如何改善CIGS吸收膜的光电特性及其对吸收膜化学成分的依赖性。准确测定CIGS薄膜元素组成的分析技术是这些研究工作的关键。 Laser induced breakdown spectroscopy (LIBS) has been recognized as a powerful and versatile technique for materials analysis, especially for the applications in which real-time analysis, high sensitivity, minimal or no sample preparation, measurement in atmospheric environment, portability and stand-off measurement capability are desired [5-21]. LIBS measurements are known to be highly reliable if the measurement parameters are properly determined as demonstrated by the direct comparison with the results of inductively coupled plasma optical emission spectroscopy (ICP-OES) [18]. Along with high measurement speed, versatile sampling protocols of LIBS such as bulk analysis, micro-spot analysis, depth profiling, and spatial mapping of elements make the technique the best choice for the analysis of CIGS absorption layer during CIGS process development and manufacturing. For manufacturing of CIGS solar modules, a scribing step is required for cell isolation and modulation [3, 23]. Thus, LIBS has a potential for being integrated into the laser scribing processes, which allows real-time process control with no need to dedicate separate product areas for composition monitoring. Despite many technical benefits of LIBS for the CIGS solar cell manufacturing, little research has been reported for the LIBS analysis of CIGS solar material. On the other hand, x-ray fluorescence (XRF) which is one other commonly used elemental analysis technique under atmospheric condition may also be adopted. However, XRF has a critical disadvantage for the application to CIGS analysis because lighter elements such as Na (one of the key elements added to enhance efficiency performance) cannot be measured with XRF. Furthermore, for lower concentration measurements, relatively long data acquisition may be required up to several minutes per sample for XRF measurement [22]. 激光诱导击穿光谱(LIBS)已被公认为一种功能强大、用途广泛的材料分析技术,特别适用于实时分析、高灵敏度、少量或无样品制备、大气环境下检测、便携性和远距离测量等要求。通过与电感耦合等离子体发射光谱(ICP-OES)测量结果的直接比较,我们知道,如果测量参数确定得当,LIBS测量是非常可靠的。该技术LIBS具有测量速度快、采样控制功能全(如整体分析、微束斑分析、深度剖析、元素空间分布图)等特点,是CIGS工艺开发和制造过程中CIGS吸收层分析的最佳选择。在CIGS太阳能组件的制造过程中,需要一个对电池进行分离和调制的划线步骤。因此,LIBS有可能集成到激光划线过程中,从而实现实时的过程控制,而不需要专门的产品区域进行成分监测。尽管在CIGS太阳能电池制造中,LIBS具有许多技术优势,但对CIGS太阳能电池材料LIBS分析的研究报道甚少。另一方面,x射线荧光光谱(XRF)是大气条件下另一种常用的元素分析技术。然而,XRF在应用于CIGS分析方面有一个严重的缺点,因为诸如Na(为提高效率性能而添加的关键元素之一)等较轻的元素无法用XRF测量。此外,对于较低的浓度测量,对于XRF检测,每个样品可能需要较长的数据采集时间,最长可达几分钟。 For the LIBS analysis of thin CIGS absorption layer with thickness on the order of a few microns, achieving high depth profiling resolution of the analysis is important because the depthwise distribution of constituting elements is directly related to the device efficiency. A conventional Gaussian laser beam had limitation in achieving good depth resolution due to nonuniform ablation across the irradiated spot, but this problem could be improved by adopting a top-hat laser beam [24]. By using a flat energy-profile XeCl excimer laser beam, Vadillo et al. [25] achieved a depth resolution of 8 nm pulse-1 for LIBS analysis of Zn-coated steel. Besides laser beam profile, laser pulse energy is another highly influential factor for determining depth profiling resolution, and the resolution increases with decreasing laser fluence [26]. 对于只有几微米厚度的CIGS吸收层的LIBS分析,获得高的分析深度剖面分辨率是很重要的,因为组成元素的深度分布直接关系到器件的效率。传统的高斯激光束由于受剥蚀点的非均匀剥蚀,在获得良好的深度分辨率方面存在一定的局限性,但采用高帽激光束可以改善这一问题。Vadillo等人利用平能量剖面的XeCl准分子激光光束获得了每个脉冲8 nm的深度分辨率,用于锌涂层钢的LIBS分析。激光脉冲能量是决定深度剖面分辨率的另一个重要因素,其分辨率随着激光能量[26]的减小而增大。除了激光束轮廓,激光脉冲能量是决定深度剖面分辨率的另一个重要因素,其分辨率随着激光能量密度的减小而增大。 In this work, we report the results for LIBS analysis of a quaternary compound of thin CIGS absorption layer using a flat-top profile laser beam. Optimization of key parameters was carried out for semi-quantitative LIBS analysis and the calibration curves were obtained for the Ga/In ratio with respect to the data based on XRF and ICP-OES measurements. 在这项工作中,我们报告了使用平顶轮廓激光束对一种CIGS吸收层的四元化合物进行LIBS分析的结果。对半定量LIBS分析的关键参数进行了优化,根据XRF和ICP-OES测量数据,获得Ga/In比的校准曲线。 EXPERIMENTAL 实验 Fig. 1(a) illustrates the device configuration of a CIGS solar cell which consists of the Mo back contact on a substrate, the CIGS absorber layer, a buffer layer, and the transparent bilayered ZnO front contact with Al grid. The absorption of solar energy and conversion into electrical energy occurs at the CIGS absorber layer that accordingly governs the efficiency of the overall device. Since the composition and distribution of constituting elements within the CIGS absorption layer are the critical issues, the experimental samples in this study were prepared by depositing only up to the CIGS layer as shown in Fig. 1(b) so that direct LIBS analysis of the absorption layer could be possible. The polycrystalline CIGS absorber layer was deposited on Mo-deposited (1 μm) soda-lime glass (Abrisa Co., USA) using a typical three-step coevaporation process [1, 27]. First, In, Ga and Se sources were evaporated simultaneously at 400℃ to form a (In, Ga)2Se3 layer with a thickness of about 1 μm. Then as the second step, Cu and Se were evaporated and reacted with the (In, Ga)2Se3 layer at around 600 °C to form a Cu-rich phase, and finally In, Ga and Se elements were again evaporated to make a Cu-poor phase while maintaining same substrate temperature. The average thickness of thereby produced CIGS layer was approximately 1.5 μm. For this study, Ga and In compositions in the CIGS thin films were varied by controlling metal evaporation flux and measured to be varying from 2.5 to 10.8% and from 14.1 to 20.9%, respectively, by energy dispersive XRF analysis (Oxford Instrument Inc., XStrata980). In addition, the chemical compositions of the CIGS thin films were cross-checked with the ICP-OES analysis data (Perkin Elmer Inc., Optima 4300DV). 图1(a)展示了CIGS太阳能电池的设备配置,该电池包括衬底上的Mo背面触点、CIGS吸收层、缓冲层和与透明双层ZnO正面与铝栅极接触。太阳能的吸收和转化为电能发生在CIGS吸收层,CIGS相应地决定了整个装置的效率。由于CIGS吸收层中组成元素的组成和分布是关键问题,因此本研究的实验样品仅沉积至CIGS层,如图1(b)所示,这样可以直接对吸收层进行LIBS分析。多晶CIGS吸收器层是使用典型的三步共蒸发法沉积在涂有1μm Mo层的钠钙玻璃上(美国Abrisa有限公司) 。首先,In、Ga和Se源同时在400℃被蒸发形成1μm 厚的(In, Ga)2Se3层。第二步,在600℃左右蒸发Cu和Se,与(In, Ga)2Se3层反应形成富Cu相。最后,在保持衬底温度不变的情况下,再次蒸发In、Ga和Se元素,形成贫Cu相。从而产生了平均厚度约为1.5μm的CIGS层。在本研究中,通过控制金属蒸发量来改变CIGS薄膜中的Ga和In组分,并通过能量色散XRF(Oxford Instrument Inc., XStrata980)分析,分别测量到Ga含量在2.5~10.8%和In含量14.1~20.9%之间变化。此外,还利用ICP-OES(Perkin Elmer Inc., Optima 4300DV)分析数据对CIGS薄膜的化学成分进行了核对。 图1.(a)CIGS太阳能电池结构示意图,(b)CIGS吸收层的横截面SEM图像 LIBS analysis of the CIGS absorber layer was carried out by using a commercial LIBS system (Applied Spectra Inc., RT100-HP) [28]. The measurement system was equipped with a high performance ICCD camera coupled to Czerny-Turner spectrometer with a dual-grating turret providing maximum spectral resolution of 0.1 nm with a 40 nm spectral window. A Qswitched Nd:YAG laser (λ=1064 nm, τ=4ns) with a near flat-top spatial profile was used to generate plasma and the spot diameter was fixed at 150 μm. LIBS data were collected by measuring the integrated intensity of atomic spectral lines at 410.176 nm [In (I)], 417.204 nm [Ga (I)], and 327.396 nm [Cu (I)]. The averaged intensity from nine laser spots (3×3 array with 0.75 mm pitch) were used to represent the result for each measurement condition [29] and linear baseline subtraction was applied. Multiple laser shots were made at each spot of the sample to examine the shot-to-shot variation of ablation rate and LIBS signal. The ablation rate was estimated by measuring the volume of ablation craters using a three dimensional surface profiler (NanoFocus Inc., μsurf). 利用商用LIBS系统对CIGS吸收层进行了LIBS分析(Applied Spectra Inc., RT100-HP)。该测量系统配备了一个具有一个双光栅转塔的Czerny-Turner光谱仪与高性能ICCD相机耦合,具有40 nm的光谱窗口,最大光谱分辨率为0.1 nm。调Q Nd: YAG激光器(λ= 1064 nm,τ= 4 ns)具有接近平顶的激光轮廓,用来产生等离子体,光斑直径设定为150μm。LIBS数据是通过测量原子谱线在410.176 nm [In (I)]、417.204 nm [Ga (I)]和327.396 nm [Cu (I)]处的积分强度来收集的。使用9个激光点(3×3网格,间距0.75 mm)的平均强度表示每个测量条件的结果,并应用线性基线扣除。在样品的每个点进行多次激光剥蚀,观察剥蚀率和LIBS信号随剥蚀的变化。用三维表面轮廓仪(NanoFocus Inc., μsurf)测量剥蚀坑的体积,估算剥蚀率。 RESULTS AND DISCUSSION 结果与讨论 The intensity of LIBS spectra depend not only on the chemical composition of the sample but also strongly on the laser and detector parameters such as laser energy, spot size, gate delay, and gate width. The optimal parameters for the LIBS measurement of CIGS thin films were determined by examining the LIBS signal-to-background ratios (SBRs) of the constituting elements at different laser pulse energies and gate delays in the range of 0.48~1.01 mJ and 0.1~1.0 μs, respectively. As a result, the optimum laser pulse energy was determined to be ~ 0.9 mJ for maximum value of SBR of LIBS emission signal of main constituent elements. LIBS光谱的强度不仅取决于样品的化学成分,还与激光和探测器的参数如激光能量、光斑大小、门延迟和门宽密切相关。LIBS测量CIGS薄膜的最优参数是由在激光能量为0.48~1.01 mJ和门延迟0.1~1.0 μs情况下测定构成元素的LIBS信背比决定的。因此,主要构成元素的LIBS发射信号的SBR最大值确定了最优激光能量为~0.9mJ。 Fig. 2 shows the variations of full width half maximum (FWHM) and SBR of the Ga(I) emission line at 417.2 nm with respect to gate delay. The FWHM of 417.2 nm Ga(I) emission peak decreased continuously until the gate delay was increased to 0.7 μs but showed little change for longer gate delays. On the other hand, the SBR had a maximum at the gate delay of 0.7 μs and slightly decreased for longer gate delays. In general, narrower peak width with high SBR value is desirable to avoid spectral interference from neighboring emission lines. Based on these observations, the gate delay for the present experiments was set to 0.7 μs. 图2显示了Ga(I)发射线在417.2 nm处的半峰宽(FWHM)和SBR随门延迟的变化。417.2 nm Ga(I) 发射峰的半峰宽(FWHM)随门延迟的增加而不断降低,直到门延迟为0.7μs后,半峰宽(FWHM)随门延迟的增加则变化不大。另一方面,SBR在门延迟为0.7μs时为最大值,门延迟继续增加SBR略有下降。一般情况下,较窄的峰宽和较高的SBR值可以避免相邻发射线的光谱干扰。基于这些结果,目前实验的门延迟应设置为0.7μs。 图2. 417.204 nm处 Ga线FWHM和SBR随延迟时间变化的函数(激光脉冲能量= 0.9 mJ) Fig. 3(a) shows the emission spectra of the Ga and In obtained from five successive shots under the optimized conditions (laser energy = 0.9 mJ, gate delay = 0.7 μs, and gate width = 3μs). As shown in the figure, strong Ga and In lines are observed at 417.204 and 410.176 nm, respectively. Fig. 3(b) shows the variation of Cu, In, and Ga intensities with respect to laser shot number with the standard deviation of intensity values among the nine laser spots for each shot. It is found that the relative standard deviation (RSD) of the first shot is much greater than that of the following shots. The RSD values of Cu, In and Ga for the first shot were 49%, 31% and 31%, respectively, whereas those obtained from the second to fifth shot were (Cu: 5.6, 3.2, 7.8 and 5.5%), (In: 3.9, 4.2, 4.5 and 4.8%) and (Ga: 4.4, 4.1, 5.3 and 4.7%). Note that the RSDs for the second to fifth shots remained almost constant. Also, as observed in Figs. 3(a) and 3(b), the intensity of the first shot of these elements is much lower than that of the second to fifth shots. One possible explanation for this low signal intensity for the first shot is a smaller ablation mass due to surface effects since elimination of surface contaminants or changes in surface roughness after the first shot can result in different ablation rate [30]. To examine the ablation rate change between the first and second shots, the ablation craters produced by single laser shot and double laser shots were measured using a three dimensional surface profiler as shown in Fig. 4. Using the measured three dimensional profile data, the volume of both craters were estimated to be V1= 3,283 μm3 (volume of the single-shot crater) and V2 = 7,143 μm3 (volume of the double-shot crater). Provided that the ablation volume of the first shot remained the same, the ablation volume due to the second shot becomes 3,860 μm3, approximately 18% increase from that of the first shot. This increase in ablation volume for the second shot is understood as the reason for increased signal intensity. The actual reasons responsible for the surface effects need to be further investigated. Based on the results in Fig. 3, it is reasonable to consider individual or averaged value of emission intensity after the first pulse to estimate the bulk concentrations of chemical constituents of CIGS absorption layer. In this study, we used the second shot data for the analysis of CIGS absorption layer. 图3(a)为优化条件下五次连续剥蚀Ga和In的发射光谱(激光能量= 0.9 mJ,门延迟=0.7μs,门宽= 3μs)。如图所示,在417.204 nm处观察到强Ga线,在410.176 nm处观察到强In线。图3(b)显示了Cu、In和Ga光谱强度随激光剥蚀次数的变化,以及9个采样点每点的强度值的标准差。结果发现,第一次剥蚀的相对标准偏差(RSD)要比接下来剥蚀的RSD大得多。第一次剥蚀的Cu、In和Ga的RSD值分别为49%、31%和31%,而第二到第五次剥蚀的RSD值分别为(Cu: 5.6、3.2、7.8和5.5%)、(In: 3.9、4.2、4.5和4.8%)和(Ga: 4.4、4.1、5.3和4.7%)。请注意,第二到第五次剥蚀的RSD几乎保持不变。同样,从图3(a)和图3(b)可以看出,这些元素的第一次剥蚀的强度远低于第二到第五次剥蚀的强度。第一次剥蚀的信号强度低的一种可能的解释是由于表面效应导致的更小的剥蚀质量,因为在第一次剥蚀后表面污染物的消除或表面粗糙度的变化可以导致不同的剥蚀率。为了检验第一次和第二次剥蚀之间剥蚀率的变化,使用三维表面轮廓仪测量了单次激光剥蚀和双次激剥蚀击产生的剥蚀坑,如图4所示。利用测量的三维轮廓数据,剥蚀坑体积估计为V1 =3,283 μm3 (单次剥蚀剥蚀坑体积)和V2 = 7,143 μm3(双次剥蚀剥蚀坑的体积)。第一次剥蚀的体积保持不变,第二次剥蚀的体积为3,860 μm3,大约比第一次增加了18%。第二次剥蚀时剥蚀量的增加被认为是信号强度增加的原因。造成表面效应的实际原因需要进一步研究。根据图3的结果,考虑使用第一次脉冲后的CIGS吸收层化学成分发射强度的单独或平均值来估计的元素总浓度是合理的。在本研究中,我们使用第二次剥蚀的数据来分析CIGS吸收层。 图3. (a) In (410.176 nm)和Ga (417.204 nm)的发射光谱;(b)随剥蚀次数的增加光谱强度变化(门延迟= 0.7μs、激光脉冲能量= 0.9 mJ) 图4. CIGS吸收层由(a)单次激光剥蚀和(b)双次激光剥蚀产生的剥蚀坑的三维表面轮廓图像 Fig. 5(a) shows the calibration result of Ga peak intensity with respect to XRF cross reference values of Ga concentrations by selecting Cu as an internal standard [29-31]. The Ga concentration in the CIGS layers varied from 2.5% to 10.8% whereas Cu and Se content was almost constant, 21~24 % for Cu and 51~53 % for Se. The data in Fig. 5(a) show reasonable linear correlation with a R2 value of 0.943. In terms of elemental composition of CIGS solar cells, Ga is the substitution element of In such that properly adding Ga in accordance to the relation of [In1-x][Gax] is a crucial factor to realize high efficiency. Therefore, Ga/In ratio is important information in manufacturing point of view. Fig. 5(b) shows the ratio of Ga/In intensities with respect to Ga concentrations which show a good linear correlation similar to the Ga/Cu case with R2 value of 0.962. Note that the standard deviation of the Ga/In signals in Fig. 5(b) is small, which is understood that the variation of Ga and In concentrations over the sample surface is relatively small and can be accurately predicted with LIBS. Thus, the ratio of Ga/In intensities in LIBS measurement of four samples were plotted with respect to the Ga/In composition ratios measured by both XRF and ICP-OES as shown in Fig. 6. The concentration values of Ga and In measured by both methods are listed in Table 1. Although a calibrated XRF system was utilized for the measurements, there still exist uncertainties in the XRF measured concentrations because the XRF concentration data were basically the average values over a spot diameter of 1.27 mm whereas the LIBS measurements were made at much more localized areas with a spot diameter of 150 μm. The ICP-OES measurement of CIGS compositions was carried out for cross check of the XRF results, but it should also be noted that the high dilution required during sample preparation for ICP-OES measurement and possible loss of volatile elements may result in a composition different from the original values. Accordingly, the calibration curves in Fig. 6 should be considered semi-quantitative. Nevertheless, the data in Fig. 6 demonstrate high potential in applying LIBS technique for CIGS composition analysis; the LIBS data with respect to both techniques show high linearity. Therefore, it is expected that more accurate calibration can become possible if the original composition of the sample could be accurately measured. Our future study will focus on improving the reliability of standard concentration measurement in order to enhance the calibration accuracy and thus the applicability of LIBS for solar cell manufacturing. 图5(a)为选择Cu作为内标,Ga峰值强度相对于Ga浓度XRF交叉参考值的校准结果。在CIGS层中,Ga的浓度从2.5%到10.8%不等,而Cu和Se的含量几乎是恒定的,Cu为21~ 24%,Se为51~ 53%。图5(a)中相关系数R2为0.943,具有良好的线性相关性。在CIGS太阳能电池的元素组成方面,Ga是In的替代元素,因此,根据[In1-x][Gax]的关系适当地加入Ga是实现高效率的关键因素。因此,Ga/In比值是制造业的重要信息。图5(b)为与Ga浓度相关的Ga/In强度比值,与Ga/Cu情况相似,R2值为0.962,具有良好的线性相关性。注意图5(b)中Ga/In信号的标准差很小,可以理解为在样品表面的Ga和In浓度的变化相对较小,用LIBS可以准确测量。因此,我们绘制了4个样品的LIBS测量中Ga/In强度比与XRF和ICP-OES测量的Ga/In组成比的关系图,如图6所示。两种方法测定的Ga和In的浓度值如表1所示。虽然使用了校准的XRF系统进行测量,XRF测量浓度仍然存在不确定性,因为XRF浓度数据基本上是直径1.27 mm样品点的平均值,而LIBS测量则是在更大的150μm光斑直径的局部区域采样。对CIGS成分的ICP-OES测量是为了对XRF结果进行交叉检验,但也应该注意到使用ICP-OES测量,样品制备过程中所需的高稀释度和可能损失挥发性元素导致成分与原始值不同。因此,图6中的校准曲线应该被认为是半定量的。然而,图6中的数据显示了LIBS技术在CIGS成分分析中的巨大应用潜力;LIBS数据与这两种方法得到数据显示出很高的线性。因此,如果能够准确地测量出样品的原始成分,就有可能进行更精确的校准。我们未来的研究将聚焦于提高标准浓度测量的可靠性,以提高校准精度,从而提高LIBS在太阳能电池制造中的适用性。 图5. (a) Ga/Cu和(b) Ga/In的强度比作为Ga浓度的函数 图6. 与XRF和ICP-OES数据相关的Ga/In强度比的校准线 表1 用XRF法和ICP-OES法测定了Ga和In的浓度值 样品号 XRF(wt%) 组成ICP-OES(wt%) Ga In Ga In 1 9.52 16.04 8.16 22.20 2 10.26 14.30 7.28 21.94 3 2.54 20.92 4.09 28.98 4 9.72 13.32 7.94 21.86 CONCLUSION 结论 The application of LIBS measurement for the analysis of material composition of CIGS absorption layer was demonstrated. Optimization of measurement parameters for LIBS measurement of thin CIGS layer using Nd:YAG laser was carried out to determine laser pulse energy of 0.9 mJ for spot diameter of 150 nm and gate delay of 0.7 μs for gate width of 3 μs as the optimal conditions. The measured LIBS signal for Ga/In ratios revealed good linearity with respect to Ga concentrations. Despite the uncertainties associated with the reference concentration values measured by XRF or ICP-OES, these initial data represent that LIBS can be a viable technique for real time monitoring of material composition in CIGS solar cell industry. The uncertainty of reference concentration is expected to be reduced by using samples of known compositions. 介绍了LIBS法在CIGS吸收层材料成分分析中的应用。使用Nd:YAG激光器LIBS检测CIGS薄膜的最佳检测条件为激光脉冲能量0.9mJ,光斑直径150μm,门延迟为0.7μs,门宽为3 μs。测定的Ga/In比值LIBS信号与Ga浓度呈良好的线性关系。尽管XRF或ICP-OES测量的参考浓度值存在不确定性,但这些初始数据表明LIBS可以作为CIGS太阳能电池行业中实时监测材料成分的一种可行技术。通过使用已知成分的样品,可以降低参考浓度的不确定度。 ACKNOWLEDGMENT 感谢 This work was supported by the National Research Foundation of Korea (NRF) grant funded by the Korea government (MEST) (No. 2010-0028271). 这项工作得到了韩国政府资助的国家研究基金会(NRF)的支持(MEST) (No. 2010-0028271)。 To be published in Applied Optics OCIS codes: 300.6365, 310.6845, 350.6050. Seok H. Lee1, Hee S. Shim2, Chan K. Kim1, Jong H. Yoo3, Richard E. Russo3,4 and Sungho Jeong1.* 1School of Mechatronics, Gwangju Institute of Science and Technology, 123 Cheomdangwagiro Buk-gu, Gwangju 500-712, Republic of Korea 2Research Institute for Solar and Sustainable Energies (RISE), Gwangju Institute of Science and Technology, 123 Cheomdan-gwagiro, Buk-gu, Gwangju 500-712, Republic of Korea 3Applied Spectra Inc., 46661 Fremont Boulevard, Fremont, CA 94538 4Lawrence Berkeley National Laboratory, 1 Cyclotron Road, Berkeley, CA 94720 介绍了LIBS法在CIGS吸收层材料成分分析中的应用。使用Nd:YAG激光器LIBS检测CIGS薄膜的最佳检测条件为激光脉冲能量0.9mJ,光斑直径150μm,门延迟为0.7μs,门宽为3 μs。测定的Ga/In比值LIBS信号与Ga浓度呈良好的线性关系。尽管XRF或ICP-OES测量的参考浓度值存在不确定性,但这些初始数据表明LIBS可以作为CIGS太阳能电池行业中实时监测材料成分的一种可行技术。通过使用已知成分的样品,可以降低参考浓度的不确定度。
关闭-
1/15
-
2/15
还剩13页未读,是否继续阅读?
继续免费阅读全文产品配置单
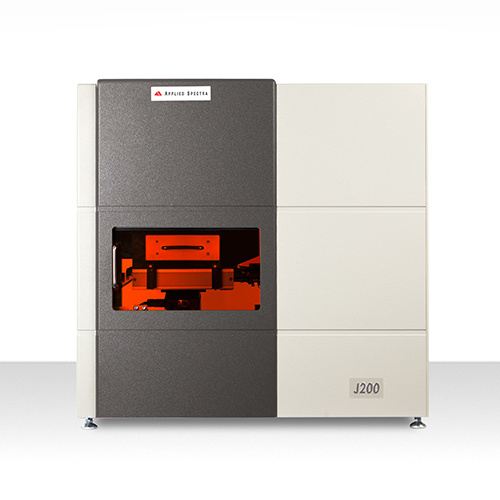
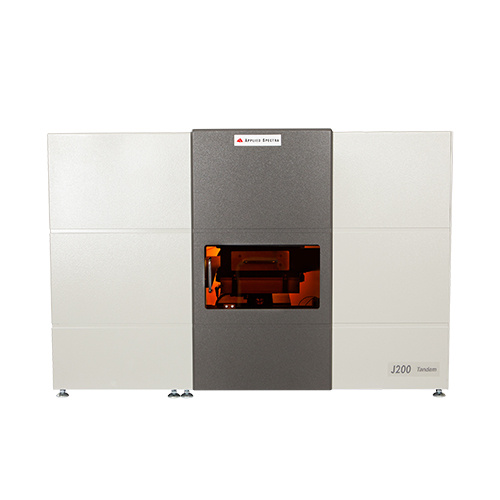
北京富尔邦科技发展有限责任公司为您提供《CIGS太阳能电池吸收层中Ga/In检测方案(激光诱导击穿)》,该方案主要用于太阳能电池中Ga/In检测,参考标准《暂无》,《CIGS太阳能电池吸收层中Ga/In检测方案(激光诱导击穿)》用到的仪器有美国ASI 激光诱导击穿光谱仪(LIBS)。
我要纠错
推荐专场
相关方案


 咨询
咨询

