方案详情文
智能文字提取功能测试中
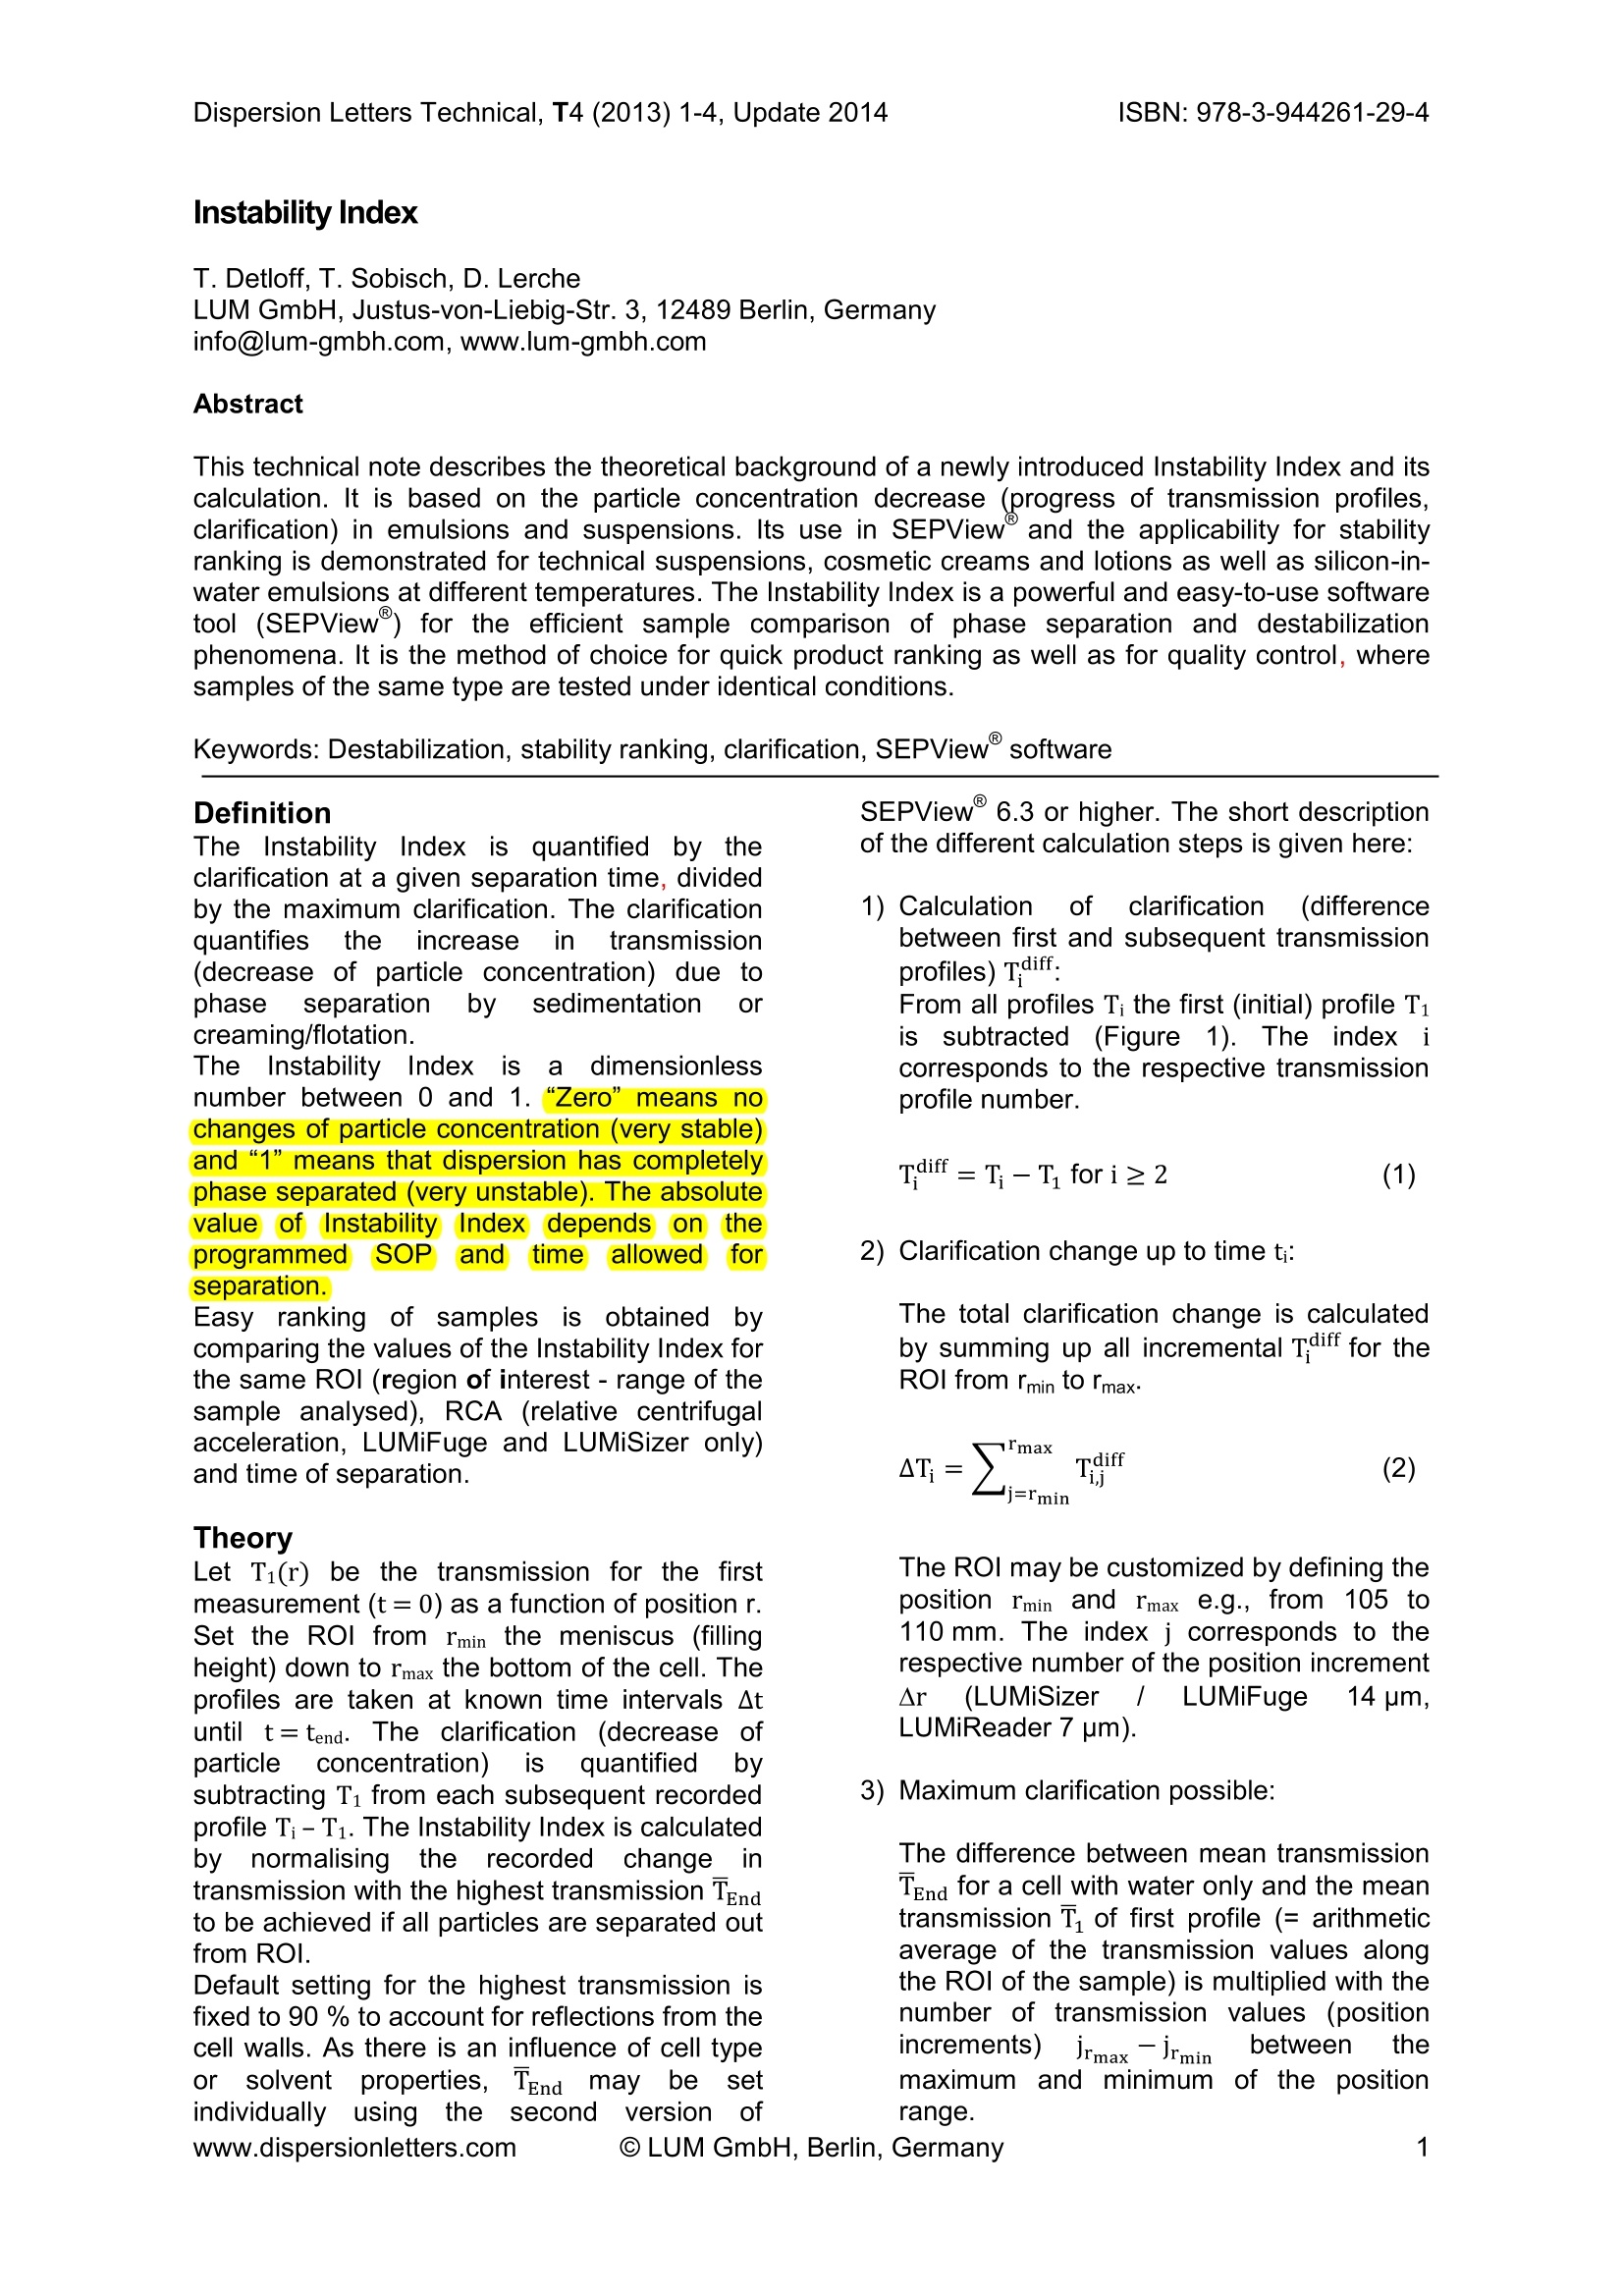
ISBN: 978-3-944261-29-4Dispersion Letters Technical, T4 (2013) 1-4, Update 2014 Dispersion Letters Technical, T4 (2013) 1-4, Update 2014Instability Index, T. Detloff, T. Sobisch, D. Lerche Instability Index T. Detloff, T. Sobisch, D. Lerche LUM GmbH, Justus-von-Liebig-Str. 3, 12489 Berlin, Germany info@lum-gmbh.com, www.lum-gmbh.com Abstract This technical note describes the theoretical background of a newly introduced Instability Index and itscalculation. It is based on the particle concentration decrease (progress of transmission profiles,clarification) in emulsions and suspensions. Its use in SEPView and the applicability for stabinking is deS AlityraS Wfmonstrated for technical suspensions, cosmetic creams and lotions as well as silicon-in-water emulsions at different temperatures. The Instability Index is a powerful and easy-to-use softwaretool (SEPView) for the efficient sample comparison of phase separation and destabilizationphenomena. It is the method of choice for quick product ranking as well as for quality control, wheresamples of the same type are tested under identical conditions. Keywords: Destabilization, stability ranking, clarification, SEPView software Definition The Instability Indexiss quantifiedby theclarification at a given separation time, dividedby the maximum clarification. The clarificationquantifies eincrease in transmission(decrease of particle concentration) due tophaseseparation by sedimentation orcreaming/flotation. The Instability Index is a dimensionlessnumber between 0 and 1.“Zero”means nochanges of particle concentration (very stable)and“1”means that dispersion has completelyphase separated (very unstable). The absolutevalueof InstabilityIndex dependson(theprogrammed SOPandtimeallowedforseparation. Easyyranking of samples issobtainedbycomparing the values of the Instability Index forthe same ROl (region of interest -range of thesample analysed), RCA (relative centrifugalacceleration, LUMiFuge and LUMiSizer only)and time of separation. Theory Let Ti(r) be the transmission for the firstmeasurement (t=0) as a function of position r.Set the ROl from rmin the meniscus (fillingheight) down to r’max the bottom of the cell. Theprofiles are taken at known time intervals Atuntil t=tend.d.The clarification(decreaseparticleconcentration) is quantifiedsubtracting Ti from each subsequent recordedprofile Ti-Ti. The Instability Index is calculatedby normalisingthe recordedd changeintransmission with the highest transmission TEndto be achieved if all particles are separated outfrom ROl. Default setting for the highest transmission isfixed to 90 % to account for reflections from thecell walls. As there is an influence of cell typeor solvent rproperties, TEnd maybe setindividually using theseconddversion ofwww.dispersionletters.com sEPView 6.3 or higher. The short descriptionof the different calculation steps is given here: 1) C(alculationofTCclarification (differencebetween first and subsequent transmissionprofiles) Tdiff: From all profiles T; the first (initial) profile Tissubtractteedd (Figure ‘1). The iinndexicorresponds to the respective transmissionprofile number. 2) Clarification change up to time t: The total clarification change is calculatedby summing up all incremental Tdiff for theROl from rmin to rmax. The ROl may be customized by defining theposition I’min and rmax e.g., from 105 to110 mm. The index j corresponds to therespective number of the position incrementAr (LUMiSizerr/ LUMiFuge 14 pm,LUMiReader 7 um). 3) Maximum clarification possible: The difference between mean transmissionTEnd for a cell with water only and the meantransmission T of first profile (=arithmeticaverage of the transmission values alongthe ROl of the sample) is multiplied with thenumber of transmission values (positionincrements) jrmax -irmin between themaximum and minimum of the positionrange. Dispersion Letters Technical, T4 (2013) 1-4, Update 2014Instability Index, T. Detloff, T. Sobisch, D. Lerche 4) Instability Index: The change AT is divided by the maximumchange possible ATmax. As the InstabilityIndex0quantifies theclarification based on particle separation itshould depend on time of separation at gravityor in centrifugal field. Therefore an appropriateexperimental separation time regarding theexpected stability period(shelf life) of theproduct has to be chosen. ROl and time maybe set for automatic analysis in SEPView. Fig.1:Fingerprintsof 500 nmSilicaa(Top:Transmission, Bottom: Clarification) Example #1 -How to distinguish betweenproducts with different sedimentationstability Figures 2 and 3 show a typical example onhow to distinguish between stable and lessstable suspensions by using the InstabilityIndex. The clarification profiles (Eq. ‘11., insertsSinFigure 2)showparticle sedimentationanddistinct qualitative differences between bothproducts. Product 2 exhibits larger variation, i.e.separation, than Product 1. Thiscan bee quantifieddby calculating theprogress of separation byInstability Indexaccording to Eq. 3. Theblue curve fforProduct 2 in Figure 2 shows for any time largervalues as the red curve for Product 1. An easyranking between different samplesisperformed by comparing the Instability Indexfor a selected appropriate time (cp. red verticalline in chart of Figure 2) in a bar chart. Such acomparison is illustrated by Figure 3. The qualitative conclusion from the clarificationfingerprints is clearly quantified: The InstabilityIndex of Product 1 is 0.16 and for Product 2 itis 0.88 tested under the same experimentalconditions. In other words Instability Index ofProduct 2 reveals a higher degree of phaseseparation than Product 1. It means thatProduct 1 is more stable than Product 2. Fig. 2: Top: Fingerprints (Clarification) for twodifferent products; Bottom: Corresponding InstabilityIndex over time, red curve stable dispersion, bluecurve less stable dispersion. Fig. 3: Comparison of Instability Index as bar chartfor the time selected in Figure 2 (red vertical line inchart of separation curves) Example:#2 一AAcceleratediagingg ttestquantified by LUMiFuge/LUMiSizer The next example illustrates the application ofInstability Index for accelerated evaluation oflong-term stabilit/y of cosmetic products.Freeze/thaw cycles can be used for oil-in-wateremulsions to speed up coalescence [1-5]. Evaluation was performed for a base and non-ionic hydrophilic cream as well as a hand carelotion. The Instability Index was determinedimmediately afterformulation and afterapplying freeze/thaw cycles (24 h at -20℃,24 h at room temperature). Instability Indexwas obtained after 2 hours of centrifugation atRCA=2300 and T=45°℃, in 2 mm PC cells[6]. Figure 4 compares the Instability Index afterformulation before aging tests. The non-ionichydrophilic cream exhibits a very low InstabilityIndex indicating a high stability regardingcreaming. Base cream and hand care lotionexhibit higher Instability Index. Fig. 4: Stability ranking of different oil-in-wateremulsionsimmediately after formulation byInstability Index. Interestingly,/. the latter·twobehavee verydifferent regarding freeze/thaw stress test. AsFigure 5 indicates the non-ionic hydrophilic andbase cream is not vulnerable to freeze/thawcycles and may be classified as stable againstcoalescence. In comparison the hand carelotion underwent considerable destabilisation -indicating high vulnerability towardscoalescence. Example #3 - Emulsion stability measuredin dependence on temperature withLUMiReader Colloidally stable but polydisperse silicone oil-in-water emulsions (stable againstagglomeration and coalescence) were dilutedtroma 10 % m/m emulsion1(silicone oil,Wackerr AK100. Wacker Chemie/AG.Germany) to 0.2 % with deionized water. Fig. 5: Instability Index of oil-in-water emulsionsplotted as function of the number of freeze/thawcycles The original stock emulsion was made with arotor stator homogenizer (Ultra Turrax, IKAWerke GmbH & Co.KG, Germany) at 24.000rpmafterpreparinga pre-emulsionwith1 % m/m emulsifier (Lutensol TO 10, BASFAG, Germany). The stock emulsionwasprepared at Karlsruhe Institute of Technology(KIT), Institute of Process Engineering in LifeSciences Section I: Food Process Engineering(LVT) [3]. For the diluted emulsion the Instability Indexwas obtained by LUMiReader PSA (2 mm PCcells, no inclination, wavelength 870 nm).Samples were analysed at 25°C,30°℃ and45C. The Instability Index was obtained forROI from 37 to 47 mm (Figure 6). Fig. 6: Acceleration of stability testing by elevatedtemperatures of silicone oil-in-water emulsions fordifferent measurement temperatures. It is well known that increase of temperatureresults in an acceleration of destabilizationphenomena [1, 2]. In the above experimentsthis can be easily documented by means of theInstability Index (Figure 6). Two basic causes may be discussed. Firstly,with higher temperature viscosity of continuous phase decreases and according to Stokes lawit leads to a faster separation (creaming) of theoil droplets. Water viscosity decreases from25℃ to 30°℃ by 12%[7] and Instability Indexaccordingly increased by 14%. At 45Cviscosity cannot account alone for the increaseand we have to take into account coalescence,which is enhanced at higher temperatures aswell. This is obvious from Figure 6 by anincrease of Instability Index of 74% at 45°Ccompared to the value at 25C. Viscositychange should only account for about 49 %. Higher coalescence is the second cause forthe 74 % increase. Moreover the polarity of theemulsifierrchanges to become morehydrophobic at higher temperature, whichreduces its stabilization capacity. The aboveeffects are leading to emulsion destabilizationand results in a much higher Instability Index at45°C. Conclusion The Instability Index has been demonstratedas a powerful and easy-to-use tool for earlysample comparison regarding phaseseparation and sample destabilization. It is themethod of choice for quick product ranking aswell as for quality control where samples of thesame type are tested under identical conditions. ( References ) ( [1] T.F.Tadros: A pplied Surfactance, Whiley-VCH, Weinheim, (2005) ) ( [2 2 5 ] ISO/TR 13097:2013 G u idelines f o r the characterization of dispersion stability. ) ( [3]B]G G.G. . Badolato, F. Aguilar, H.P. Schuchmann, T. S o bisch, D. Lerche:Evaluation of long term s t ability of model emulsions b y r m ultisample analyticalcentrifugation, Progr. Colloid P olym. Sci.134 (2008)66-73 ) ( [4] T . Sobisch, U. R ietz, D. Lerche: Easing Formulation of Emulsions and T est for Long Term Stability / L Using iBottom Focussed Backscattering, SOFW Journal 3-2012 42-48 ) ( [5] ] T. Sobisch, D . L erche: A pplication ofmultisample a n alytical centrifugation forfast evaluation o f long term stability andfreeze-thaw s tability of e mulsions, 4 thWorld Congress on Emulsions 2006 Lyon,France 3-6 October, Proceedings CD ) ( [6]Qin nF Pan: U ntersuchung der Stabilitat pharamazeutischer Standardemulsionen mittels analytischer Zentrifugation und verschiedener S t resstests, Bachelorarbeit, ) Anhalt University of Applied Sciences,Studiengang Pharmatechnik,2.6.2010 [7]Weast, R.C. (Ed.), CRC Handbook ofChemistry and Physics, CRC Press Inc.,Boca Raton, Fla., 1980 C LUM GmbH, Berlin, Germany LUM GmbH,Berlin, Germanywww.dispersionletters.com 摘要本技术说明描述了一个新引入的不稳定性指数及其计算的理论背景。该说明基于乳液或悬浊液颗粒浓度的降低(透光率图谱的变化过程,澄清),该技术适用于不同温度条件下技术性悬浊液、化妆品、乳液以及水包硅油乳液的稳定性排序。不稳定性指数可有效地对样品的相分离和不稳定现象进行比较。它是同类型样品在相同条件下快速排序以及质量控制的选择方法。定义不稳定性指数通过在给定的分离时间下的澄清度除以最大澄清度来量化。澄清度量化了由于沉降或乳析引起的相分离而导致的透光率升高(颗粒浓度降低)。不稳定性指数是介于0-1之间的数值。“0”表示颗粒浓度未发生变化(非常稳定),“1”表示分散体已经完全分离(非常不稳定)。不稳定性指数的绝对值取决于程序设置的 SOP和分离时间。通过比较相同 ROI(目标区域-分析的样品范围), RCA(相对离心加速度,只有 LUMiFuge和LUMiSizer)和分离时间下的不稳定性指数的值,可以轻松地对样品稳定性进行排序。示例1 –由LUMiFuge / LUMiSizer量化的加速老化测试该示例说明了不稳定性指数在加速评估化妆品长期稳定性中的应用。冻融循环可用于水包油乳液,以加速聚并。对基础和非离子型亲水性乳霜以及护手乳液进行评估。在配制后和应用冷冻/融化循环后立即测定不稳定性指数(在-20℃下24小时,在室温下24小时)。 使用PC 2 mm样品管,在RCA = 2300和T = 45℃下离心2小时后,获得不稳定性指数。图1比较了样品在制备完成后、老化试验前的不稳定性指数。非离子亲水性乳霜显示出非常低的不稳定性指数,表明相应乳霜的高稳定性。基础霜和护手乳液显示出更高的不稳定性指数。有趣的是,后两者在冻结/解冻应力测试方面表现非常不同。如图2所示,非离子型亲水性乳霜和基础乳霜不易受冻融循环的影响,认为其具有抗聚并稳定性。相比之下,手部护理乳液不稳定指数波动剧烈,这表明其液滴易于发生聚并。示例2 –用LUMiReader测量乳液稳定性随温度的变化用去离子水将多分散稳定水包硅油乳液(抗团聚和聚并稳定)从10%m/m乳液(silicone oil, Wacker AK 100, Wacker Chemie AG, Germany) 稀释至0.2%。使用1%m/m乳化剂(Lutensol TO 10, BASF AG, Germany )制备预乳液后,用高速均质器(Ultra Turrax, IKA Werke GmbH & Co.KG, Germany )以24,000rpm的转速制得原始乳液。对于稀释的乳液,通过LUMiReader PSA(PC2mm样品管,无倾角,波长870 nm)获得不稳定性指数。在25℃,30℃和45℃下分析样品。获得37mm至47 mm的ROI区域的不稳定性指数(图3)。众所周知,温度升高会导致不稳定现象的加速。在上面的实验中,可以通过不稳定性指数轻松地将该变化记录下来(图3)。可以讨论两个基本原因。首先,随着温度的升高,连续相的粘度降低,并且根据Stokes定律,将导致油滴更快的分离(乳析)。相较于25℃,30℃时水的粘度降低12%,不稳定性指数增加14%。在45℃下,不能仅用粘度解释不稳定性指数的增加,我们必须考虑较高温度下聚并现象的增强。从图3中可以明显看出,与25℃时相比,在45℃下不稳定性指数增加了74%,粘度变化应仅占约49%。较高的聚并现象是不稳定指数增加74%的第二个原因。而且,乳化剂的极性在高温条件下变得更疏水,降低了乳化剂稳定性能力。上述原因导致乳液失稳,并导致其在45℃下不稳定性指数高得多。结论不稳定指数已被证明是一种功能强大且易于使用的工具,可用于早期样品相分离和样品失稳的比较。它是在相同条件下对同一类型的样品进行快速产品排名和质量控制的优选方法。
关闭-
1/4
-
2/4

还剩2页未读,是否继续阅读?
继续免费阅读全文产品配置单
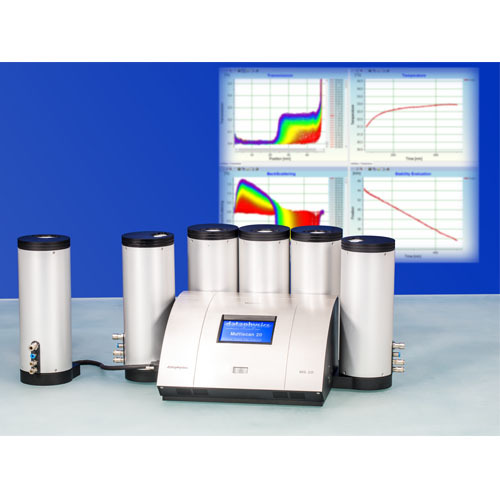
罗姆(江苏)仪器有限公司为您提供《悬浊液、化妆品、乳液以及水包硅油乳液中稳定性检测方案(激光光散射仪)》,该方案主要用于其他中稳定性检测,参考标准《暂无》,《悬浊液、化妆品、乳液以及水包硅油乳液中稳定性检测方案(激光光散射仪)》用到的仪器有罗姆分散体分析仪LUMiSizer ® 650、罗姆稳定性分析仪LUMiFuge ® 110。
我要纠错
相关方案





 咨询
咨询