

方案详情文
智能文字提取功能测试中
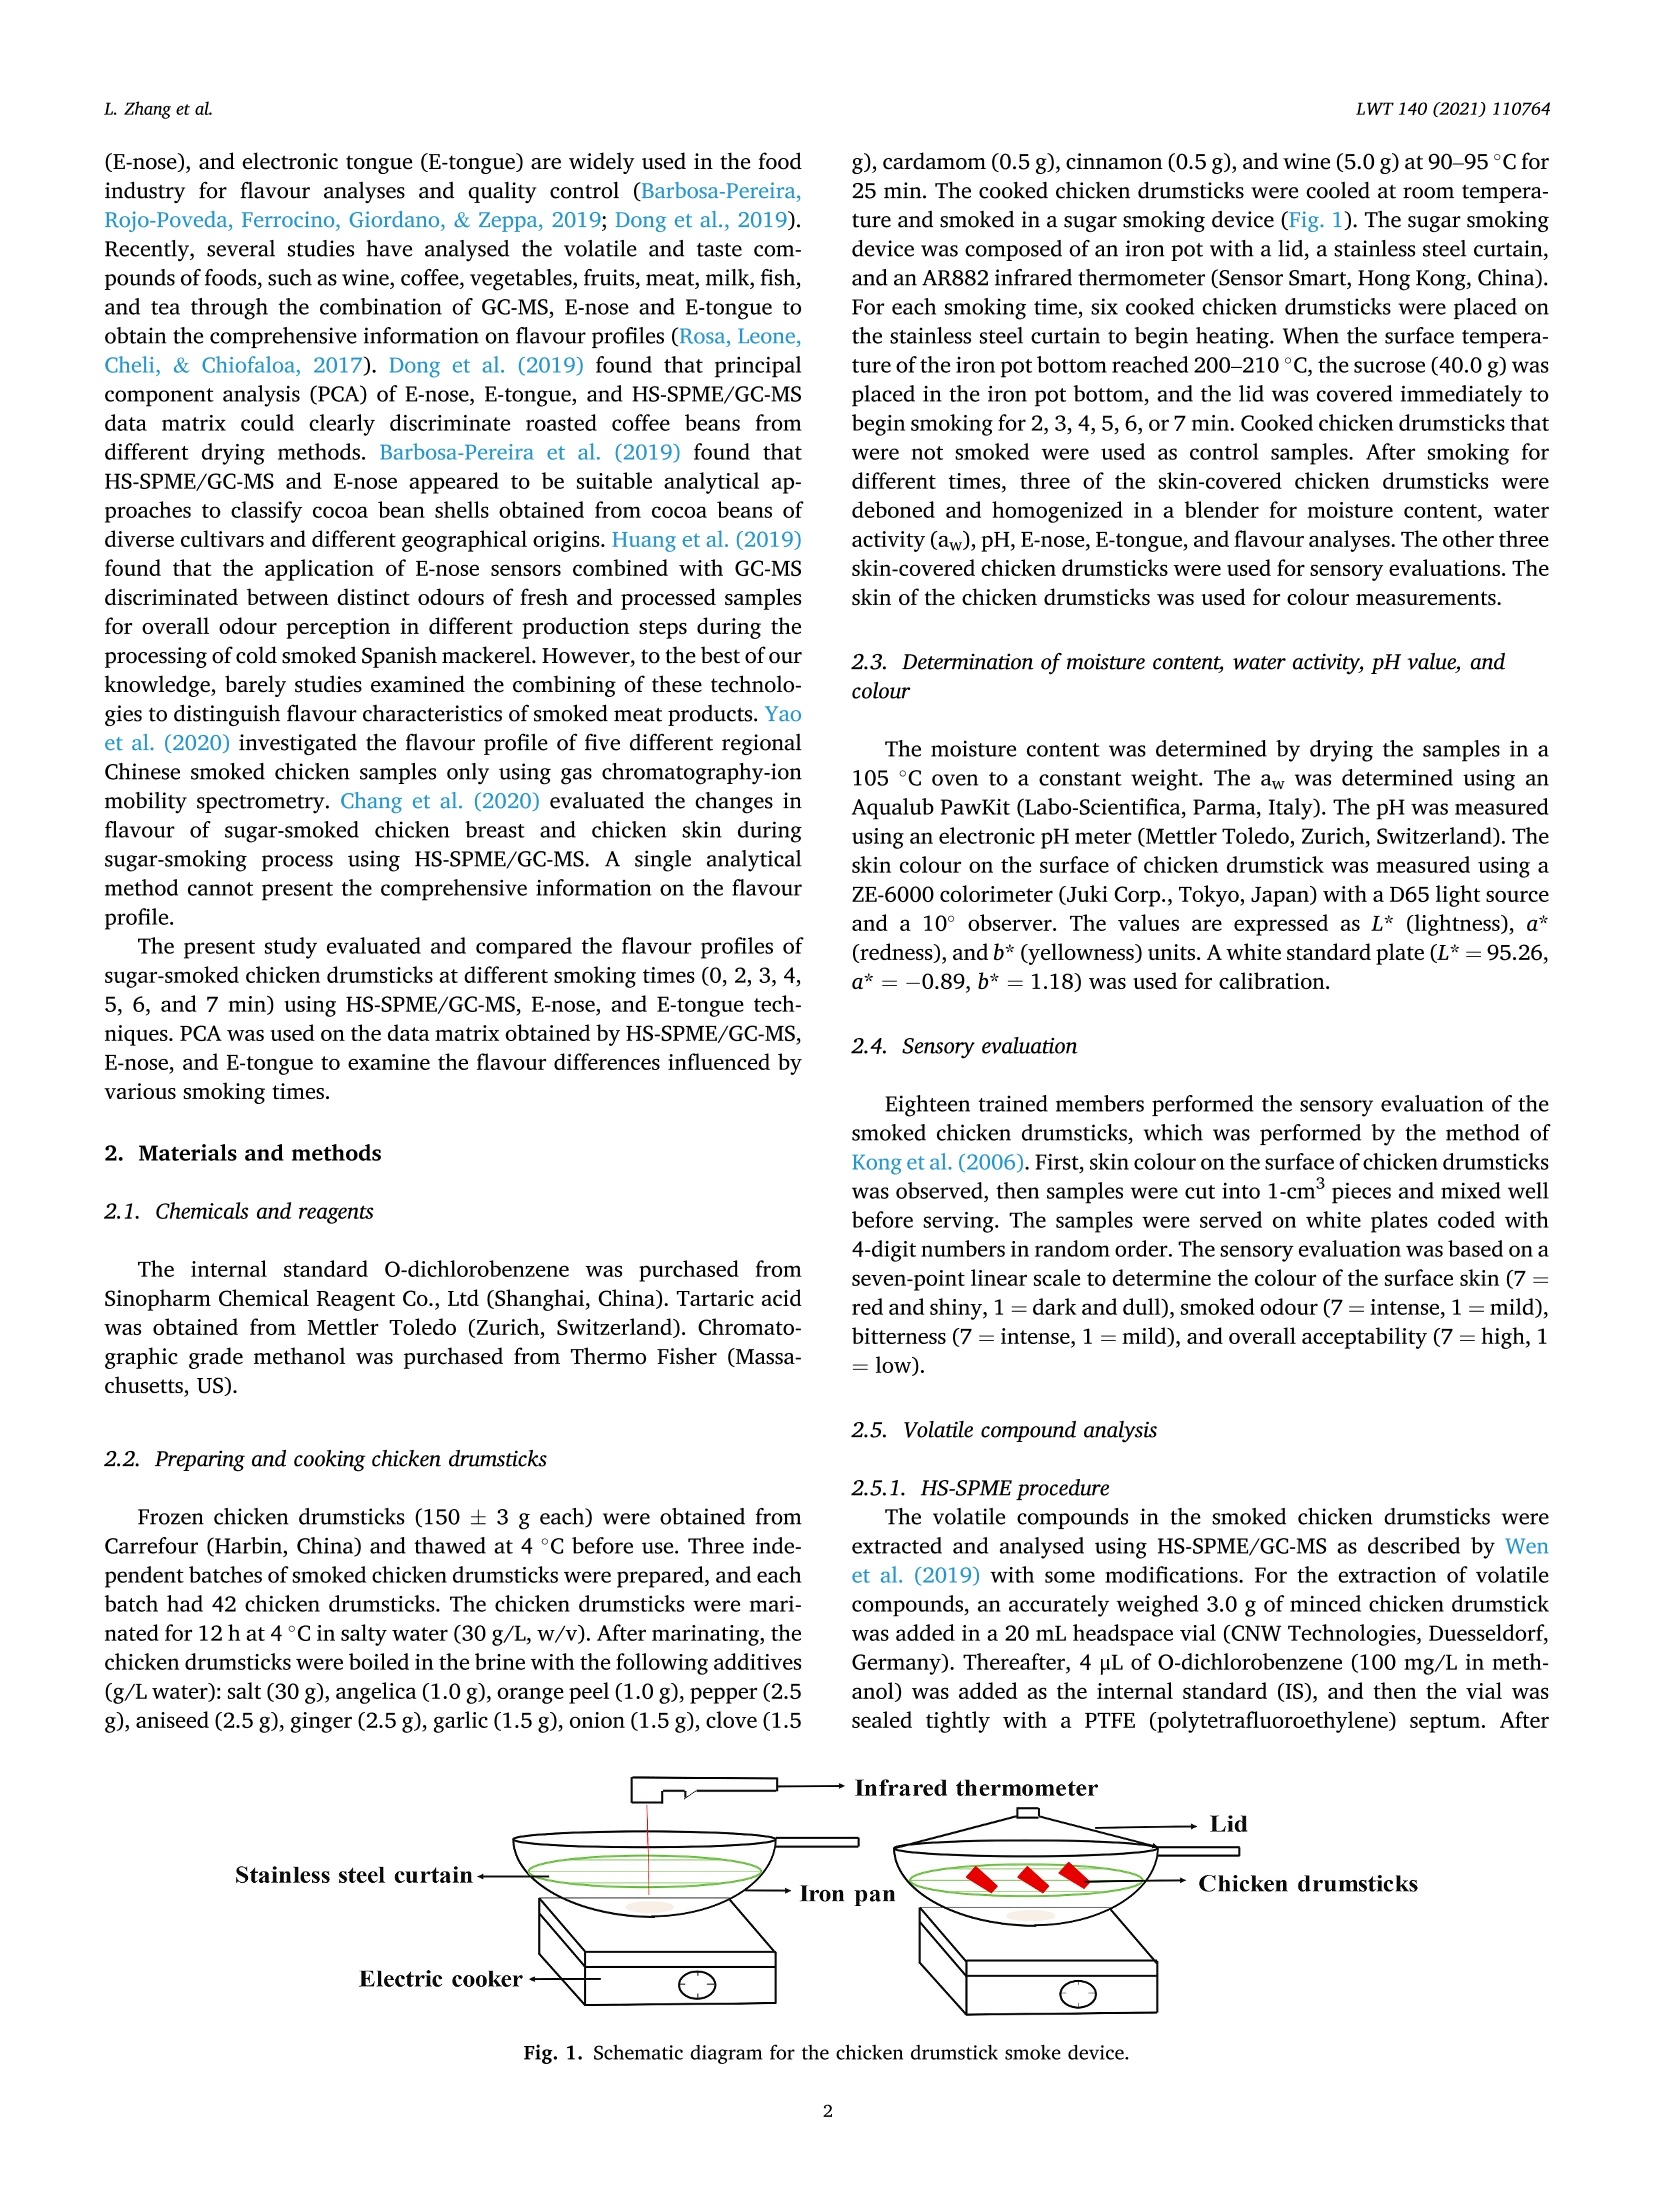
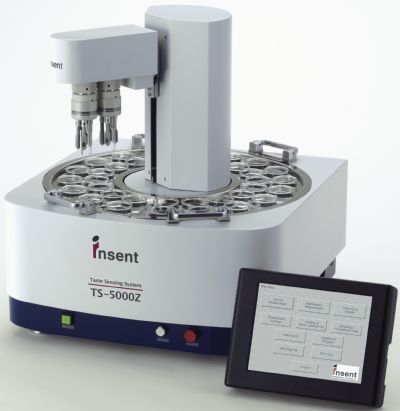
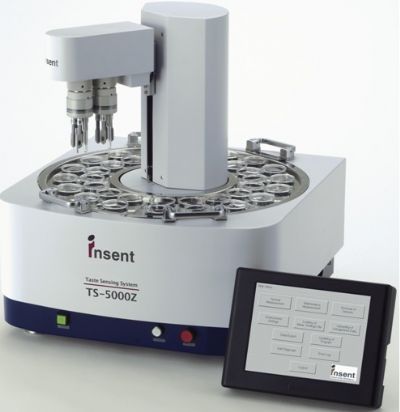
LWT-Food Science and Technology 140 (2021)110764Contents lists available at ScienceDirectLWTjournal homepage: www.elsevier.com/locate/lwt L. Zhang et al.LWT140 (2021)110764 Evaluation of the flavour properties of cooked chicken drumsticks asaffected by sugar smoking times using an electronic nose, electronic tongue,and HS-SPME/GC-MS Lang Z4hang, Yingying Hu, Yan Wang, Baohua Konga,,Qian Chen a,a,** College of Food Science, Northeast Agricultural University, Harbin, Heilongjiang 150030, China ' Shimadzu CO. LTD in China, Shenyang, 110016, China ARTICLEINFO ABSTRACT Keywords:Chicken drumsticksSugar smokingVolatile compoundsElectronic noseElectronic tongue This study evaluated the effect of different sugar smoking times on the flavour profiles of chicken drumsticksusing an electronic nose (E-nose), electronic tongue (E-tongue), and headspace solid-phase microextraction gaschromatography-mass spectrometry (HS-SPME/GC-MS). The moisture content, water activity, pH, and L*-valuedecreased from 71.26% to 65.23%, 0.987 to 0.979, 6.66 to 5.36, and 61.84 to 52.34, respectively (P<0.05). Thea*-value and b*-value increased from 4.96 to 9.65 and 16.61 to 26.45, respectively (P< 0.05) with the increasein smoking times. Seventy-five volatile compounds were identified, and 18volatile compounds were identified askey odour compounds and among them seven key volatile compounds with variable importance in projection(VIP)>1 were detected. Principal component analysis of E-nose, E-tongue, and HS-SPME/GC-MS indicated that3-,4-, and 5-min smoking samples had similar odour and taste profiles. Sensory analysis indicated that the 4-minsample had increased overall acceptability. The correlation analysis of E-nose and key volatile compounds withodour activity value>1 and VIP >1 confirmed that W1C, W3C, and W5C sensors were sensitive to aromaticcompounds, and W2S sensor was sensitive to ketones. These results may provide guidance for smoked chickenproducers to reasonably control flavour formation. 1. Introduction Smoked meat products, such as bacon (Saldana et al., 2018), ham(Petricevica, Radovcicb, Lukicb, Listes, & Medicb, 2018), and smokedchicken (Cheng et al., 2019), are popular with consumers because oftheir unique smoked flavour. Smoking is one of the oldest processingtechnologies for the conserving of meat products via the penetration ofsmoked components into meat products (Malarut & Vangnai, 2018).However, current smoking technology has been mainly used to endowmeat products with a special smoked flavour (Sikorski, 2016). Thesmoked flavour is related to its characteristic volatile flavour com-pounds, which are derived from the pyrolysis of smoking materials, suchas wood and sugar (Sung, 2013). Sucrose is widely used for smoking chicken, fish and soybean prod-ucts in Chinese cuisine. Smoked chicken, especially Goubangzi-smokedchicken, is favoured due to its unique colour and characteristic sugar-smoked flavour (Sung, 2013). The smoked flavour is primarily derived from the caramelization of sugars that occurs at high temperatures andproduces volatile compounds, such as organic acids, carbonyl com-pounds, and furans (Baker, 2007; Paravisini et al., 2017). Paravisiniet al. (2015) reported that acids, furans, and their derivatives give meatproducts a pungent odour, and a fruity and nutty aroma that contributegreatly to the formation of the typical sugar-smoked flavour. Pons,Garrault, Jaubert, Morel, and Fenyo (1991) found that furfural with abitter almond flavour had large effect on the development of a caramelodour. The smoked-flavour is affected by many factors, especially thesmoking temperature and smoking time. In fact, the smoking tempera-ture increased with the extension of smoking time. Sucrose can becracked at different temperature to produce a variety of pyrolysisproducts that have a large effect on quality characteristics of smokedmeat products. Therefore, it is important to choose a proper smokingtime to control the flavour formation. A headspace solid-phase microextraction coupled with gaschromatography-mass spectrometry (HS-SPME/GC-MS), electronic nose ( ** C orresponding author. ) ( E -mail addresses : kongbh 6 3@ho tm ail . com (B. Kong), che n qian e go 7 @ 1 26.com ( Q. Chen). ) ( https: // doi.org / 10 . 1016/j . lwt.2020 . 110764 ) ( Received 8 A ugust 2020; Received in revised form 28 November 20 2 0; Ac c epted 9 December 2020 Available online 24 December 2020 ) ( 0023-6438/C 2020 Elsevier Ltd. Al l r i ghts reserved. ) (E-nose), and electronic tongue (E-tongue) are widely used in the foodindustry for flavour analyses and quality control (Barbosa-Pereira,Rojo-Poveda, Ferrocino, Giordano, & Zeppa, 2019; Dong et al., 2019).Recently, several studies have analysed the volatile and taste com-pounds of foods, such as wine,coffee,vegetables, fruits, meat, milk, fish,and tea through the combination of GC-MS, E-nose and E-tongue toobtain the comprehensive information on flavour profile (Rosa, Leone,Cheli, & Chiofaloa, 2017). Dong et al. (2019) found that principalcomponent analysis (PCA) of E-nose, E-tongue, and HS-SPME/GC-MSdata matrix could clearly discriminate roasted coffee beans fromdifferent drying methods. Barbosa-Pereira et al. (2019) found thatHS-SPME/GC-MS and E-nose appeared to be suitable analytical ap-proaches to classify cocoa bean shells obtained from cocoa beans ofdiverse cultivars and different geographical origins. Huang et al. (2019)found that the application of E-nose sensors combined with GC-MSdiscriminated between distinct odours of fresh and processed samplesfor overall odour perception in different production steps during theprocessing of cold smoked Spanish mackerel. However, to the best of ourknowledge, barely studies examined the combining of these technolo-gies to distinguish flavour characteristics of smoked meat products. Yaoet al.(2020) investigated the flavour profile of five different regionalChinese smoked chicken samples only using gas chromatography-ionmobility spectrometry. Chang et al.(2020) evaluated the changes inflavour of sugar-smoked chicken breast and chicken skin duringsugar-smoking process using HS-SPME/GC-MS. A single analyticalmethod cannot present the comprehensive information on the flavourprofile. The present study evaluated and compared the flavour profiles ofsugar-smoked chicken drumsticks at different smoking times (0, 2, 3, 4,5, 6, and 7 min) using HS-SPME/GC-MS, E-nose, and E-tongue tech-niques. PCA was used on the data matrix obtained by HS-SPME/GC-MS,E-nose, and E-tongue to examine the flavour differences influenced byvarious smoking times. 2. Materials and methods 2.1. Chemicals and reagents The internal standard O-dichlorobenzene was purchased fromSinopharm Chemical Reagent Co., Ltd (Shanghai, China). Tartaric acidwas obtained from Mettler Toledo (Zurich,Switzerland). Chromato-graphic grade methanol was purchased from Thermo Fisher (Massa-chusetts, US). 2.2. Preparing and cooking chicken drumsticks Frozen chicken drumsticks (150 ± 3 g each) were obtained fromCarrefour (Harbin, China) and thawed at 4°C before use. Three inde-pendent batches of smoked chicken drumsticks were prepared,and eachbatch had 42 chicken drumsticks. The chicken drumsticks were mari-nated for 12 h at 4°C in salty water (30 g/L, w/v). After marinating, thechicken drumsticks were boiled in the brine with the following additives(g/L water): salt (30 g), angelica (1.0 g), orange peel (1.0g), pepper (2.5g), aniseed (2.5 g), ginger (2.5g), garlic (1.5 g), onion(1.5 g), clove (1.5 g), cardamom(0.5 g), cinnamon (0.5 g),and wine (5.0 g) at 90-95°C for25 min. The cooked chicken drumsticks were cooled at room tempera-ture and smoked in a sugar smoking device (Fig. 1). The sugar smokingdevice was composed of an iron pot with a lid, a stainless steel curtain,and an AR882 infrared thermometer (Sensor Smart, Hong Kong, China).For each smoking time, six cooked chicken drumsticks were placed onthe stainless steel curtain to begin heating. When the surface tempera-ture of the iron pot bottom reached 200-210°C, the sucrose (40.0 g) wasplaced in the iron pot bottom, and the lid was covered immediately tobegin smoking for 2, 3, 4,5, 6, or 7 min. Cooked chicken drumsticks thatwere not smoked were used as control samples. After smoking fordifferent times, three of the skin-covered chicken drumsticks weredeboned and homogenized in a blender for moisture content, wateractivity (aw), pH, E-nose,E-tongue, and flavour analyses. The other threeskin-covered chicken drumsticks were used for sensory evaluations. Theskin of the chicken drumsticks was used for colour measurements. 2.3. Determination of moisture content, water activity, pH value, andcolour The moisture content was determined by drying the samples in a105 °C oven to a constant weight. The aw was determined using anAqualub PawKit (Labo-Scientifica, Parma, Italy). The pH was measuredusing an electronic pHmeter (Mettler Toledo, Zurich, Switzerland). Theskin colour on the surface of chicken drumstick was measured using aZE-6000 colorimeter (Juki Corp., Tokyo, Japan) with a D65 light sourceand a 10°observer. The values are expressed as L* (lightness), a*(redness), and b*(yellowness) units. A white standard plate (L*=95.26,a*=-0.89,b*=1.18) was used for calibration. 2.4. Sensory evaluation Eighteen trained members performed the sensory evaluation of thesmoked chicken drumsticks, which was performed by the method ofKong et al. (2006). First, skin colour on the surface of chicken drumstickswas observed, then samples were cut into 1-cm’ pieces and mixed wellbefore serving. The samples were served on white plates coded with4-digit numbers in random order. The sensory evaluation was based on aseven-point linear scale to determine the colour of the surface skin (7=red and shiny, 1=dark and dull), smoked odour (7= intense,1=mild),bitterness (7=intense, 1=mild), and overall acceptability (7=high, 1=low). 2.5. Volatile compound analysis 2.5.1. HS-SPME procedure The volatile compounds in the smoked chicken drumsticks wereextracted and analysed using HS-SPME/GC-MS as described by Wenet al. (2019) with some modifications. For the extraction of volatilecompounds, an accurately weighed 3.0 g of minced chicken drumstickwas added in a 20 mL headspace vial (CNW Technologies, Duesseldorf,Germany). Thereafter, 4 uL of O-dichlorobenzene (100 mg/L in meth-anol) was added as the internal standard (IS), and then the vial wassealed tightly with a PTFE (polytetrafluoroethylene) septum. After Fig. 1. Schematic diagram for the chicken drumstick smoke device. equilibrating at 50 °C for 25 min, a 50/30-um-thick well-conditionedSPME fiber coated with divinylbenzene/carboxen/polydimethylsilox-ane (DVB/CAR/PDMS) (Supelco, Bellefonte, PA, US) was insertedthrough the septum and exposed to the headspace of the SPME vial forextraction at 50 °C for 40 min. After extraction, the fibre was insertedinto the injection port of the GC system in splitless mode and desorbed at230°C for 3 min. 2.5.2. GC-MS conditions GC-MS analyses were performed on a Shimadzu 2020 NX gas chro-matography/mass spectrometry (GC/MS) system (Shimadzu Corpora-tion, Kyoto, Japan) with an InertCap WaX (60 m x 0.25 mmx0.25 um)capillary column. The oven time-temperature programme was as fol-lows: initial temperature 35°C held for 8 min, from 35°C to 74°C at arate of3 °C/min, then from 74 °C to 155°C at a rate of 3°C/min, andultimately reached 210 °C at a rate of 15°C/min and held for 2 min.Helium was used as a carrier gas at a flow rate of 1.0 mL/min. The ionsource temperatures were 230°C, and the mass spectrometer scannedmasses over the range m/z 45-500. The identification of the volatilecompounds was achieved via comparisons of the experimental massspectra to a mass spectra library from NIST17 and via comparison oftheir linear retention indices (LRI), which were calculated by runningC9-C33 n-alkanes under the same chromatographic conditions andcompared with literatures (Hu et al., 2019; Yin et al., 2020). The resultswere identified when the degree of similarity was greater than 90%. Thevolatile compounds were semi-quantified by dividing the peak areas ofthe compounds of interest by the peak area of the IS and multiplying thisratio by the initial concentration of the IS (expressed as ug/kg). 2.6. Odour activity value The odour activity value (OAV) represents the contribution of vola-tile compounds to flavour, and it was calculated by dividing the con-centration of volatile compounds by their threshold values (Olivares,Navarro, & Flores, 2009). The odour threshold values of these com-pounds were obtained from the Flavour-Base 10th Edition (http://www.leffingwell.com/flavbase.htm). 2.7. Electronic tongue analysis The minced smoked chicken drumstick (30.0 g) was mixed with 150mL of distilled water to extract taste substances. After centrifugation, thewater phase was obtained for E-tongue measurement. The TS-5000Z E-tongue instrument (Insent Inc., Atsugi-shi, Japan) was used to analysechicken drumstick taste attributes. The E-tongue contained five chemi-cal sensors: CA0 (sourness sensor), AE1 (astringency sensor), AAE(umami sensor), CTO (saltiness sensor), Coo (bitterness sensor), whichare potentiometric sensors with an organic membrane coating withspecific sensitivity and selectivity for each sensor. Prior to analysis,sensors were calibrated and diagnosed. For testing, 70 mL of the sampleextraction was divided evenly into two parts and placed into two 50-mLsample cups. The sensors were washed in a cleaning solution (30 mMKCl+ 0.3 mM tartaric acid, 90 s) and reference solutions (30 mM KCl +0.3 mM tartaric acid, 120 s + 120 s). The sensors were dipped in thesample solution for 30 s. 2.8. Electronic nose analysis The E-nose analysis was performed using a commercial PEN3.5electronic nose (Win Muster Airsense Analytics Inc., Schwerin, Ger-many). Thestructure of the E-nose consisted of pattern recognitionsoftware and a sensor array unit. It had 10 metal oxide semiconductors,including W1C, W1S, W1W, W2S, W2W, W3C, W3S, W5C, W5S, andW6S, for the specific recognition of different volatile compounds. Thesensors are described in Table 1. Smoked chicken drumsticks (3.0 g)were put in a 20-mL airtight vial and incubated for 45 min at 50 °C. A Electronic nose (E-nose) sensors and their representative materials. Sensor Representative material Representative material name species W1C Aromatic compounds Sensitive to aromatic constituents, benzene W5S Broad range Sensitive to nitrogen oxides W3C Aromatic Sensitive to aroma, ammonia W6S Hydrogen Sensitive to hydrides W5C Arom-aliph Sensitive to short-chain alkane aromatic component W1S Broad-methane Sensitive to methyl W1W Sulphur-organic Sensitive to sulfides W2S Broad-alcohol Sensitive to alcohols, aldehydes and ketones W2W Sulph-chlor Sensitive to organic sulfides W3S Methane-aliph Sensitive to long-chain alkanes hollow needle with tubing was used to pierce the seal of the vial andabsorb the volatile gases from the headspace at a constant rate. Thevolatile gases were replaced by clean air, which was supplied through asecond hollow needle with a charcoal filter. The measurement time was60 s, and the clean air was applied to flush the chamber until the sensorsignals returned to baseline. 2.9. Statistical analysis The data were analysed using the General Linear Models procedureof the Statistix 8.1 software package (Analytical Software, St Paul, MN,US), and the results are expressed as the means ± standard error.Analysis of variance (ANOVA) with Tukey's multiple comparison testwere used to assess the significance of the treatment effects (P <0.05).PCA was performed in SPSS 22.0 (IBM, New York, US). Partial least-squares discriminant analysis (PLS-DA) was performed using SIMCA16.0.1 (Umetrics, Umea, Sweden). Three independent batches ofsmoked chicken drumsticks (replicates) were prepared, and the mea-surements, including moisture content, water activity, pHvalue, colour,sensory evaluation and volatile compounds, were performed in triplicatefor each batch of smoked chicken drumsticks. E-nose and E-tongue an-alyses for each batch of smoked chicken drumsticks were prepared insextuplicate. Data of volatile compounds and physicochemical proper-ties of smoked chicken drumsticks were analysed using a mixed pro-cedure where different smoking times were used as the fixed effect, andreplicates (n =3) were used as random effects. Data of sensory evalu-ation were also analysed using a mixed model where panellist and ses-sion were the fixed (the same 18 assessors for each session) and randomterms,respectively, and the other fixed effects in the model included thesensory attributes and different treatments. 3. Results and discussion 3.1. Moisture content, water activity,pH, and colour As shown in Table 2, the moisture content decreased from 71.26%(control samples) to 65.23% (7-min samples) with increased smokingtime (P <0.05), which was comparable with our previous result that themoisture content in smoked chicken was in range of 64.59%-67.63%(Zhang, Du, Zhang, Kong,& Liu, 2020). A reduction in moisture contentmay have occurred because prolonged smoking times increase water lossin products. The aw also decreased with the extension of smoking time(P <0.05) and had a similar trend as the moisture content. The pHdecreased from 6.66 to 5.36 in smoked chicken drumsticks withincreased smoking times from 0 to 7 min. This result may have occurredbecause some organic acids in the smoke were deposited on the surfaceof the product or infiltrated into the product (Malarut & Vangnai, 2018).The surface L*-value of samples significantly decreased, and a*-valueand b*-value significantly increased as the smoking times prolonged (P Table 2 The effects of different smoking times on moisture content, water activity (aw),pH and colour in chicken drumsticks. Smoking Moisture aw pH L*. a*- b*- times (min) content value value value (%) 0 (Control) 71.26± 0.987 ± 6.66 61.84 4.96± 16.61 0.96° 0.001° 十 十 0.71 0.11 0.89 1.70 2 70.25± 0.984± 6.55 60.06 6.82± 20.87 0.78ab 0.001ab 土 0.87 土 0.01 0.81 1.83° 3 69.04± 0.983± 6.19 56.95 8.25± 25.24 0.20bc 0.002bc 士 十 0.14” 土 0.08 1.43 1.09 4 67.15± 0.982± 5.96 55.27 8.75± 25.57 0.14 0.001bc 十 ± 0.34ab 十 0.02bc 1.90 1.45ab 5 66.13± 0.982 ± 5.87 54.61 9.65± 26.45 1.41° 0.001cd 十 土 0.11 土 0.02 1.27 1.23° 6 65.76± 0.979± 5.54 53.19 9.18± 25.71 1.15 0.001d 土 0.27ab 土 0.32° 1.92 1.10ab 7 65.23± 0.979± 5.36 52.34 9.08± 25.95 1.00 0.001° 十 土 0.28ab 0.26° 2.05° 1.63ab Mean within the same column with different letters differ significantly (P <0.05). All data are expressed as the mean ± standard error of triplemeasurements. < 0.05). The changes in the surface colour of samples were influenced bythe deposition of smoke particles and caramelization and Maillard re-actions between smoke compounds, such as carbonyl groups, and foodcomponents. Both reactions are important in the occurrence of colourson the surface of smoked chicken (Ledesma, Rendueles, & Diaz, 2016;Yang et al., 2019). 3.2. Sensory evaluation The sensory panel analysis of the smoked chicken drumsticks isshown in Table 3. The 4-, 5-, 6-, and 7-min samples had higher colourscores than the other samples (P<0.05). The sensory evaluation resultsfor colour were in accordance with the results of the a*-value and b*-value, where 4-,5-,6-, and 7-min samples had higher a*-values and b*-values compared to the control and 2-min samples. The smoked odour oflong smoking time samples (6 and 7 min) were more acceptable thanshorter time samples (P <0.05). The highest bitterness score wasobserved in the 7-min smoked samples between all of the samples Table 3 Sensory evaluation of smoked chicken drumsticks with different smoking times. Smoking Colour Smoked Bitterness Juiciness Overall times (min) odour acceptability 0 (Control) 1.22± 1.46± 4.48± 3.68±1.06 0.43 0.61 1.45 2 4.01± 3.53± 3.06± 4.55± 4.13±0.73bc 0.85 1.05° 1.05 0.95° 3 3.92± 3.94± 3.74± 4.26± 4.81±0.91ab 1.17° 1.32bc 0.93bc 1.17 4 5.21± 4.91± 4.27 ± 4.09± 5.15±1.08 0.81 1.0zab 1.0zab 0.99 5 5.21± 5.04± 4.63± 4.20± 3.96±1.02bc 0.79 1.07ab 0.59ab 0.91a 6 5.90± 5.12± 5.02± 4.31± 3.83±0.75 0.91ab 1.03 0.85 1.16°a 7 6.16± 5.22± 5.10± 4.08± 3.65±0.85 0.80° 1.27° 1.18 0.92 a-d Means within the same column with different uppercase letters differsignificantly (P<0.05). All data are expressed as the means ± standard error oftriple measurements. -: smoked aroma not detected. analysed (P <0.05). No significant differences were observed in thejuiciness among the different samples (P > 0.05). Notably, the 4-minsmoked chicken drumsticks had the highest overall acceptability (P<0.05), which indicates that the appropriate smoking time had highersensory acceptability. 3.3. Volatile compounds and OAV analyses A total of 75 volatile compounds were detected in smoked chickendrumstick samples. The volatile compounds were primarily composed ofalcohols (9), aldehydes (16), acids (3), esters (3), phenols (9), furans (8),ketones (20) and other compounds (7) (Table 4). The OAV of the volatilecompounds of smoked chicken drumsticks with different smoking timesis presented in Table 5. Among the alcohols, 1-octen-3-ol showed the highest amount(578.52 ug/kg) in control samples, and it decreased significantly withthe prolongation of smoking time (P<0.05). In the 3-min samples, thelevels of terpinen-4-ol (261.23 pg/kg) and linalool (159.68 pg/kg) weresignificantly higher than the other smoking times (P <0.05). Alcoholsare formed by sugar metabolism, lipid oxidation and the decarboxyl-ation and dehydrogenation of amino acids (Armenta, Garrigues, & de laGuardia, 2007; Hernandez-Orte et al., 2008).Based on OAV, the maincontributors to smoked chicken drumsticks were 1-octen-3-ol andlinalool. 1-octen-3-ol, based on its strong OAV (578.52), may be animportant contributor to the green, fruity and mushroom aromas of thecontrol samples (Yang & Chiang, 2019). The other important alcoholcompound was linalool, which provided samples with a characteristicbreeze odour that is primarily derived from spices, such as clove,tangerine peel and ginger, during cooking (Kim,Jang,& Lee,2018). Yaoet al. (2020) also found that linalool was characteristic flavour substancein the Goubangzi smoked chicken and derived from the spice. Aldehydes are the dominant volatile compounds in smoked meatproducts. In control samples, some aldehydes, including hexanal(2802.70 pg/kg), nonanal (478.86 pg/kg), and octanal (299.67 ng/kg),were significantly higher than the other smoking times (P<0.05). Thesealdehydes come primarily from the oxidative degradation of unsatu-rated fatty acids (Sabio, Vidal-Aragon, Bernalte, & Gata, 1998). In the7-min samples, the contents of furfural (6144.50 ng/kg) and 5-methylfurfural (2805.63 pg/kg) were significantly higher than the othersmoking times (P <0.05). Furfural and 5-methyl furfural are primarilyderived from the pyrolysis of sucrose during smoking (Perez & Yaylayan,2008). Furfural could be also produced as a flavour active intermediatepresent in the early stages of the Maillard reaction and a precursor ofother heterocyclic compounds (Chang et al., 2020). The OAV of ninealdehydes was greater than 1, including valeraldehyde,hexanal, octa-nal, nonanal, (E)-2-octenal, furfural, decanal, 5-methyl furfural, andp-anisaldehyde. The odour threshold of aldehydes was generally lowerthan other volatile compounds, and these aldehydes play an importantrole in the total odour of smoked chicken drumsticks (Selli & Cayhan,2009). Higher OAV values of furfural and 5-methyl furfural wereobserved in the 6- and 7-min samples than the other times. Furfural and5-methyl furfural may provide 6- and 7-min chicken drumsticks with astrong woody, toasty and caramel odour (Sung, 2013), which is inaccordance with the results of the sensory evaluation, which showedthat the 6- and 7-min samples had higher smoked odour scores. Theresults of the E-nose also demonstrated that the 6-and 7-min sampleshad high response values at sensor W2S. Three acids were identified in smoked chicken drumsticks. The levelsof 3-methyl-2-furoic acid (67.07 rg/kg) and 3-benziykacrylic acid(72.61 ug/kg) in 7-min samples were significantly higher than the othertimes (P <0.05), and the content of acetic acid (84.61 rg/kg) wassignificantly higher than the other times, except the 5-min samples.These results are consistent with pH and E-tongue. Acids likelycontribute little to the flavour because these components generally havehigh odour detection thresholds (Pino, Tolle, Gok, & Winterhalter,2012). Table 4 Concentrations (rg/kg) of the volatile compounds detected in smoked chicken drumsticks with different smoking times. Compound RT LRI Concentration (ug kg) (min) 0 (Control) 2 3 4 5 6 7 1-(2-methyl-1-cyclopentenyl) 18.91± 33.95± 48.96± 57.51± 69.00± 112.32± ethanone 0.95 1.70° 2.45 2.88° 3.45 5.62 4-allylanisole 25.716 1333 42.89±2.14° 127.33± 161.91± 49.72± 107.03± 125.15± 58.37 ± 6.37b 8.10 2.49de 5.35° 6.26 2.92° 3-acetoxypyridine 28.297 1389 3.33±0.17° 87.55± ND 198.48± 259.85± 275.01± 381.02± 4.38 9.92 12.99 13.75 19.05 cis-anethol 29.341 1412 148.02± 335.22± 420.34± 434.54± 513.09± 598.38± 228.32± 7.40 16.76° 21.02 21.73° 25.65 29.92° 11.42° o-ethoxytoluene 30.425 1437 ND 33.90± 19.40± 34.22± 27.19± 48.10± 100.75± 1.70° 0.97° 1.71 1.36° 2.41 5.04 4-methylumbelliferone 38.738 1642 22.11±1.11° 20.13± 34.92± 60.83± 63.58± 80.64± 154.14± 1.01° 1.75° 3.04° 3.18° 4.03 7.71 Means within the same line with different uppercase letters differ significantly (P <0.05). All data are expressed as the means ± standard error of triple mea-surements. RT: retention time; LRI: linear retention index. ND: volatile compounds not detected. Table5 Odour activity value (OAV) of volatile compounds of smoked chicken drumsticks with different smoking times. Compound OT (ugL- of water) OAV 0 (Control) 2 3 4 5 6 7 1-octen-3-ol 1 578.52 245.71 59.94 56.19 36.97 49.67 26.52 linalool 6 8.59 23.01 26.61 6.86 18.56 18.20 5.58 valeraldehyde 12 15.64 7.14 - hexanal 4.5 622.82 301.45 54.11 42.34 30.22 27.18 11.37 octanal 0.7 428.10 227.15 82.15 68.03 51.54 66.51 49.88 nonanal 1 478.86 334.77 239.66 168.42 92.66 124.31 112.05 (E)-2-octenal 40 1.65 0.65 0.78 <1 <1 furfural 3 434.73 1516.42 1649.63 1864.13 1816.49 1874.83 2048.17 decanal 0.3 239.94 82.72 一 86.49 5-methylfurfural 50 5.49 21.33 33.03 36.42 36.09 45.57 56.11 p-anisaldehyde 47 1.56 2.18 2.43 2.71 2.18 2.54 2.06 p-cresol 55 一 <1 <1 <1 <1 1.20 eugenol 6 125.63 181.42 274.97 175.74 251.68 225.56 136.86 (E)-2-methoxy-4-(prop-1-enyl)phenol 10 0.26 7.83 4.193 3.28 3.93 4.09 4.96 2,3-octanedione 12 55.48 20.71 5.40 3.68 1.33 1.40 <1 acetophenone 65 <1 <1 <1 1.19 1.09 1.93 3.60 3'-methylacetophenone 0.03 一 一 477.68 1191.50 3137.26 cis-anethol 73 2.028 4.59 5.76 5.95 7.03 8.20 3.13 OT: odour thresholds in water;OAV not calculation. Three esters were identified and quantified in smoked chickendrumsticks. The levels of vinyl propionate and methyl 2-furoate in 7-minsamples were significantly higher than the other smoking times (P <0.05). Eugenol acetate showed the highest values in 2-min samples anddecreased significantly with the prolongation of smoking times (P <0.05). Esters are primarily derived from the esterification between al-cohols and acid compounds and produce floral and fruity aromas (Yu,Xie, Xie, Ai, & Tian, 2019). Phenols have large effect on the formation of the wood-smokedodour (Pino, 2014). The present study identified nine phenols, andeugenol (1649.80 pg/kg) in the 3-min samples was significantly higherthan the other times, which likely developed with the use of clove. Theconcentrations of some compounds, including phenol (200.47 ug/kg),o-cresol (166.32 ng/kg), and p-cresol (65.83 pg/kg), in 7-min sampleswere significantly higher than the other smoking times (P <0.05). Themain contributors to the smoked odour from phenols were p-cresol,eugenol, and (E)-2-methoxy-4-(prop-1-enyl)phenol based on theirhigher OAV. Kosowska, Majcher, Jelen, and Fortuna (2018) demon-strated that (E)-2-methoxy-4-(prop-1-enyl)phenol together with otherphenols imparted a smoky and pungent flavour note to smoked foods. Furans result from the enolization and dehydration reactions ofcarbohydrates (Sung, 2013). Furans soften the heavy odour accompa-nied by phenolic volatile compounds (Radecki, Grzybowski, Halkiewicz,& Lamparczyk, 1977). The contents of 2-acetylfuran, 2-methyl-benzofuran, 5-methyl-2-acetylfuran, and 2-furfuryl-5-methylfuran in7-min samples were significantly (P <0.05) higher than the other times. These furans contribute to products with sweet, fruity, and grassy odour(Joseph, 1987). There were seven other kinds of volatile compounds in chickendrumsticks. Cis-anethol may be derived from spices during cooking, andit showed a very high OAV, may have greatly contributed to the overallflavour. 3.4. Partial least-squares discriminant analysis ofkey volatile compounds PLS-DA of key volatile compounds that was performed on the datamatrix (7 treatments x 18 volatile compounds with OAV > 1) is presented in Fig. 2. PLS-component ti represents 65.20% of the totalvariance, and PLS-component t2 represents 18.60% of the total variance.As shown in Fig. 2A, the control samples were far away from the sampleswith different smoking times. Among the samples with different smok-ing times, the 3-, 4-, 5-min, and 6-min smoked samples were close toeach other, but far away from the 2- and 7-min smoked samples. The nonanal, (E)-2-octenal, valeraldehyde, 2,3-octanedione, decanal, 1-octen-3-ol, hexanal, and octanal were high positively correlated withPLS-component ti and primarily distinguished control and 2-min sam-ples from other smoked samples, which is consistent with the results ofHS-SPME/GC-MS that the contents of these compounds were high incontrol and 2-minSsmokedsamples. 3'-Methylacetophenone, PLS-component t (B) 1.8 1.6 1.44 Fig. 2. The partial least squares discriminant analysis (PLS-DA) based on key volatile compound data (OAV >1) for smoked chicken drumsticks with differentsmoking times (A) and the variable importance in the projection (VIP) values (B). acetophenone, and p-cresol were high positively related to PLS-component t2 and differentiated the 7-min smoked samples from the3-, 4-,5-, and 6-min samples, which is also consistent with the results ofHS-SPME/GC-MS that these volatile compounds were at high levels in 7-min smoked samples. The results of variable importance in projection (VIP) that is aweighted sum of squares of the PLS-DA loadings considering the amountof explainedY variation in each dimension are listed in Fig. 2B. A total ofseven key volatile compounds including (E)-2-methoxy-4-(prop-1-enyl)phenol, 3'-methylacetophenone, acetophenone, linalool, p-cresol, cis-anethol and eugenol with VIP >1 were identified by PLS-DA, whichwere significantly affected by the smoking times and played an impor-tant role in the volatile compound formation of smoked chicken drum-sticks with different smoking times. 3.5. Electronic tongue analysis The E-tongue converts electrical signals into taste signals to distin-guish the taste of the foods, and it has a small threshold of sensation andexcludes the subjectivity of sensory evaluation (Jiang,Zhang, Bhandari,& Adhikari, 2018). Fig. 3A shows the response values of bitterness,saltiness, astringency, sourness, aftertaste-B, aftertaste-A, richness andumami. With the increase in smoking times, the sourness, bitterness andastringency of the smoked chicken drumsticks increased (P <0.05), andthe saltiness, umami and aftertaste-A gradually decreased (P <0.05).The signal values of richness and aftertaste-B were not changed obvi-ously across smoking times (P > 0.05). The increase in sourness mayhave been caused by the production of large amounts of acids, and thisresult was in accordance with the results of pH and HS-SPME/GC-MS.The increase in bitterness may be due to the increase in furfural,which provides samples with a bitter almond flavour (Pons et al., 1991).This result was also in accordance with the bitterness results of sensoryevaluation and HS-SPME/GC-MS. PCA of the taste response to chicken drumsticks with differentsmoking times is presented in Fig.3B. The contribution rates of PC1 andPC2 were 62.80% and 27.00%, respectively, and the cumulativecontribution rate was 89.80%(>85%), which indicates that PC1 andPC2 reflected much information about the overall characteristics of thesamples. As shown in Fig. 3B, the control samples were close to 2-minsmoked samples but far away from the other samples smoked fordifferent times. Among samples with different smoking times, the 3-, 4-,and 5-min smoked samples were close to each other, while the 6-minand 7-min smoked samples were close to each other. The 6- and 7-minsmoked samples were differentiated by CAO and COO with positivescore values at PC2, which indicated higher sourness and bitterness inthese two samples compared to other samples. The control and 2-minsmoked samples were discriminated from other samples by AEE andCTO with negative score values at PC1, which indicated higher umamiand saltiness in these two samples compared to other samples. The 3-, 4-,and 5-min smoked samples were differentiated by AE1 with positivescore values at PC1, which indicated higher astringency in these samplescompared to other samples. 3.6. Electronic nose analysis The E-nose may be used to acquire complete information related tovolatile compounds in samples, and it is a better method for analyses offood odour (Tiggemann et al., 2017). According to the response values ofthe E-nose in Table 6, the control samples had lower response values atsensors WIW (sulphides), W2W (organic sulphides), and W5S (nitrogenoxides). After sugar smoking for different times, all of the chickendrumsticks had higher response values at sensors W1W, W2W, and W5S.The smoking time increased the response values of W1S (methyl), W1W,W2S (alcohols, aldehydes and ketones) and W2W (P <0.05), but hadlittle effect on the response values of W5S, W6S (hydrides), and W3S(long-chain alkanes) (P >0.05). The increased response values of sensors W1W and W2W with the extension of smoking times suggeststhat sulphur compounds were increased in the smoked chicken drum-sticks. Some of these sulphur compounds, such as dimethyl disulphide,provide the characteristic odour of smoked food (Huang et al., 2019).The increased response values of sensor W2S indicated that aldehydesand ketones were increased with the prolonged smoking times, whichwas consistent with the results of HS-SPME/GC-MS. PCA of the E-nose of chicken drumsticks with different smokingtimes is presented in Fig. 3C and the PCA model quality parameters arepresented in Fig. S1. The total variance in the contribution of the firsttwo principal components was 96.20% (PC1 and PC2 were 68.10% and28.10%, respectively), which indicates that PC1 and PC2 reflected muchinformation of the overall characteristics of the samples (Chen, Song, Bi,Meng, & Wu, 2018). As shown in Fig. 3C, the control samples were faraway from the samples smoked for different times. Among samples withdifferent smoking times, the 3-, 4-,5-, and 6-min smoked samples wereclose to each other, but far away from the 2-and 7-minsmoked samples.The control samples were differentiated from other smoked samples byW1S, W3S, and W6S sensors and with negative score values at PC1. The7-min smoked samples were differentiated from the 3-, 4-,5-,and 6-minsmoked samples by sensor W2S and highly and positively correlatedwith PC2. 3.7. Correlation between electronic nose and key volatile compounds The correlations between E-nose and volatile compounds with VIP>1 are shown in Fig. 4. The results showed that the responses of W1C,W3C, and W5C sensors had positive correlations with the contents oflinalool, eugenol, (E)-2-methoxy-4-(prop-1-enyl)phenol, and cis-ane-thol,which indicated that W1C, W3C, and W5C sensors were sensitive toaromatic compounds. In contrast, W1C, W3C, and W5C signals hadnegative correlation with the contents of acetophenone and 3'-methyl-acetophenone. W2S sensor had strong positive correlation with aceto-phenone and 3'-methylacetophenone, which indicated that W2S sensorwas sensitive to ketones. The correlation results indicate that E-nose hasthe ability to discriminate smoked chicken drumsticks with differentsmoking times by responding specifically to volatile compounds. 4. Conclusions The present study studied the effects of different smoking times onthe aromatic profiles and taste properties of smoked chicken drumsticks.The extension of smoking time decreased moisture content, aw, pH, andL*-value and increased the a*-value and b*-value of smoked chickendrumsticks. Of the 75 volatile compounds detected, 18 volatile com-pounds were identified as key compounds based on OVA (>1) andamong them seven key volatile compounds with VIP>1 were detected,including linalool, p-cresol, eugenol, (E)-2-methoxy-4-(prop-1-enyl)phenol,acetophenone, 3'-methylacetophenone, and cis-anethol. Theresults of PCA of E-tongue, E-nose, and key volatile compounds indi-cated that the 3-,4-, and 5-min samples had similar odour and tasteprofiles. The sensory evaluation results revealed that the 4-min smokedsamples had the highest score for overall acceptability. The correlationanalysis of E-nose and key volatile compounds with OAV>1 and VIP >1confirmed that W1C, W3C, and W5C sensors were sensitive to aromaticcompounds, and W2S sensor was sensitive to ketones. These resultsprovide guidance for controlling the formation of odour and taste ofsmoked chicken in a more reasonable manner. CRediT authorship contribution statement Lang Zhang: Data curation, Writing-original draft, Writing-Orig-inal draft preparation. Yingying Hu: Investigation, Formal analysis.Yan Wang: Data curation. Baohua Kong: Conceptualization, Writing-review & editing, Funding acquisition. Qian Chen: Conceptualization,Methodology, Visualization, Supervision. Sourness .Control W2S 十 W1S W2W W1W W5S W6S W3S W3C WIC W5C Fig. 3. Radar chart of electronic tongue (E-tongue) (A) and principal component analysis of E-tongue (B) and electronic nose (E-nose) (C) data for smoked chickendrumsticks with different smoking times. Sensor name Smoking times (min) 0 (Control) 2 3 4 5 6 7 W1C W5S W3C W6S 0.66±0.02° 5.89±0.90” 0.83±0.01” 1.43±0.04 0.73±0.01° 20.81±0.23° 0.87±0.01 1.24±0.01” 0.71±0.02ab 21.63±3.00° 0.85±0.01ab 1.27±0.03 0.69±0.01bc 21.07±1.21° 0.85±0.01ab 1.29±0.03” 0.68±0.02bc 19.51±1.76° 0.84±0.01 1.31±0.03° 0.69±0.01bc 19.41±0.36° 0.85±0.01ab 1.28±0.01” 0.67±0.01° 22.28±3.25° 0.85±0.01ab 1.31±0.03” W5C W1S W1W W2S 0.88±0.01” 18.48±1.44 8.20±2.06° 4.84±0.23 0.91±0.01 11.70±0.59 39.85±3.00” 3.81±0.11 0.89±0.01ab 13.42±1.56bc 44.38±3.78 4.41±0.39bc 0.89±0.01” 14.34±0.98bc 46.60±2.81ab 4.79±0.33ab 0.88±0.01” 14.61±1.21bc 45.64±2.24ab 4.91±0.34ab 0.89±0.01ab 14.08±0.52bc 46.96±1.26 4.93±0.14ab 0.88±0.01 15.50±0.82ab 56.75±9.57° 5.49±0.42 W2W W3S 3.31±0.48° 1.46±0.02° 16.58±0.65° 1.29±0.01” 20.04±1.55bc 1.29±0.01 21.58±1.35” 1.30±0.01” 21.72±1.46” 1.31±0.01” 22.88±0.72ab 1.29±0.01 26.41±2.89° 1.30±0.01 aMeans within the same line with different uppercase letters differ significantly (P <0.05). All data are expressed as the means ± standard error of triplemeasurements. Fig. 4. Correlation between the responses of E-nose sensors and key volatile compounds (OAV > 1, VIP>1) in smoked chicken drumsticks with different smokingtimes. The colour scale denotes the nature of the correlation with 1 indicating a positive correlation (red) and -1 indicating a negative correlation (blue). Declaration of competing interest The authors declare that they have no known competing financialinterests or personal relationships that could have appeared to influencethe work reported in this paper. Acknowledgements This study was funded by the Major Science and Technology Projectsin Heilongjiang province (2019ZX07B03) and the National KeyResearch and Development during the 13th Five-year Plan in China (2018YFD0401200). The volatile compound analysis was supported byShimadzu (China) Co.,LTD. in the Shenyang analytical centre. Appendix A. Supplementary data ( Supplementary data to this article can be found online atht tps:// do i. or g / 1 0. 1 016/ j .lwt.2020 . 110764 . ) Armenta, S., Garrigues, S., & de la Guardia, M. (2007). Determination of edible oilparameters by near infrared spectrometry. Analytica Chimica Acta, 596(2), 330-337.https://doi.org/10.1016/j.aca.2007.06.028 Baker, R. R. (2007). Sugars, carbonyls and smoke. Food and Chemical Toxicology, 45(9),1783-1786. https://doi.org/10.1016/j.fct.2007.02.025 Barbosa-Pereira, L., Rojo-Poveda, O., Ferrocino, I., Giordano, M., & Zeppa, G. (2019). ( Assessment of v olatile fingerprint by HS-SPME/GC-qMS a n d E-nose for the classification of cocoa b ean shells using c h emometrics. Foo d Research International, 1 23,6 8 4-696. ht t ps:/ / do i.o r g/ 1 0 .10 1 6/j. f o o dre s . 2 019. 0 5.04 1 ) ( Chang, H., W a ng, Y., Xia, Q. , Pa n , D. D., He, J ., Zhang, H. M., e t a l . ( 2020). ) ( Characterization of the physicochemical changes and volatile compoundfingerprinting during t he chicken s ugar-smoking process. P o ultry Science. h ttp s:// d o i . o r g / 1 0 . 1 01 6 / j. psj. 2 0 2 0 .09.059 ( i n press). ) Cheng, Y. Q., Yao, M. J., Zhu, Z. S., Dong, X. L., Ali Khan, I., Huang, J. C., et al. (2019).Content, causes and analysis of heterocyclic amines in Chinese traditional braisedchicken. Food Additives & Contaminants: Part A, 36(7), 1032-1041. https://doi.org/10.1080/19440049.2019.1615136 Chen, Q. Q., Song, J. X., Bi, J. F., Meng, X. J., & Wu, X. Y. (2018). Characterization ofvolatile profile from ten different varieties of Chinese jujubes by HS-SPME/GC-MScoupled with E-nose. Food Research International, 105, 605-615. https://doi.org/10.1016/j.foodres.2017.11.054 Chung, H. Y.I., Yung, K. S., Ma, W. C., & Kim, J. J. S. (2002). Analysis of volatilecomponents in frozen and dried scallops (Patinopecten yessoensis) by gaschromatography/mass spectrometry. Food Research International,35, 43-53. https://doi.org/10.1016/S0963-9969(01)00107-7 Dong, W. J., Hu, R., Long, Y. Z., Li, H. H., Zhang, Y. J., Zhu, K. X., et al. (2019).Comparative evaluation of the volatile profiles and taste properties of roasted coffeebeans as affected by drying method and detected by electronic nose, electronictongue, and HS-SPME-GC-MS. Food Chemistry, 272, 723-731. https://doi.org/10.1016/j.foodchem.2018.08.068 Hernandez-Orte, P., Cersosimo, M., Loscos, N., Cacho, J., Garcia-Moruno, E., &Ferreira, V. (2008). The development of varietal aroma from non-floral grapes byyeasts of different genera. Food Chemistry, 107(3), 1064-1077. https://doi.org/10.1016/j.foodchem.2007.09.032 ( Huang, X . H., Qi, L. B . , Fu, B. S ., Chen, Z. H., Zhang,Y. Y. , Du, M. , et al. (2019). Flavor f ormation i n different production steps during the processing of cold-smoked S panish mackerel. F o od C h emistry, 286, 2 4 1-2 49 . ht t ps:// do i.org/1 0. 1 01 6 / j. f o odchem . 2019. 0 1 .211 ) ( Hu, Y. Y., Chen, Q., W en, R. X . , Wang, Y., Q i n, L. G . , & K o ng, B. H. (2019). Qu a litycharacteristics a nd flavor profile of H a rbin dr y sausages ino c ulated with lacti c acid b acteria and Staphylococcus xylosus. Lebensmittel-Wissenschaft und -Technologie-F o od S cience and Technology, 114, Article 108392. h ttps: / / d o i.o r g / 1 0 . 1016/ j .lwt . 2019 . 1 08392 ) ( Jiang, H. Y., Zhang, M., Bhandari, B ., & Adhikari, B . (2018). Application of electronic t ongue for fresh foods quality evaluation: A r e view. F o od Reviews International, 3 4 , 746-769. h t t ps :// doi.o rg /10.1080 / 87559129. 2 018. 1 424 1 8 4 ) ( Joseph, A . M . ( 1987). The flavor chemistry of wood smoke. Food Reviews In t ernational, 3 (1-2), 139-183.h ttp s:// d o i .o r g/ 10.1080 / 87559128709540810 ) ( Kim, M. K., J ang, H. W ., &Lee, K. G . (2018). S e nsory and instrumental volatile flavoranalysis of commercial orange juices p repared by different processing methods. Food C hemistry, 267, 217-222. h t tp s:/ /d o i . o rg /1 0 .1016 / j .fo o d chem.2 0 17 . 10 . 129 ) ( Kong, B. H.,Xiong, Y. L., Fang, G. D., Thompson, K. R., Metts, L. S., Muzinic, L. A., et al. ( 2006). Influence of gender a n d spawning on m eat qual i ty of a u stralian red claw c rayfish ( Cherax quadricarinatus) stored at 2° C . J ou r nal of Food Science, 71(6), 320-325. h ttps : / /doi.or g /10.1 1 11 /j .1750 - 3841.200 6 .00117 . x ) ( Kosowska, M . , M a jcher, M . A., Jelen, H . H ., & Fortuna, T . (2018). Key aroma compounds i n smoked c o oked lo i n. Journal of Agricultural and Food C hemistry, 66(14), 3683-3690. h ttp s : / / doi. o r g/ 1 0 . 102 1/a c s . j af c .7b059 9 6 ) ( L edesma, E., R endueles, M ., & Diaz, M . ( 2016). C ontamination of m e at products duringsmoking by polycyclic aromatic hydrocarbons: Processes and prevention. Foo d Control,60,64-87. h t t p s: / /d oi. o rg /1 0 . 1016/j . foodco n t.2 0 15.0 7 .016 ) ( Malarut, J. , & V angnai, K. (2018). Influence o f wood types on quality and car c inogenicpolycyclic aromatic hydrocarbons ( PAHs) of smoked s a usages. Food Control, 85, for 98-106. h t tp s :// do i . or g / 10 . 1 0 16/j . food c ont . 201 7 .09 . 020 ) ( Olivares, A ., Navarro, J . L., & Flores, M. (2009). Establishment of the contribution o f volatile compounds t o t h e aroma of fermented sa u sages at di f ferent s t ages o f processing and storage. Food Chemistry, 115 ( 4), 1464-1472. http s:// d o i.o rg / 10.1016/ j . foodchem.2009 . 01.083 ) ( P aravisini, L ., Moretton, C., Gouttefangeas, C., Nigay, H. , Da c remont, C., & Guic h ard, E. ( 2017). C aramel f l avour p e rception: I m pact of the n o n-volatile compounds on s ensory p r operties and in - vitro ar o ma release. Food Rese a rch Inter n ational, 100, 209- 2 15 . h t tp s: // doi . o rg/ 10. 1 016/ j . fo o d r e s . 20 1 7.07.003 ) ( P aravisini, L. , Prot, A., Gouttefangeas, C . , Moretton, C. , Nigay, H. , Da c remont, C., et a l . ( 2015). Characterisation o f the volatile fraction of aromatic caramel using heart- ) ( cutting multidimensional gas chromatography. Food Chemistry, 1 67, 281- 2 89. h ttps: // do i. org / 1 0 . 1 0 16 /j. food c h em .2014.0 6 . 1 01 ) Perez, L. C., & Yaylayan, V. A. (2008). Isotope labeling studies on the formation of 5-(hydroxymethyl)-2-furaldehyde (HMF) from sucrose by pyrolysis-GC/MS. Journal ofAgricultural and Food Chemistry, 56(15), 6717-6723. https://doi.org/10.1021/ if8010245 Petricevica, S., Radovcicb, N. M., Lukicb, K., Listes, E., & Medicb,H. (2018).Differentiation of dry-cured hams from different processing methods bymeans ofvolatile compounds, physico-chemical and sensory analysis. Meat Science, 137,+nc./217-227. https://doi.org/10.1016/j.meatsci.2017.12.001 Pino, J. A. (2014). Characterisation of volatile compounds in a smoke flavouring fromrice husk. Food Chemistry, 153,81-86. https://doi.org/10.1016/j.foodchem.2013.12.041 Pino, J. A., Tolle, S., Gok, R., & Winterhalter, P. (2012).Characterisation of odour-activecompounds in aged rum. Food Chemistry, 132(3),1436-1441. https://doi.org/10.1016/j.foodchem.2011.11.133 Pons, I., Garrault, C., Jaubert, J.N., Morel, J., & Fenyo, J. C. (1991).Analysis of aromaticcaramel. Food Chemistry, 39(3), 311-320. https://doi.org/10.1016/0308-8146(91)90148-H Radecki, A., Grzybowski, J.,Halkiewicz, J., & Lamparczyk, H. (1977). Isolation andidentification of some components of the lower-boiling fraction of a commercialsmoke flavourings. Acta Microbiologica Polonica, 3, 203-207. Rosa, A. R. D., Leone,F., Cheli, F., & Chiofaloa, V. (2017). Fusion of electronic nose,electronic tongue and computer vision for animal source food authentication andquality assessment-a review. Journal of Food Engineering, 210, 62-75. https://doi.org/10.1016/j.jfoodeng.2017.04.024 Sabio, E., Vidal-Aragon, M. C., Bernalte, M. J., & Gata,J. L. (1998). Volatile compoundspresent in six types of dry-cured ham from south European countries. Food Chemistry,61(4), 493-503. https://doi.org/10.1016/S0308-8146(97)00079-4 Saldana, E., Castillo, L. S., Sanchez, J. C., Siche, R., de Almeida, M. A., Behrens,J. H.,et al. (2018). Descriptive analysis of bacon smoked with Brazilian woods fromreforestation: Methodological aspects, statistical analysis, and study of sensorycharacteristics. Meat Science, 140, 44-50. https://doi.org/10.1016/j.meatsci.2018.02.014 Selli, S., & Cayhan, G. G. (2009). Analysis of volatile compounds of wild gilthead seabream (Sparus aurata) by simultaneous distillation-extraction (SDE) and GC-MS.Microchemical Journal, 93(2), 232-235. https://doi.org/10.1016/j. microc.2009.07.010 Sikorski, Z. E. (2016).Smoked foods: Principles and production. Encyclopedia of Food andHealth, 1-5. https://doi.org/10.1016/B978-0-12-384947-2.00630-9 Sung, W. C. (2013). Volatile constituents detected in smoke condensates from thecombination of the smoking ingredients sucrose, black tea leaves, and bread flour.Journal of Food and Drug Analysis, 21(3), 292-300. https://doi.org/10.1016/j.ifda.2013.07.005 Tiggemann, L., Ballen, S. C., Bocalon, C. M., Graboski, A. M., Manzoli, A., Steffen, J.,et al. (2017). Electronic nose system based on polyaniline films sensor array withdifferent dopants for discrimination of artificial aromas. Innovative Food Science &Emerging Technologies, 43, 112-116. https://doi.org/10.1016/j.ifset.2017.08.003 Wen, R. X., HuY. Y., Zhang, L., Wang, Y., Chen, Q., & Kong, B. H. (2019). Effect of NaClsubstitutes on lipid and protein oxidation and flavor development of Harbin drysausage. Meat Science, 156, 33-43. https://doi.org/10.1016/j.meatsci.2019.05.011 Yang, K. M., & Chiang, P. Y. (2019). Effects of smoking process on the aromacharacteristics and sensory qualities of dried longan. Food Chemistry, 287, 133-138.https://doi.org/10.1016/j.foodchem.2019.02.017 ( Y ang, D . D . , He, Z . Y., G ao, D . M . , Q i n, F., Deng, S. L., Wang, P. , et a l . (2019). E f fects o f smoking or baking procedures during sausage processing o n the formation ofheterocyclic amines measured using UPLC-MS/MS. F o od Chemistry, 276, 195-201. h ttps :// do i. org / 1 0 . 1 0 16 /j . food c h e m.2018.09. 1 6 0 ) ( Y ao, W. S . , Cai, Y . X ., Liu, D. Y., Zhao, Z. N., Zhang, Z . H., M a, S. Y ., et al. (2020).Comparative analysis of characteristic volatile compounds in Chinese t r aditionalsmoked chicken (s p ecialty poultry product) from different regions by HS- G C-IMS. Poultry Science, 99(12), 7192-7201. h ttps: //d oi . o rg/ 1 0.101 6 /j.p s j . 2 0 20.0 9 . 0 11 ) ( Y in, X . Y., Lv, Y. C., Wen, R . X ., Wang, Y . , Chen, Q . ,& K ong, B. H. ( 2020).Characterization of s e lected Harbin red sausages on t he basis of their flavour profilesusing HS-SPME-GC/MS combined wit h ele c tronic nose and electronic tongue. Meat S cience, 172, Article 108345. http s:/ / doi. o r g/ 1 0 . 10 1 6/ j . me ats ci . 2020. 1 083 4 5 ) ( Y u, H. Y., Xie, T., Xie, J. R., Ai, L. Z., & Tian, H. X. (2019). C haracterization of key aromacompounds in C h inese r i ce wine using gas chromatography-mass sp e ctrometry and g as c hromatography-olfactometry. Food Chemistry, 293, 8-14. http s ://do i.o rg / 1 0 . 1016 / j . f oodch e m . 20 1 9.03.07 1 ) ( Z hang, L., D u, H . Z ., Zhang, P ., Kong, B . H., & Liu, Q. (2020). Heterocycl i c aromaticamine c o ncentrations and quality characteristics of traditional smoked and roastedpoultry products o n the northern Chinese market. Food and Chemical Toxicology, 1 35, Article 110931. ht t p s :// d o i . org / 1 0 . 10 1 6 / j .f ct . 2 019 . 1 1 0931 ) 摘要:本研究采用电子鼻、电子舌和顶空固相微萃取-气相色谱-质谱(HS-SPME/GC-MS)分析了不同糖熏时间对鸡腿风味的影响。含水量、水活度、pH、L*-值分别从71.26%下降到65.23%、0.987下降到0.979、6.66下降到5.36、61.84下降到52.34 (P <0.05).a*值从4.96增加到9.65,b*值从16.61增加到26.45 (P<0.05),随着吸烟次数的增加。共鉴定出75种挥发性化合物,其中18种挥发性化合物为关键气味化合物,其中7种挥发性化合物在预测(VIP)>1被检测到。电子鼻、电子舌和HS-SPME/GC-MS的主成分分析表明,3-、4-和5分钟烟样品具有相似的气味和味觉特征。感官分析表明,4min样品总体接受度提高。电子鼻和主要挥发性化合物与气味活性值>1,VIP > 1,证实W1C、W3C和W5C传感器对芳香化合物敏感,W2S传感器对酮类敏感。研究结果可为烟熏鸡生产者合理控制风味形成提供指导。单位:东北农业大学
关闭-
1/12
-
2/12
还剩10页未读,是否继续阅读?
继续免费阅读全文产品配置单
北京盈盛恒泰科技有限责任公司为您提供《鸡腿中风味检测方案(感官智能分析)》,该方案主要用于畜禽肉及副产品中理化分析检测,参考标准《暂无》,《鸡腿中风味检测方案(感官智能分析)》用到的仪器有日本INSENT味觉分析系统(电子舌)、电子舌。
我要纠错
推荐专场
感官智能分析系统(电子鼻/电子舌)
更多
相关方案
 咨询
咨询