方案详情文
智能文字提取功能测试中
长期添加蚕蛹油对羊甲烷产量、瘤胃原生动物和古生菌群落的影响Effect of Long-Term Supplementation With Silkworm Pupae Oil on the Methane Yield, Ruminal Protozoa, and Archaea Community in Sheep.frontiersin MicrobiologyORIGINALRESEARCHpublished: 08 March 2022doi: 10.3389/fmicb.2022.780073Check forupdates长期添加蚕蛹油对羊甲烷产量、瘤胃原生动物和古生菌群落的影响 Thirumalaisamy et al.Oil Supplementation and Methane Emission OPEN ACCESS Edited by: Robert W.Li, Agricultural Research Service (USDA),United States Reviewed by: Takehiro Nishida, Obihiro University of Agriculture and Veterinary Medicine, Japan Paul E. Smith.Teagasc Grange Animaland Bioscience Research Department(ABRD), IrelandYutaka Uyeno, Shinshu University, Japan *Correspondence:Pradeep Kumar Malikmalikndri@gmail.comorcid.org/0000-0002-6581-4772 Specialty section:This article was submitted toSystems Microbiologya section of the journalFrontiers in Microbiology Received: 20 September 2021Accepted: 27 January 2022Published: 08 March 2022 Citation:Thirumalaisamy G, Malik PK,Trivedi S. Kolte AP and Bhatta R(2022) Effect of Long-TermSupplementation With SilkwormPupae Oil on the Methane Yield,Ruminal Protozoa, and ArchaeaCommunity in Sheep.Front. Microbiol. 13:780073. doi: 10.3389/fmicb.2022.780073 Effect of Long-TermSupplementation With SilkwormPupae Oil on the Methane Yield,Ruminal Protozoa, and ArchaeaCommunity in Sheep Govindasamy Thirumalaisamy12, Pradeep Kumar Malik1*, Shraddha Trivedi1,Atul Purushottam Kolte1 and Raghavendra Bhatta1 1ICAR-National Institute of Animal Nutrition and Physiology, Bengaluru, India, 2ICAR-National Dairy Research Institute,Karnal, India Supplementation with lipids and oils is one of the most efficient strategies forreducing enteric methane emission. However, high costs and adverse impacts on fiberdegradation restrict the use of conventional oils. Silkworm pupae, a non-conventionaloil source rarely used for human consumption in India, could be one of the cheaperalternatives for methane mitigation. The objective of this study was to investigate theeffect on sheep of long-term supplementation (180 days) of silkworm pupae oil (SWPO)with two distinct supplementation regimes (daily and biweekly) on daily enteric methaneemission, methane yield, nutrient digestibility, rumen fermentation, ruminal archaeacommunity composition, and protozoal population. The effect of the discontinuationof oil supplementation on enteric methane emission was also investigated. Eighteenadult male sheep, randomly divided into three groups (n =6), were provisioned witha mixed diet consisting of 10.1% crude protein (CP) and 11.7 MJ/kg metabolizableenergy formulated using finger millet straw and concentrate in a 55:45 ratio. SWPOwas supplemented at 2% of dry matter intake (DMI) in test groups either daily (CON) orbiweekly (INT), while no oil was supplemented in the control group (CTR). DMI (p=0.15)and CP (p =0.16) in the CON and INT groups were similar to that of the CTR group;however, the energy intake (MJ/kg) in the supplemented groups (CON and INT) washigher (p<0.001) than in CTR. In the CON group, body weight gain (kg, p=0.02)and average daily gain (g, p= 0.02) were both higher than in the CTR. The dailymethane emission in the CON (17.5 g/day) and INT (18.0 g/day) groups was lower(p=0.01) than the CTR group (23.6 g/day), indicating a reduction of 23-25% dueto SWPO supplementation. Similarly, compared with the CTR group, methane yields(g/kg DMI) in test groups were also significantly lower (p<0.01). The transient natureof the anti-methanogenic effect of SWPO was demonstrated in the oil discontinuationstudy, where daily methane emission reverted to pre-supplementation levels after a shortperiod. The recorded methanogens were affiliated to the families Methanobacteriaceae,Methanomassilliicoccaceae, and Methanosarcinaceae. The long-term supplementation of oil did not induce any significant change in the rumen archaeal community,whereas minor species such as Group3b exhibited differing abundance among thegroups. Methanobrevibacter, irrespective of treatment, was the largest genus, whileMethanobrevibacter gottschalkii was the dominant species. Oil supplementation in CONand INT compared with CTR decreased (p <0.01) the numbers of total protozoa(×10'cells/ml), Entodiniomorphs (× 107 cells/ml), and Holotrichs (x 106 cells/ml). SWPOcontinuous supplementation (CON group) resulted in the largest reduction in entericmethane emission and relatively higher body weight gain (p=0.02) in sheep. Keywords: archaea, long-term feeding, methane yield, sheep, silkworm pupae oil INTRODUCTION The global livestock sector accounts for 14.5% of anthropogenicgreenhouse gas emissions (Gerber etLal., 2013). Entericfermentation alone is accountable for 87-97 Tg of methaneproduced on an annual basis (Chang et al., 2019). Apartfrom contributing to global warming, the enteric methaneemissions from livestock are also responsible for 2-12% ofdietary energy loss (Johnson and Johnson, 1995), where everyliter of methane carries 39.5 kJ of energy from the host animal(Guan et al., 2006). The rumen is an ideal habitat for protozoa, where theylive in close association with prokaryotic microbes (Newboldet al., 2015). After bacteria, protozoa are the second mostabundant microbes, constituting up to 50% of the rumen biomass(Newbold et al., 2015) with the overall dominance of ciliatedprotozoa (Morgavi et al., 2010). Rumen protozoa are not essentialfor animal survival, yet they perform important functionssuch as protein breakdown, bacterial predation (Williams andColeman, 1992), reduction of the shedding of potential pathogens(Newbold et al., 2015), lipid metabolism, and shifts in volatilefatty acids production (Eugène et al., 2004). However, theirpresence in the rumen negatively impacts the energy efficiencyof the rumen ecosystem (Newbold et al., 2015). One of themajor functions of rumen protozoa is to transfer hydrogen toother microbes, particularly to the methanogens (Li et al., 2018).Methanogens belong to the phylum Euryarchaeota (Balch et al.,1979), constituting 3-4% of the rumen microbiota (Yanagita et al.,2000). Rumen protozoa associated methanogens are responsiblefor 37% of enteric methane emissions (Machmiller et al., 2003).It has been reported that the counts of rumen protozoa arelinearly related to methane emissions; however, methanogenesisis also regulated by other mechanisms independent of protozoa(Guyader et al., 2014). Oil supplementation is a promising method for increasingdiet density. In addition, supplementation with lipids effectivelyreduces enteric methane production (Morgavi et al, 2010).Oil supplementation is considered a promising approach forenteric methane mitigation in ruminants through a shift inrumen fermentation or microbiota composition (Vargas et al.,2020). Commonly used edible oils such as linseed, rapeseed,palm, and canola are expensive (Government of India, 2021).S1(SVilkworm pupae oil (SWPO) is non-conventional, inexpensive,and adequately available in India (Srinivas et al., 2019). The oil contains reasonably good combinations of both unsaturatedandsaturatedfatty acids(Thirumalaisamy et al., 2020).Polyunsaturated fatty acids reduce the abundance of protozoaand, therefore, can be one of the potential mitigation options forreducing enteric methane emissions (Guyader et al., 2017). Recently, the supplementation of SWPO in a short-termstudy decreased the enteric methane emission of sheep(Thirumalaisamy et al., 2020). Recently, Jayanegara et al. (2020)evaluated oils from five different insect sources for theirimpact on in vitro methane and concluded that mealworm andcricket oil supplementation at 5% effectively decreased methaneproduction by 26-33%. Due to adaptability of the rumen ecosystem, the methaneinhibition is usually short-lived (Mathison et al., 1998), andanimals return to normal methane emissions after withdrawalof ameliorating supplement from the diet (Hristov et al.,2013). Although this is a known issue, nevertheless, very fewstudies were undertaken to evaluate the impact of long-termsupplementation on methane emission. Therefore, studies areneeded to establish the persistency of methane mitigation inthe long term (Beauchemin et al., 2020). Previous research(Thirumalaisamy et al., 2020) has shown that the short-termsupplementation of SWPO significantly reduces enteric methaneemission, which encouraged us to evaluate the effect over thelong term. We hypothesized that long-term supplementationof SWPO may decrease methane emissions and methane yieldby altering the archaeal community composition and reducingruminal protozoa. Therefore, the current study was designedto investigate (1) the effects of long-term supplementation ofSWPO in two distinct supplementation regimes (daily andbiweekly) on daily enteric methane emission, methane yield (g/kgdry matter intake), nutrient digestibility, rumen fermentation,ruminal archaea diversity, and protozoal numbers in sheep,and (2) whether discontinuation of oil supplementation affectsmethane emission. MATERIALS AND METHODS Animals and Feeding The animal study was approved by the Committee for Controland Supervision of Experiments on Animals (CPCSEA), Ministryof Fisheries, Animal Husbandry, and Dairying, Governmentof India (approval no. 25/14/2017-CPCSEA). All procedures were carried out as per the guidelines of the Institute AnimalEthics Committee. A 180-day-long animal study was carried out in (n =18)18-month-old male Mandya sheep (BW 24.1 ±0.27 kg),randomly divided into three groups of six. The animals werehoused in a well-ventilated shed constructed with half cementedwalls and half iron mesh. The iron mesh was fixed into thecemented walls at 1.8 m above the ground on the east andwest sides. The sheep were housed in individual pens havingfree access to clean drinking water and feed throughout theday. Initially, all the animals were dewormed with anthelminthicfenbendazole at 5 mg/kg BW. The animals were offered a totalmixed ration (TMR) formulated with 55% finger millet straw(Eleusine coracana) and 45% concentrate mixture. The TMR wasformulated to meet nutrient requirement as per ICAR (2013)feeding standards. The concentrate mixture was prepared usingmaize grain (320 g/kg), wheat bran (400 g/kg), soybean meal(130 g/kg), groundnut cake (120 g/kg), mineral mixture (20g/kg),and salt (10 g/kg). The TMR offered to the animals in differentgroups was similar in all nutritional aspects and contained 10.1%crude protein (CP) and 11.7 MJ/kg metabolizable energy (ME).The TMR was offered ad libitum twice a day at 09:00 and 14:00,and clean drinking water was accessible throughout the day. The oil extracted from dried silkworm pupae using the solventextraction method (n-hexane) was purchased from a local vendorin the suburb of Bangalore and stored in an airtight container.The SWPO was filled in a plastic container (2 L; NJ Phillips,Australia) connected to an automatic oral drenching gun (NJPhillips, part no SH46) for administering the required volume.The oil was supplemented at 2% of dry matter intake eitherdaily (CON) or biweekly (INT), whereas animals in the controlgroup (CTR) were offered TMR without oil. Thus, the animalsin the INT group received oil daily for 1 week and then this wasdiscontinued for the subsequent week. Dry matter intake (DMI, g/day) was recorded at monthlyinterval for three consecutive days throughout the experiment toadjust SWPO volume (w/v) in the CON and INT groups. Chemical Analysis The chemical composition of the feed ingredients, TMR, refusals,and feces were analyzed in triplicate. The dry matter content inthe samples was determined as per AOAC (2012) in a hot airoven at 100°C for 12 h, and dried samples were ground usinga Cyclotec mill. For determining total ash, the samples wereinitially burnt in crucibles on a hot plate and later transferred toa muffle furnace at 550°C for 4 h (AOAC, 2012). Organic matter(OM) was determined by subtracting the total ash from the initialdry weight of the sample and expressed as a percentageC..Crudeprotein (CP, N × 6.25) was determined as per AOAC (2005)using an automatic nitrogen analyzer (Gerhardt, Germany). Thecrude fiber (CF) and fiber fractions such as neutral detergent fiber(NDF) and acid detergent fiber (ADF) were determined using anautomatic fiber analyzer (Fibretherm FT12, Gerhardt, Germany)in accordance with AOAC (2005) and Van Soest et al. (1991).The ether extract (EE) was estimated using Soxtherm (Gerhardt,Germany) as per the standard method (AOAC, 2005). The grossenergy content (kcal/100g DM) ofTMR and feed ingredients was calculated following the equation of Crisan and Sands (1978), andexpressed as metabolizable energy (MJ/kg DM) after consideringdigestible and urinary losses. The chemical composition (g/kgDM) is presented in Table 1 Ammonia-N concentration in the ruminal fluid samples wasdetermined as per Conway (1957) following the microdiffusiontechnique. The microdiffusion cell has two chambers-1 mlof the mixed boric acid (2%) indicator (methyl red 66 mg,methylene blue 33 mg in 100 ml alcohol) was pipetted intothe inner chamber while an equal volume of saturated sodiumcarbonate was placed in the outer chamber of the disc. A measureof 1 ml of strained ruminal fluid was pipetted into the outerchamber directly opposite to the sodium carbonate, and thenthe microdiffusion cell was immediately covered with the lid.To allow the mixing of the contents of the outer chamber,the disc was gently rotated and incubated for 2 h at roomtemperature. After the incubation, the contents of the innerchamber were titrated against 0.01 N sulfuric acid until the colorturned pink. Ammonia-N was determined using the followingformula: Volatile fatty acids (VFA) concentration in the ruminal fluidsamples was determined according to Filipek and Dvooak(2009) using a gas chromatograph (Agilent 7890B, Santa Clara,United States). In brief, preserved metaphosphoric acid mixedsupernatant samples were thawed at room temperature, andafter a short spinning at 13,000 rpm for 5 min, about 1.5 mlof the sample was transferred to GC screw vials (2 ml; AgilentTechnologies). The screw vials containing fluid samples andthe VFA standard and washing solvent were placed in theautomatic injector port (G4513A). The injector dispensed afixed volume (1 pl) of the sample while maintaining the 20:1splitting ratio. The injector was equipped with a glass linercontaining glass wool to separate dirt particles from the sample.Nitrogen gas (N2) at a flow rate of 2 ml per min was used asa carrier gas. The gas chromatograph was equipped with theFFAP column (CP7485, 25 m × 0.32 mm × 0.30 um; AgilentTechnologies) and flame ionization detector (FID). The followingconditions were maintained during the analysis: temperatureprogram, 59-250°C (20°C/min, 10 min); injector temperature,230°C; detector temperature, 280°C. The analysis time wasapproximately 16.7 min. The concentration of individualvolatile fatty acids was determined using the following formula: VFA con.(mmol)= Peak area of sample x Conc. of standard x dilutionPeak area of standard Total metabolic hydrogen produced was calculated using theconcentration of volatile fatty acids as per the equation of Martyand Demeyer (1973) and hydrogen utilized (%) in methane wascalculated based on daily enteric methane emission. TABLE 1|Chemical composition (g/kg DM) of feed ingredients and TMR. Finger millet straw Concentrate Maize Soybean meal Groundnut cake Wheat bran TMR OM 910 942 982 914 942 982 928 CP 36.5 193 91.5 447 424 141 101 EE 10.3 32.2 47.4 101 57.9 47.4 20.1 NDF 670 460 514 498 354 514 618 ADF 508 131 93.1 262 224 93.1 357 CF 330 43.9 26.8 94.1 106 268 255 TA 89.7 58.0 18.3 85.8 57.7 18.3 71.7 NFE 429 579 711 266 262 711 452 ME*(MJ/kg) 11.6 11.6 12.8 9.50 10.7 12.8 11.7 OM, organic matter; CP, crude protein (N2×6.25); EE, ether extract; NDF, neutral detergent fiber; ADF, acid detergent fiber; CF, crude fiber; TA, total ash; TMR, totalmixed ration. Nitrogen-free extract (NFE) was calculated by subtracting the %CP+%EE+%CF+%TA+%moisture from 100. ME is the metabolizable energy, calculatedfrom the gross energy of feed by multiplying by 0.82. *The energy value of TMR plus oil was 12.24 MJ. Body Weight, Nutrient Digestibility, andMethane Measurement During the entire experimental1period (180 days), beforemorning feeding the animals were weighed at monthly intervalson a digital balance (Blue Bird, 300 kg). Their total weight gain(kg) was calculated as the difference between final and initial live-weight, and average daily gain (ADG, g/day) was calculated bydividing total weight gainn Dby the number of experimental days. A digestibility trial was conducted for 10 days between days171 and 180, and apparent nutrient digestibility was determined.In brief, the quantity of daily TMR offered, feed refusals, andfeces were recorded and the representative samples were collectedfrom the individual animal. The DMI (g/day) of the individualanimal was calculated by subtracting the quantity of dry refusalsfrom the feed offered. The energy intake was calculated byconsidering daily DMI (g/day) and energy content of TMR(ME, MJ/kg DM), as described under chemical analysis. Thedigestibility coefficient of various nutrients was determined byusing the following equation: The sulfur hexafluoride (SF6) tracer technique (Berndt et al.,2014) was employed for the quantification of daily entericmethane emission for 10 consecutive days (days 171-180).During methane measurements, animals in the INT groupreceived SWPO from days 171 to 175, whereas the remaining 5days (176-180) were under the supplementation break. The brasspermeation tubes (8.5 mm diameter, 34 mm long, 4.8 mm widebore, and 30 mm deep with blind hole) fitted with a Swageloknut (7 mm diameter) were used as a source of SF6. A Teflonseptum (0.24 mm PTFE) was placed below the SS frit (3/8"OD,2 um pore size), and the tubes were closed. The permeationtubes were charged with 750 ± 48.18 mg SF6 (99.9%) in liquidnitrogen and retained in an incubator at 39°C for 70 days. Thetubes were monitored and weighed weekly on a balance (Denver,Germany; 210 g accuracy ± 0.1 mg) and calibrated for releaseover 8 weeks. The release rate was calculated by linear regression considering the difference in tube weights during the calibrationperiod. The calibrated tubes were placed in the rumen 10 daysbefore the commencement of daily methane measurements. Themean SF6 release rate from the permeation tubes in this studywas 3.47 ± 0.46 mg/day. The PVC canister for the backgroundsample was connected to the nylon and capillary tubes (Supelco,Cat#56712-U, ID 1/16) and Quick connectors (Swagelok, Cat#B-QC4-D-200) assembled by following the standard guidelines(Williams et al., 2014). The canister for the daily backgroundsample was hung on the iron wire mesh fixed in the cementedwall on the east side. The vacuumized PVC canisters (> 95kPa)were tied individually to collect breath samples for 24 h. Similartimings were maintained for tying and removal of the canistersthroughout the measurement period. The post-collection canisterpressure was measured by a digital pressure meter (Leo 2, Keller,Switzerland). Thereafter, the breath and background samples inthe canister were diluted (2.15-3.0-fold) with high-purity N2 gas,and pressure was measured to calculate the dilution factor. The successive subsamples were collected in a gas airtightglass syringe (Hamilton, 1 ml) for analyzing the methaneand SF6 concentrations using a gas chromatograph (GC 2010plus; Shimadzu, Japan). The GC was fitted with a FIDand electron capture detector for the analysis of methaneand SF6 concentrations, respectively. In brief, the followingchromatographic conditions were maintained for the SF6analysis: inlet temperature of 100°C, column temperature of40°C, detector temperature of 250°C, airflow rate of 400 ml/min,hydrogen flow rate 40 ml/min, and nitrogen flow rate of30 ml/min. In contrast, the following conditions were appliedfor the methane analysis: inlet temperature of 100C, columntemperature of 60C, detector temperature of 150°C, airflowrate of 400 ml/min, hydrogen flow rate of 40 ml/min, andnitrogen flow rate of 30 ml/min. Methane (ppm) and SF6(ppt) concentrations were calculated using the canister pressuresat different time points (Lassey et al., 2014) with a slightmodification for local elevation and atmospheric pressure: Gs represented the concentration of methane (ppm) or SF6 (ppt)at an atmospheric pressure of 90 kPa and elevation of 920 m.tf (kPa) was the final vacuum in the canister after N2 dilution,ts (kPa) is the post-sampling vacuum in the canister, te is thevacuum in the evacuated canister, and GA is the concentration ofmethane (ppm) or SF6 (ppt) in the samples presented to the GC. Daily enteric methane emissions were calculated using the equation of Moate et al. (2014). RcH4 is the CH4 emission (g/day), RsF6 is the SF6 release ratefrom the tubes (mg/day), [CH4]M-[CH4]BG is the methaneconcentration (ppm) in the sample and background, [SF6]M-[SF6]BG is the methane concentration (ppm) in the sample andbackground, and MWcH4 and MWsF6 represent the molecularmass of CH4 and SF6, respectively. The DMI (g/day) along with daily methane emission (g/day)recorded over 10 days during methane measurement trials wereused for the calculation of methane yield (MY, g/kg DMI).Daily methane emission (g/day) was divided by the meanDMI (g/day) over the measurement period. After 180 days, oilsupplementation for the CON and INT groups was discontinued,and all the animals received a similar basal diet without SWPO.After 30 days of oil withdrawal, daily enteric methane emissionwas again quantified for 10 days along with the recording of DMI(g/day). The enteric methane emission was measured followingthe method described previously in this section. Ruminal Fluid Collection The day that the methane measurements ended (day 180),rumen fluid samples were collected 3 h post-feeding from eachsheep using a nylon stomach tube (length 1 m). The stomachtube and handheld vacuum pump (Mityvac 8,000; LincolnIndustrial, St. Louis, United States) were connected to a samplecollection vessel. The first 30 ml of rumen fluid was discardedto avoid saliva contamination and then 45 ml of rumen fluidwas collected and strained through a muslin cloth. The tubescontaining strained ruminal fluid samples for DNA isolation andfermentation parameters (two sets of 15 ml each) were placedon ice for immediate transportation to the laboratory. Anotherset of tubes containing 15 ml of strained fluid were transportedto the laboratory without placement in an icebox for protozoalenumeration. The first subset was centrifuged at 13,600×gfor 15 min, and after adding 2-3 drops of saturated HgCl2and metaphosphoric acid (25%) in 1:4 (v/v), the supernatantwas preserved for ammonia-N and VFA estimation, respectively.The second subset of strained fluid was used for protozoalenumeration on the same day, whereas the third subset ofruminal fluid was centrifuged at low speed (1,000 rpm, 5 min)and the supernatant was preserved at -80°C until used in theprocess of DNA isolation. Protozoal Enumeration The protozoa in the rumen fluid were enumerated as per themethod of Kamra and Agarwal (2003) using a Neubauer counting chamber. In brief, a 5-ml sample was pipetted into a screw captube containing an equal volume of 37% formaldehyde. Twodrops of methyl green (70 pl) and glacial acetic acid (2 ml)diluted to 100 ml with distilled water were added to it andstored overnight at room temperature. The ruminal protozoawere enumerated in 30 microscopic fields. Ruminal protozoaenumeration and morphological identification were carried outunder a phase-contrast microscope (Nikon Eclipse, Japan) at ×10objective. The ruminal protozoa based on the morphologyand cilia distribution were categorized as Entodiniomorphs andHolotrichs (Hungate, 1966). The protozoal numbers in the rumenfluid were calculated using the following formula: where N is the number of protozoa (cells) in 1 ml of rumen fluid,n is the average cell count per microscopic field, A is the area ofthe slide on which the diluted rumen fluid sample spread, D isthe dilution of rumen fluid, a is the area of the microscopic field,and v is the volume of rumen fluid in the cavity. The protozoalnumbers were expressed as x 10' or x 10cells/ml. Following the methaneImeasurements in the oildiscontinuation study, the rumen protozoa in each groupwere enumerated as per the method described previously. DNA Isolation The samples were initially centrifuged at 13,400 × g and 4°Cfor 10 min, and the pellet was retained by discarding thesupernatant. Thereafter, 1 ml of lysis buffer as described by Yuand Morrison (2004) was added to dissolve the pellet by gentlepipetting. The contents were transferred to a 2-ml sterile screwcap tube with an O-ring (BioSpec, United States) and contained0.5 g (0.1 mm diameter) pre-sterilized zirconia beads (BioSpec,United States). The RBB+C method of Yu and Morrison (2004)was employed for genomic DNA isolation. Genomic DNA qualitywas checked using 0.8% agarose gel electrophoresis, while theDNA concentration was ascertained with Qubit 4.0 (ThermoFisher Scientific, Waltham, United States). Library Preparation and Sequencing Amplicon libraries were prepared using a Nextra XT kit(Illumina Inc., San Diego, United States). The archaea-specificprimer sequences Arch-344F (Wemheuer et al., 2012) and Arch-806R (Takai and Horikoshi, 2000) were synthesized along withIllumina recommended adapters and error-correcting barcodesunique to each sample. The PCR amplification was performedas follows: initial denaturation at 95°C for 3 min followed by25 cycles of denaturation at 95°C for 30 s, annealing at 55℃for 30 s, extension at 72°C for 30 s, and final extension at 72°Cfor 5 min. A reaction without template was used as a negativecontrol, whereas the Methanobrevibacter smithii DNA templatewas used as a positive control during the PCR amplification.All 18 amplicon libraries were purified with AMPureXP beads(Beckman Coulter Life Sciences, United States) and analyzedindividually on a 4,200 Tape Station (Agilent Technologies,United States). The libraries were multiplexed (10-20 pM of each) and sequenced on an Illumina MiSeq platform (Illumina,San Diego, CA, United States) using MiSeq reagent kit v3,and 2 × 300 bp paired-end reads were generated to obtainapproximately 0.1 million sequences per library. Statistical Analysis All the data were checked for a normal (Gaussian) distributionin GraphPad Prism version 9 (GraphPad Software, San Diego,United States) using the D'Agostino-Pearson normality testat the 0.05 alpha level. The data pertaining to daily methaneemissions, nutrient digestibility, fermentation, and rumenprotozoawere analyzed in SPSS version 21.0 (IBM SPSS,United States) using ANOVA with the following model. Yijrepresents individual1observation、 represents thepopulation mean, A: represents the treatment effect, and eijrepresents experimental error. The difference among meanswas compared using Tukey’s post hoc method and consideredsignificant at p ≤0.05. The impact of SWPO withdrawal andprevious methane emissions were compared with paired t-testsin GraphPad Prism version 9. The correlation matrix betweenmultiple variables was performed in GraphPad Prism version9, and Pearson correlation coefficients (r) considering Gaussiandistributions were calculated at the 95% CI. Bioinformatics Analysis The amplicon sequences were processed using DADA2 v1.16(Callahan et al., 2016) in R v4.0.2. The sequencing quality wasassessed using the functions plotQualityProfile, dereplication,denoising, and merging. Chimeras were removed from thefiltered reads using the function removeBimeraDenovo. Fastafiles compatible with DADA2 for taxonomy assignments weregenerated using Rumen and Intestinal Methanogen-DB (Seedorfet al., 2014). Furthermore, the archaea-specific database RIM-DB was used for taxonomy classification, and the annotatedtaxonomy table from DADA2 was imported into phyloseq(McMurdie and Holmes, 2013) in R. The ASVs (ampliconsequence variants) with low abundance were pruned and rarefiedto the lowest numbers (31,044 sequences) to examine thearchaeal diversity measures. The rarefaction curve was plottedusing the vegan package V2.0-7 (Oksanen et al, 2013), andthe Shannon index and post hoc comparisons were performedusing Wilcoxon rank sum tests. The multivariate homogeneityof group dispersion was tested using the betadisper functionof the vegan package. The ASV count data were scaled to per10,000 sequences, taxonomically annotated at various ranks,and then the relative abundance plots were generated usingggplot2 (Wickham, 2011). Differential abundance was calculatedusing DESeq2 and significance analysis was performed using theWald parametric test with Benjamini-Hochberg correction (Loveet al., 2014). The diet effect on the diversity of methanogens atdifferent taxonomic ranks was studied across groups and testedfor significance using PERMANOVA with 999 permutations. Thecore microbiome analysis was performed in microbiome Ⅴ1.4.1 (Lahti and Shetty, 2012) in R by keeping a minimum prevalenceand detection threshold of 50% and 0.01, respectively. RESULTS Intake, Digestibility, and Average DailyGain The mean DMI in the CTR (884 g/day), CON (900 g/day),and INT (893 g/day) groups was similar (p=0.15), and therewas no adverse impact of the long-term (180 days) SWPOsupplementation on the DMI in the sheep (Table 2). The meanDMI during withdrawal period in CTR (967 g/day), CON(1,014 g/day), and INT (988 g/day) groups was also similar(p =0.176). The intake (g/day) of OM, CP, NDF, and ADF inthe CON and INT groups did not differ from the CTR group.However, the intake of EE in the CON (36.2 g/day) and INT(36.0 g/day) groups was significantly higher (p <0.01) than in theCTR group (18.0 g/day). Similarly, the ME intake in CON (11.0MJ/day) and INT (10.7 MJ/day) groups was also significantlyhigher (p <0.01) than in the CTR group (10.3 MJ/day). Theapparent digestibility (%) of all the nutrients except EE in theCON and INT groups was comparable with the CTR group. TABLE 2 | Effect of silkworm pupae oil supplementation on intake andnutrient digestibility. Attributes CTR CON INT SEMM P-value Initial BW (kg) 24.1 24.1 24.1 0.273 0.996 Final BW (kg) 29.9 33.0 30.8ab 0.492 0.022 BW gain (kg) 5.87 8.88 6.63 0.552 0.058 ADG (g/day) 32.7a49.3 36.gab 3.07 0.024 Intake (g/day) DM 884 900 893 3.42 0.155 OM 818 832 826 3.11 0.151 CP 96.1 96.7 96.5 0.13 0.157 NDF 507 518 513 2.29 0.152 ADF 295 304 300 1.74 0.153 EE 18.036.2b36.0 0.83 <0.0001 Energy*(MJ/day) 10.3a 11.0°10.7b 0.055 <0.0001 Apparent digestibility(%) DM 68.8 67.2 67.9 0.29 0.093 OM 69.7 68.4 68.7 0.28 0.127 CP 67.6 65.9 65.6 0.42 0.109 NDF 63.1 61.7 62.8 0.34 0.210 ADF 48.3 48.0 48.7 0.48 0.842 EE 78.687.688.0° 0.46 <0.0001 Methane emission Daily methane (g/day) 23.6917.58 18.0ab 0.918 0.008 Methane yield (g/kg DMI) 26.7°19.320.3ab 0.101 0.004 Methane (g/day) during withdrawal period# 23.3 322.8 24.4 2.06 0.208 CTR, control; CON, daily oil supplementation; INT, biweekly oil supplementation;DM, dry matter; OM, organic matter; CP, crude protein (N2×6.25); NDF, neutraldetergent fiber; ADF, acid detergent fiber; EE, ether extract. Mean values bearingdifferent superscripts in a row differ significantly (p<0.05). *Estimated using drymatter intake (g/day) and feed energy (ME MJ/kg). #Measurement after 30 days ofthe withdrawal of oil supplementation. Long-term feeding of SWPO led to a higher (p=0.02) bodyweight in the CON group (33.0 kg) compared with the CTRgroup (29.9 kg). However, the difference in body weight betweenCTR and INT as well as CON and INT after 180 days of SWPOfeeding was similar. A significant difference (p=0.02) in theADG between CON (49.3 g/day) and CTR (32.7 g/day) wasrecorded in this study. On the other hand, the difference in ADG(g/day) in sheep between the CTR-INT and CON-INT groupswas non-significant. In the present study, a positive correlation(r=0.53) between the ME intake (MJ/day) and ADG (g/day) wasrecorded. During the entire experimental period of 180 days, theanimals consumed 3.24 and 1.61 L of SWPO in the CON and INTgroups, respectively. The corresponding cost of the daily SWPOin the CON and INT groups was INR 0.72 and 0.36, respectively(1 US$= 75 INR). Methane Emissions Daily enteric methane emissions in the CON (17.5 g/day) andINT (18.0 g/day) groups were significantly lower (p<0.01) thanin the CTR group (23.6 g/day). Data on daily methane emissions(g/day) revealed a reduction of about 23-25% in the CON andINT groups due to the daily or biweekly supplementation ofSWPO (Table 2). However, the daily enteric methane emission(g/day) between the CON and INT groups did not differsignificantly (p=0.008). Similarly, the difference in daily entericmethane emission (g/day) between the supplementation andnon-supplementation days in the INT group was not significant(p=0.77). A uniform comparison of methane emission (MY)among the groups also revealed a significant reduction (p<0.01)in the MY in CON (19.3 g/kg DMI) and INT (20.3 g/kg DMI)groups compared with that of the CTR group (26.7 g/kg DMI);however, the MY (g/kg DMI) between the CON and INT groupswas non-significant. There was a weak negative correlation (r=-0.05; p = 0.80) between the MY and DMI (Figure 1). MYwas positively correlated with protozoa numbers (r=0.36) andacetate(r=0.25). The enteric methane emissions (g/day) amongthe sheep of different groups were similar (p=0.208) during thewithdrawal period (Table 2). Ammonia, Volatile Fatty Acids, andMetabolic Hydrogen The ruminal ammonia concentration in the CON and INTgroups compared with the CTR group (19.7 mg/100 ml)was significantly lower (p <0.01). Similarly, the ammoniaconcentration was also different (p<0.01) between the CONand INT groups. On the other hand, total volatile fatty acid(TVFA) production was similar (p =0.99). Despite the similarTVFA concentration, the propionate production with referenceto CTR (11.3 mmol) was higher (p <0.01) in the SWPOsupplemented CON (13.0 mmol) and INT (12.3 mmol) groups(Table 3). However, variation in the concentration of other VFAbetween the groups was non-significant. The A/P ratio in theCON and INT groups was significantly lower (p<0.01) than thatin the CTR group. In the CTR, CON, and INT groups of the present study, theproduction of metabolic hydrogen was 130, 128.5, and 128.6 FIGURE 1|Correlation matrix (Pearson) between MY, ruminal protozoa, DMI,and individual volatile fatty acids. The scalar colors symbolize the positivity(closer to 1, blue squares) or negativity (closer to -1, red squares) of thecorrelation. MY is the methane yield, and DMI is dry matter intake in thecorrelation matrix. TABLE 3 Effect of oil supplementation on the rumen fermentation andprotozoan numbers. Attributes CTR CON INT SEM P-value NHs-N (mg/100 ml) 19.7 18.8 17.9 0.20 <0.001 Total VFA (mM) 68.5 68.7 68.4 1.29 0.997 VFA (mmol) Acetate 51.9 50.5 50.7 1.03 0.850 Propionate 11.3 13.0 12.3D 0.25 0.006 Iso-butyrate 0.75 0.63 0.68 0.04 0.516 Butyrate 3.49 3.51 3.58 0.17 0.977 Iso-valerate 0.82 0.77 0.8C 0.04 0.900 Valerate 0.24 0.23 0.27 0.0 0.077 A/P ratio 4.59 3.878 4.12D 0.08 <0.001 Ruminal protozoa Total (x107 cells/ml) 9.26C 6.51b 5.30a 0.282 <0.001 Entodiniomorphs (x107 cells/ml) 8.870 6.25 5.08a 0.275 <0.001 Holotrichs (x10° cells/ml) 3.87b 2.548 2.19a 0.118 <0.001 Withdrawal Total (×10cells/ml) 9.2 8.62 8.69 0.130 0.113 Entodiniomorphs (×107 cells/ml) 9.01 8.40 8.48 0.123 0.092 Holotrichs (x10° cells/ml) 0.73 0.78 0.75 0.031 0.743 CTR, control (no oil supplementation); CON, daily oil feeding; INT, biweekly oilfeeding; NH3-N, ammonia nitrogen; VFA, volatile fatty acid. Mean values bearingdifferent superscripts in the same row differ significantly (p<0.05). mmol; however, the utilization of produced metabolic hydrogenin methanogenesis was 73, 54, and 56% in the respective groups.Results from the study indicated that 16-18% less metabolichydrogen was utilized in CON and INT groups on account ofreduced methanogenesis. Rumen Protozoa Supplementation of SWPO lowered (p <0.01) the numbersof total protozoa (×10cells/ml) in the CON (6.51) and INT(5.30) groups compared with the CTR group (9.21). Similarly,the numbers of Entodiniomorphs (×10 cells/ml) and Holotrichs(×10° cells/ml) in the CON and INT groups relative to the CTRgroup were low (p<0.01) (Table 3). Moreover, the differencein the total protozoa, Entodiniomorphs, and Holotrichs betweenthe CON and INT groups was also significant (p<0.01). Theammonia and ruminal protozoa (r=-0.62), and propionate andprotozoa (r=-0.49) negatively correlated (Figure 1). Data fromthe withdrawal study indicated similar numbers of total protozoa(p=0.11), Entodiniomorphs (p=0.09), and Holotrichs (p=0.74)among the groups. Archaeal Diversity Overall, 7,406,18355ppaired-endIrawWreads(mean 411,454)per samplewereggeneratedinnthisSstudy. After qualityfiltering and chimeric removal, a total of 4,735,849 paired-endreads (263,103 ±38,445) were retained for further analysiscomparing ruminal archaea diversity. The filtered reads werecategorized into 69 archaeal ASVs (Supplementary Figure 1).At the order level, the Methanobacteriales represented themost significant fraction of the ruminal archaea; however,no significant differences in abundance of archaea at theorder level between the CON, CTR, and INT groups wasobserved (Figure 2 and Supplementary File 1). Similarly,methanogens in this study were affiliated to three families,namely Methanobacteriaceae, Methanomassilliicoccaceae, andMethanosarcinaceae. Methanobacteriaceae constituted89.8%(range 88.6-91.0%)) of the total rumen archaea and theirdistribution remains unaffected with the oil supplementation. Similarly, at the genus level, Methanobrevibacter was the mostprominent genera in the sheep rumen; however, their proportionwas not significantly different (p=0.98) between the three groups.Despite their limited proportions, the abundance of Group9(p = 0.04) and Methanobacterium (p = 0.04) was significantlydifferent among the groups. The group9 archaea were lessabundant in the CTR group (0.12%) compared with the CON(0.26%) and INT (0.71%) groups, whereas the Methanobacteriumproportion in the CON group (0.91%) was significantly lower(p =0.04) than in the CTR (2.10%) and INT (3.24%) groups. Atthe species level, the proportions of Group3b (p=0.06), Group9(p = 0.03), and Methanobacterium (p = 0.04) were differentbetween the groups (Figure 2). The results for the archaealproportion in the present study indicated that ~98% of theruminal archaea remain unaffected by the oil supplementation,and only a minor fraction of the archaea (< 2%) showeda proportional increase or decrease (Figure 2). Moreover, theShannon index, which estimates alpha diversity, did not revealany significant differences in the archaeal diversity between thegroups (Figure 3). Core Archaeome At a minimum prevalence of 50% and a minimum detectionthreshold of 0.01, each group’s core archaeome was computed at the genus (Figure 4A) and species levels (Figure 4B)Methanobrevibacter、 Group12, Methanobacterium, andMethanosphaera constituted the core archaeome across thegroups. However, Group9 was exclusively present in the CTRand INT groups, whereas Group10 was present only in theCTR group. Comparison of archaeome at the species levelrevealed the presence of the Methanobrevibacter gottschalkiiclade, Group12 sp. ISO4-H5, Methanobrevibacter millerae, theMethanobrevibacter ruminantium clade, Methanobrevibacterwolinii, Methanosphaera IS03-F5, and Methanobacteriumsp. across the groups. The differences were observed in theproportion of Group10 sp. and Group9 sp. These two specieswere exclusively absent in the CON group. This analysis revealedthat the core archaeome in the CON group was distinct from theCTR and INT groups. DISCUSSION SWPO supplementation resulted in additional body weight gainsof 3.1 and 0.9 kg in the CON and INT groups, respectively, ascompared with the CTR group. Supplementation of SWPO inCON group led to an additional ADG (16.6 g/day). The lowerbody weight (kg) and ADG (g/day) in our study were mainly dueto the maturity of the experimental animals (18 months). Bodyweight gain and ADG would have been higher if the animals weregrowing (i.e., at the age of 3-6 months). Lipid supplementation is one of the established methods forreducing enteric methane emission (Pinares-Patino et al., 2016).The study also established that the SWPO supplementation indaily (CON) or biweekly (INT) regimes was equally effectivein reducing methane emissions. Methane yields (g/kg DMI)reported here were consistent with previous reports (Pinares-Patino et al., 2014; Charmley et al., 2016; Williams et al.,2019). The reduction in daily methane emissions (g/day) dueto long-term supplementation of SWPO was 5-8% higherthan a previous short-term study (Thirumalaisamy et al,2020). The supplementation of lipids mitigate methane emissionvia inhibition of hydrogen-producing microbes (Tapio et al.,2017), impeding microbial colonization and increasing hydrogensequestration (van Nevel and Demeyer, 1992) and a shift inmicrobiota (Vargas et al., 2020). However, the extent of methanereduction depends on the source of the lipids and the fatty acidcomposition. A significant reduction (23-26%) in daily entericmethane emissions due to SWPO supplementation demonstratedits anti-methanogenic effectiveness. A recent study (Jayanegaraet al., 2020) reported that supplementation with 5% insect oilseffectively reduced in vitro methane production. Like cricketand mealworm oil (Jayanegara et al., 2020), the SWPO alsopossesses a relatively higher proportion of unsaturated fatty acids(65.5%) than saturated. Oleic (C18:1) and linolenic (C18:3) aretwo primary unsaturated fatty acids in SWPO that aggregatelyrepresent 58.4% of the total fatty acids (Thirumalaisamy et al.,2020). One plausible explanation for the reduction in methaneemission can be the high degree of fatty acid unsaturation. The negative correlation between DMI (g/day) and MY(g/kg DMI) is consistent with previous studies (Muetzel, 2011; FIGURE 2| Ruminal archaea diversity in sheep from three different groups at (A) order level and (B) genus and species level. The increasing intensity of the samecolor shows the abundance in the CTR, CON, and INT groups. For instance, light blue indicates CTR, medium blue indicates CON, and dark blue indicates the INTgroup. *Denotes the significance in abundance among groups. CTR, control group (no oil); CON, daily oil supplementation; INT, biweekly oil supplementation. Hristov and Melgar, 2020). In addition, the higher energy intake(ME MJ/day) in test groups due to oil supplementation couldbe one of the reasons for the reduction in methane emissions.However, Bayat et al. (2018) did not observe any difference in MYdue to the variable energy density. Total VFA and acetate production were unaffected by theSWPO supplementation. However, a shift in the fermentationpattern with more propionate and a decreased acetate topropionate ratio was apparent in this ssttuuddyy.. The highpropionateeproduction andloweracetate tLcOpropionateratioVwithoutanyapparent changeentotal VFAandacetate concurs with the findings of previous studies (Jaleet al., 2006; Vargas et al., 2020). The reduction in rumenmethanogenesis in the CON and INT groups could be due to the additional propionate production, which utilized sparedH2. Fat supplementation is believed to be toxic to the rumenprotozoa(Machmiiller et al., 1998); however, the negativeimpact is not uniform across fat/oil sources and varies withthe degree of unsaturation (Jenkins, 1993). The negativeimpact of SWPO supplementation on protozoa was in thisstudy can be attributed to the high degree of unsaturationin the oil (Thirumalaisamy et al., 2020). It is well establishedthat defaunation leadlss to theeproliferation of succinate-producing bacteria (Kurihara et al., 1978; Ungerfeld et al.,2020), resulting in more propionate production (Eugène et al.,2004; Li et al., 2018). Th11isS Wwaas also substantiated by our resultsdemonstrating a negative correlation between rumen protozoaand propionate production. FIGURE 3|Alpha diversity of the ruminal archaea in sheep supplemented with silkworm pupae oil. CTR, control group (no oil); CON, daily oil supplementation; INT,biweekly oil supplementation. FIGURE 4|Ruminal archaea representing the core microbiome at a minimum prevalence of 50%. (A) Represents the core microbiome at the genus level in the CTR,CON, and INT groups, while (B) represents the core microbiome at the species level in the respective groups. The color gradients indicate the variability inprevalence. CTR, control; CON, daily oil supplementation; INT, biweekly oil supplementation. caproate and formate may be two other major sinks forH2 utilization. After methanogenesis, propionate isS(considered anothermajorrsinkfor H2 removaall(Janssen, 2010).The H2spared ffirom reduceddmethanogenesi1sS wasS,,hhowever,nnotcompletely redirected toopropionateproduction, indicatingthatamajorportionof上H122rremains unaccounteddffor.These findings are consistent with previous reports(Anderson1et al., 2010;Ungerfeld,2015), implyingthat Rumen protozoa are not essential for animal survival, butdue to their functional association with methanogens (Newboldet al., 2015), they held accountable for nearly 37% of methaneemissions (Machmuller et al., 2003). Results indicated thatthe SWPO supplementation effectively reduced the protozoal numbersSwith a concurrent decrease in enteric methaneemission. After the withdrawal of the oil supplementation,an increase in both the protozoal numbers and methaneemission confirmed their involvement in methane emission.This is consistent with a previous report (Sutton et al., 1983)confirming that the discontinuation feeding with oils increasedprotozoa numbers to the pre-supplementation level. The role ofrumen protozoa in bacterial predation is well known (Williamsand Coleman, 1992) and Entodiniomorphs are more efficientpredators than are the Holotrichs (Belanche et al., 2012).Although we have not explored the bacterial community inthe present study, a shift in the bacterial community dueto the reduction in predation by protozoa is expected. In ameta-analysis, Newbold et al. (2015) reported a 9% increasein the bacterial populations due to defaunation. One of themost consistent consequences of defaunation is the reductionin ammonia concentration (Newbold et al., 2015), which isalso evident in the current study. This could be explained bythe reduced bacterial breakdown due to the lower protozoalnumbers (Williams and Coleman, 1992); however, it needsfurther confirmation. There was little impact of protozoal reduction on themethanogens community. This contradicts a previous study(Tan et al., 2020) that reported a significant effect of protozoareduction on the methanogen community. In the currentstudy, Methanobrevibacter, despite being the prominent archaealgenus, wassimilarly distributed betweentest (CON andINT) and CTR groups. This is consistent with an earliershort-term study (Thirumalaisamy et al., 2020) that evaluatedSWPO at a similar level. Similarly, the distribution of theprominent species Methanobrevibacter gottschalkiii was alsouniform among the groups. These findings indicate that the coremethanogens in sheep remain unaffected by the daily or biweeklysupplementation of SWPO. A previous study (St-Pierre et al.,2015) also confirmed the dominance of Methanobrevibacter inthe sheep rumen. Only minor methanogens such as Group3b,Group9, and Methanobacterium having a distribution frequencyof < 2% in the archaeal community were affected with the SWPOsupplementation. Group3b methanogen was recently identifiedin the rumen (Jin et al., 2017) but with a limited distribution of~0.2%. The contribution of Group3b to rumen methanogenesisis yet to be investigated. SWPO is readily accessible in India (Srinivas et al., 2019) andcheaper than conventional edible oil sources (Government ofIndia, 2021). Animals in the CON and INT groups consumed3.24 and 1.61 L of oil during the experimental period of 180days. The daily financial cost (INR) for feeding SWPO in theCON and INT groups was only 0.72 and 0.36, respectively(1 US$ = 75 INR). Based on the prevailing price of mutton(INR 600/kg), sheep in the CON group, due to the SWPOsupplementation, had an additional ADG equivalent of INR9.96 per day. However, the supplementation in the INT groupled to an additional ADG of 4.2 g-only INR 2.52 per day.Thus, it would be far more economical for the farmers tofeed SWPO daily (CON) at the recommended level of 2%.Although we attempted the SWPO supplementation throughautomatic oral drenching in the present study, it may not be practicable in a farm setting. Adding SWPO to concentratemixture would be the most practical option on a farm, whichrequires further investigation. CONCLUSION From thepresent study, i1ttCbe concludeddtthattthe2%supplementation of SWPO as%of DMI over the longterm, with daily or biweekly supplementing, decreased dailymethane emissions of sheep by 23-26%. The supplementationof SWPO, either through daily or biweekly regimes, was equallyeffective in reducing methane emissions; however, the dailysupplementation of SWPO at the recommended level led to asignificant increase in body weight gain and average daily gaincompared with animals in the control and biweekly groups. Itcan be inferred from the discontinuation study that the dailysupplementation of SWPO is required to achieve a persistentreduction in enteric methane emission, and withdrawal of theoil supplementation led to an increase in enteric methaneemission to the pre-supplementation level. The oil did notsignificantly change the archaeal community composition butpersistently decreased the ruminal protozoa numbers. Thefeeding of SWPO may lead to a relatively higher average dailygain in growing sheep and, therefore, could result in a netprofit. Drenching of oil may not be practically feasible in thefarm settings; therefore, further studies will be required toinvestigate the methane mitigation potential of including SWPOinto formulated concentrates. DATA AVAILABILITY STATEMENT The datasets presented in this study can be found in onlinerepositories. The names of the repository/repositoriesand accession number(s) can be found in thearticle/Supplementary Material. ETHICS STATEMENT The animal study was reviewed and approved by InstituteAnimalFEthics Committee, NationalIInsttitute of AnimalNutrition and Physiology. AUTHOR CONTRIBUTIONS PM, AK, and RB conceived and designed the study. GTperformed the methane measurement, digestibility studies,executed the chemical composition, and ruminal fluid analysis.ST and AK performed the molecular bioinformatics analysis, andvisualization of the data. All authors participated in the dataanalysis and article writing. FUNDING The authors were thankful to the Indian Council of AgriculturalResearch, New Delhi, for providing the financial support to carryout this research under the outreach methane project entitled“Estimation of Methane Emission under Different FeedingSystems and Development of Mitigation Strategies.” ACKNOWLEDGMENTS We would like to thank the Director of the Institute for providingall the logistical support for the study. We are also thankful to REFERENCES Anderson, R. C., Huwe, J. K., Smith, D. J., Stanton, T. B., Krueger, N. A., Callaway,T. R., et al. (2010). Effect of nitroethane, dimethyl-2-nitroglutarate and 2-nitro-methyl-propionate on ruminal methane production and hydrogen balancein vitro. Bioresour. Technol. 101,5345-5349. doi: 10.1016/j.biortech.2009.11.108 AOAC (2005). Official method of Analysis. Association of Oficiating AnalyticalChemists. Washington DC: AOAC. AOAC (2012). Official method of Analysis. Association of Oficiating AnalyticalChemists. Washington DC: AOAC. Balch, W. E., Fox, G. E., Magrum, L. J., Woese, C. R., and Wolfe, R. S. (1979).Methanogens: reevaluation of a unique biological group. Microbiol. Rev. 43,260-296. doi: 10.1128/mmbr.43.2.260-296.1979 Bayat, A. R., Tapio, I., Vilkki, J., Shingfield, K. J., and Leskinen, H. (2018).Plant oil supplements reduce methane emissions and improve milk fattyacid composition in dairy cows fed grass silage-based diets withoutaffecting milk yield. J. Dairy Sci. 101, 1136-1151. doi: 10.3168/jds.2017-13545 Beauchemin, K. A., Ungerfeld, E. M., Eckard, R. J., and Wang,M.(2020). Fifty yearsof research on rumen methanogenesis: lessons learned and future challenges formitigation. Animal 14,s2-s16. Belanche, A., De la Fuente, G., Moorby, J. M., and Newbold, C. J. (2012). Bacterialprotein degradation by different rumen protozoal groups.. J. Anim. Sci. 90,4495-4504. doi: 10.2527/jas.2012-5118 Berndt, A., Boland, T. M., Deighton, M. H., Gere, J. I., Grainger, C., Hegarty,R. S., et al. (2014). “Guidelines for use of sulphur hexafluoride (SF6)tracer technique to measure enteric methane emissions from ruminants, inNew Zealand Agricultural Greenhouse Gas Research Centre, ed. M. Lambert(New Zealand: Ministry for Primary Industries), doi: 10.13140/2.1.2271.8241 Callahan, B. J., Sankaran, K., Fukuyama, J. A., McMurdie, P. J., and Holmes, S. P.(2016). Bioconductor workflow for microbiome data analysis: from raw readsto community analyses. F1000Research 5:492. doi: 10.12688/F1000RESEARCH.8986.1 Chang, J, Peng, S., Ciais, P., Saunois, M., Dangal, S. R. S., Herrero, M., et al.(2019). Revisiting enteric methane emissions from domestic ruminants andtheir 813CCH4 source signature. Nat. Commun. 10, 1-14. doi: 10.1038/s41467-019-11066-3 Charmley, E., Williams, S. R. O., Moate, P. J., Hegarty, R. S., Herd, R. M., Oddy,V. H., et al. (2016). A universal equation to predict methane production offorage-fed cattle in Australia. Anim. Prod. Sci. 56, 169-180. doi: 10.1071/AN15365 Conway, E. J. (1957). Micro-diffusion Analysis And Volumetric Error, 4th Edn.London Crossby: Lockwood and Sons Ltd. Crisan, E. V., and Sands, A. (1978).“Nutritional value of edible mushroom, inThe Biology and Cultivation of Edible Mushrooms, eds S. Chang and W. Hayer(New York, NY: Academic Press),137-168. Eugene, M., Archimede, H., and Sauvant, D. (2004). Quantitative meta-analysison the effects of defaunation of the rumen on growth, intake and digestion Dr. K. P. Suresh, ICAR-NIVEDI, Bengaluru, for helping withthe data analysis. SUPPLEMENTARY MATERIAL The Supplementary Material for this article can be foundonlineat:https://www.frontiersin.org/articles/10.3389/fmicb.2022.780073/full#supplementary-material Supplementary Figure 1|Rarefaction plot (A, before; B, after) showing thearchaeal richness in different groups of sheep receiving feed with or withoutsilkworm pupae oil. Supplementary File 1 | Read stats, OTUs taxonomy and percent abundance. in ruminants. Livest. Prod. Sci. 85, 81-97. doi: 10.1016/S0301-6226(03)00117-9 Filipek, J., and Dvooak, R. (2009). Determination of the volatile fatty acidcontent in the rumen liquid: comparison of gas chromatography and capillaryisotachophoresis. Acta Vet. Brno 78, 627-633. doi: 10.2754/avb200978040627 Gerber, P. J., Hristov, A. N., Henderson, B., Makkar, H., Oh, J., Lee, C., et al.(2013). Technical options for the mitigation of direct methane and nitrousoxide emissions from livestock: a review. Animal 7(Suppl. 2), 220-234. doi:10.1017/S1751731113000876 Government ofIndia((2021).Ministry of Consumer Afairs, Food andPublicDistribution. Available online at:https://consumeraffairs.nic.in/comparativetestbyconsumersa/edible-vegetable-oil.(acessed December 8.2021). Guan, H., Wittenberg, K. M., Ominski, K. H., and Krause, D. O. (2006). Efficacyof ionophores in cattle diets for mitigation of enteric methane. J. Anim. Sci. 84,1896-1906. doi: 10.2527/ias.2005-652 Guyader, J, Eugene, M., Noziere, P., Morgavi, D. P., Doreau, M., andMartin, C. (2014). Influence of rumen protozoa on methane emission inruminants: a meta-analysis approach. Animal 8, 1816-1825. doi: 10.1017/S1751731114001852 Guyader, J., Ungerfeld, E. M., and Beauchemin, K. A. (2017). Redirection ofmetabolic hydrogen by inhibiting methanogenesis in the rumen simulationtechnique (RUSITEC). Front. Microbiol. 8:393. doi: 10.3389/fmicb.2017.00393 Hristov, A. N., and Melgar, A. (2020). Short communication: relationshipof dry matter intake with enteric methane emission measured withthe GreenFeed system in dairy cows receiving a diet without or with3-nitrooxypropanol. Animal 14, s484-s490. doi: 10.1017/S1751731120001731 Hristov, A. N., Oh, J., Firkins, J. L., Dijkstra, J., Kebreab, E., Waghorn, G., et al.(2013). Special topics-Mitigation of methane and nitrous oxide emissions fromanimal operations: i. A review of enteric methane mitigation options. J. Anim.Sci. 91,5045-5069. Hungate, R. E. (1966). The Rumen And Its Microbes. New York, NY: AcademicPress Inc. ICAR (2013). Nutrient Requirements of Cattle and Buffalo. Indian Council ofAgricultural Research. New Delhi: Indian Council of Agricultural Research. Jale, D., Potkanski, A., Szumacher-Strabel, M., Kowalczyk, J., and Cieslak, A.(2006). The effect of a high forage diet and different oil blends on rumenfermentation in vitro. J. Anim. Feed Sci. 15, 141-144. doi: 10.22358/jafs/70429/2006 Janssen, P. H. (2010). Influence of hydrogen on rumen methane formation andfermentation balances through microbial growth kinetics and fermentationthermodynamics. Anim. Feed Sci. Technol. 160, 1-22. doi: 10.1016/j.anifeedsci.2010.07.002 Jayanegara, A., Gustanti, R., Ridwan, R., and Widyastuti, Y. (2020). Fatty acidprofiles of some insect oils and their effects on in vitro bovine rumenfermentation and methanogenesis. Ital. J. Anim. Sci. 19,1311-1318. doi: 10.1080/1828051X.2020.1841571 Jenkins, T. C. (1993). Lipid Metabolism in the Rumen. J. Dairy Sci. 76, 3851-3863.doi: 10.3168/jds.S0022-0302(93)77727-9 Jin, W., Cheng, Y., and Zhu, W. (2017). The community structure ofMethanomassiliicoccales in the rumen of Chinese goats and its response toa high-grain diet. J. Anim. Sci. Biotechnol. 8, 1-10. doi: 10.1186/s40104-017-0178-0 Johnson, K. A., and Johnson, D. E. (1995). Methane emissions from cattle. J. Anim.Sci. 73, 2483-2492. doi: 10.2527/1995.7382483x Kamra,D. N., and Agarwal, N. (2003).“Rumen protozoa, in Techniques in RumenMicrobiology, eds D. N. Kamra and N. Agarwal (Bareilly: Centre of AdvanceStudies in Animal Nutrition, Indian Veterinary Research Institute, Izatnagar),35-45. Kurihara, Y., Takechi, T., and Shibata,F.(1978). Relationship between bacteria andciliate protozoa in the rumen of sheep fed on a purified diet. J. Agric. Sci. 90,373-381. doi: 10.1017/S0021859600055489 Lahti, L., and Shetty, S. (2012). Microbiome@GitHub. Available online at: url:https://github.com/microbiome/microbiome (accessed July 31, 2020). Lassey, K. R., Martin, R. J, Williams, S. R. O., Berndt, A., Iwaasa,A. D., Hegarty, R. S., et al. (2014).“Analysis of breath samples, inGuidelines For Use Of Sulphur Hexafluoride (Sf6) Tracer Technique ToMeasure Enteric Methane Emissions From Ruminants, ed. M. G. Lambert(New Zealand: New Zealand Agricultural Greenhouse Gas Research Centre),89-112. Li, Z., Deng, Q., Liu, Y., Yan, T., Li, F., Cao, Y., et al. (2018). Dynamics ofmethanogenesis, ruminal fermentation and fiber digestibility in ruminantsfollowing elimination of protozoa: a meta-analysis. J. Anim. Sci. Biotechnol. 9,1-9. doi: 10.1186/s40104-018-0305-6 Love, M. I., Huber, W., and Anders, S. (2014). Moderated estimation of foldchange and dispersion for RNA-seq data with DESeq2. Genome Biol. 15, 1-21.doi: 10.1186/s13059-014-0550-8 Machmuller, A., Ossowski, D. A., Wanner, M., and Kreuzer, M. (1998). Potential ofvarious fatty feeds to reduce methane release from rumen fermentation in vitro(Rusitec). Anim. Feed Sci. Technol. 71, 117-130. doi: 10.1016/S0377-8401(97)00126-0 Machmiiller, A., Soliva, C. R., and Kreuzer, M. (2003). Methane-suppressingeffect of myristic acid in sheep as affected by dietary calcium andforageproportion. Br. J Nutr. 90, 529-540. doi:10.1079/bjn2003932 Marty, R. J., and Demeyer, D. I. (1973). The effect of inhibitors of methaneproduction of fermentation pattern and stoichiometry in vitro using rumencontents from sheep given molasses. Br. J. Nutr. 30, 369-376. doi: 10.1079/bjn19730041 Mathison, G. W., Okine, E. K., McAllister, T. A., Dong, Y., Galbraith, J., andDmytruk, O. I. N. (1998). Reducing methane emissions from ruminantanimals. J. Appl. Anim. Res. 14, 1-28. doi: 10.1080/09712119.1998.9706212 McMurdie, P. J., and Holmes, S. (2013). Phyloseq: an R package for reproducibleinteractive analysis and graphics of microbiome census data. PLoS One8:e61217. doi: 10.1371/journal.pone.0061217 Moate, P. J., Richard, S., Williams, O., Deighton, M. H., Pryce, J. E., Hayes,B. J., et al. (2014).“Mitigation of enteric methane emissions from theAustralian dairy industry, in Proceedings of the 5th Australasian DairyScience Symposium, Hamilton New Zealand, 121-140. doi: 10.13140/2.1.2172.4489 Morgavi, D. P., Forano, E., Martin, C., and Newbold, C. J. (2010). Erratum:microbial ecosystem and methanogenesis in ruminants. Animal 4,1024-1036.doi: 10.1017/S1751731112000407 Muetzel, S. (2011). Effect Of Level Of Intake On Methane Production Per Kg OfDryMatter Intake. MAF Technical Paper No: 2011/95. New Zealand: Ministry ofAgriculture and Forestry, AgResearch. Newbold, C. J., De la Fuente, G., Belanche, A., Ramos-Morales, E., and McEwan,N. R. (2015). The role of ciliate protozoa in the rumen. Front. Microbiol. 6:1313.doi: 10.3389/fmicb.2015.01313 Oksanen, J., Blanchet, F. G., Kindt, R., Legendre, P., Minchin, P. R., O'hara, R. B.,et al. (2013). Package Vegan." Community Ecology Package, Version 2, no. 9,1-295. Pinares-Patino, C. S., Franco, F. E., Molano, G., Kjestrup, H., Sandoval, E.,MacLean, S., et al. (2016). Feed intake and methane emissions from cattle grazing pasture sprayed with canola oil. Livest. Sci. 184, 7-12. doi: 10.1016/j.livsci.2015.11.020 Pinares-Patino, C., Williams, S. R. O., Martin, C., Swainson, N. M., Berndt, A.,Molano, G., et al. (2014).“Data quality assurance and quality control, inGuidelines For Use Of Sulphur Hexaflouride Tracer Technique To MeasureEnteric Methane Emission From Ruminants, ed. M. G. Lambert (New Zealand:New Zealand Agricultural Greenhouse Gas Research Centre), 166. Seedorf, H., Kittelmann, S., Henderson, G., and Janssen, P. H. (2014). RIM-DB:a taxonomic framework for community structure analysis of methanogenicarchaea fromthe rumen and other intestinal environments. PeerJ 2:e494. doi:10.7717/peerj.494 Srinivas, G., Nidoni, U., Ct, R., and Kt, R. (2019). Supercritical fluid extractionof pupae oil from mulberrysilkworm (Bombyx Supercritical fluid extractionof pupae oilfrom mulberry silkworm (Bombyx mori L.). J. PharmacognPhytochem. 8,4507-4513. St-Pierre,B., Cersosimo,L. M., Ishaq, S. L., and Wright, A. D. G. (2015). Toward theidentification of methanogenic archaeal groups as targets of methane mitigationin livestock animals. Front. Microbiol. 6:776. doi: 10.3389/fmicb.2015.00776 Sutton, J. D., Knight, R., McAllan, A. B., and Smith, R. H. (1983). Digestionand synthesis in the rumen of sheep given diets supplemented withfree and protected oils. Br. J. Nutr. 49, 419-432. doi: 10.1079/bjn19830051 Takai, K., and Horikoshi, K. (2000). Rapid detection and quantification of membersof the archaeal community by quantitative PCR using fluorogenic probes.Appl. Environ. Microbiol. 66, 5066-5072. doi: 10.1128/AEM.66.11.5066-5072.2000 Tan, C., Ramirez-Restrepo, C. A., Shah, A. M., Hu, R., Bell, M., Wang, Z., et al.(2020). The community structure and microbial linkage of rumen protozoaand methanogens in response to the addition of tea seed saponins in thediet of beef cattle. J. Anim. Sci. Biotechnol. 11:80. doi: 10.1186/s40104-020-00491-W Tapio, I., Snelling,T. J., Strozzi, F., andWallace, R. J. (2017). Theruminal microbiome associated with methane emissions from ruminantlivestock. J. Anim. Sci. Biotechnol. 8:7, doi: 10.1186/s40104-017-0141-0 Thirumalaisamy, G., Malik, P. K., Kolte, A. P., Trivedi, S., Dhali, A., and Bhatta, R.(2020). Effect of silkworm (Bombyx mori) pupae oil supplementation on entericmethane emission and methanogens diversity in sheep. Anim. Biotechnol. 33,128-140. doi: 10.1080/10495398.2020.1781147 Ungerfeld,E. M. (2015). Shifts in metabolic hydrogen sinks in the methanogenesis-inhibited ruminal fermentation: a meta-analysis. Front. Microbiol. 6:37. doi:10.3389/fmicb.2015.00037 Ungerfeld, E. M., Evans, P., Hoedt, E. C., Li, z., Zhang, Z., Guan, L., et al. (2020).Comparative microbiome analysis reveals the ecological relationships betweenrumen methanogens, acetogens, and their hosts ecology of methanogens andacetogens in the rumen. Front. Microbiol. 1:1311. doi: 10.3389/fmicb.2020.01311 van Nevel, C. J., and Demeyer, D. I. (1992). Influence of antibiotics anda deaminase inhibitor on volatile fatty acids and methane productionfrom1ddetergent washeddhay and soluble starch by rumenmicrobesin vitro. Anim. Feed Sci. Technol. 37, 21-31. doi: 10.1016/0377-8401(92)90117-O Van Soest, P. J., Robertson, J. B., and Lewis, B. A. (1991). Methods for dietary fiber,neutral detergent fiber, and nonstarch polysaccharides in relation to animalnutrition. J. Dairy Sci. 74, 3583-3597. Vargas, J. E., Andres, S., Lopez-Ferreras, L., Snelling, T. J., Yanez-Ruiz, D. R.,Garcia-Estrada, C., et al. (2020). Dietary supplemental plant oils reducemethanogenesis from anaerobic microbial fermentation in the rumen. Sci. Rep.10:1613.doi: 10.1038/s41598-020-58401-z Wemheuer, B.,Wemheuer,F and Daniel, R. (2012). RNA-basedassessment of diversity and composition of active archaeal communitiesin the GermanBight.Archaea 2012:695826 doi: 10.1155/2012/695826 Wickham, H. (2011). ggplot2. Wiley Interdiscip. Rev. Comput. Stat. 3, 180-185.doi: 10.1002/wics.147 Williams, A. G., and Coleman, G. S. (1992). The Rumen Protozoa. New York, NY:Springer-Verlag. Williams, S.. R. O., Hannah, M. C., Jacobs, J. L., Wales, W. J., andMoate, P. J. (2019). Volatile fatty acids in ruminal fluid can be used topredict methane yield of dairy cows. Animals 9:1006. doi: 10.3390/ani9121006 Williams, S. R. O., Moate, P. J., and Deighton, M. H. (2014).“Sampling backgroundair, in Guidelines For Use Of Sulphur Hexaflouride (Sf6) Tracer TechniqueTo Measure Enteric Methane Emissions From Ruminants, ed. M. G. Lambert(New Zealand: New Zealand Agricultural Greenhouse Gas Research Centre),81-88. Yanagita, K., Kamagata, Y., Kawaharasaki, M., Suzuki, T., Nakamura, Y., andMinato, H. (2000). Phylogenetic analysis of methanogens in sheep rumenecosystem and detection of Methanomicrobium mobile by fluorescence in situhybridization.Biosci. Biotechnol. Biochem. 64,1737-1742. doi: 10.1271/bbb.64.1737 Yu, Z., and Morrison, M. (2004). Improved extraction of PCR-quality communityDNA from digesta and fecal samples. Biotechniques 36, 808-812. doi:10.2144/04365st04 Conflict of Interest: The authors declare that the research was conducted in theabsence of any commercial or financial relationships that could be construed as apotential conflict of interest. Publisher's Note: All claims expressed in this article are solely those of the authorsand do not necessarily represent those of their affiliated organizations, or those ofthe publisher, the editors and the reviewers. Any product that may be evaluated inthis article, or claim that may be made by its manufacturer, is not guaranteed orendorsed by the publisher. Copyright @ 2022 Thirumalaisamy, Malik, Trivedi, Kolte and Bhatta. This is anopen-access article distributed under the terms of the Creative Commons AttributionLicense (CC BY). The use, distribution or reproduction in other forums is permitted,provided the original author(s) and the copyright owner(s) are credited and that theoriginal publication in this journal is cited, in accordance with accepted academicpractice. No use, distribution or reproduction is permitted which does not complywith these terms.
关闭-
1/14
-
2/14
还剩12页未读,是否继续阅读?
继续免费阅读全文产品配置单
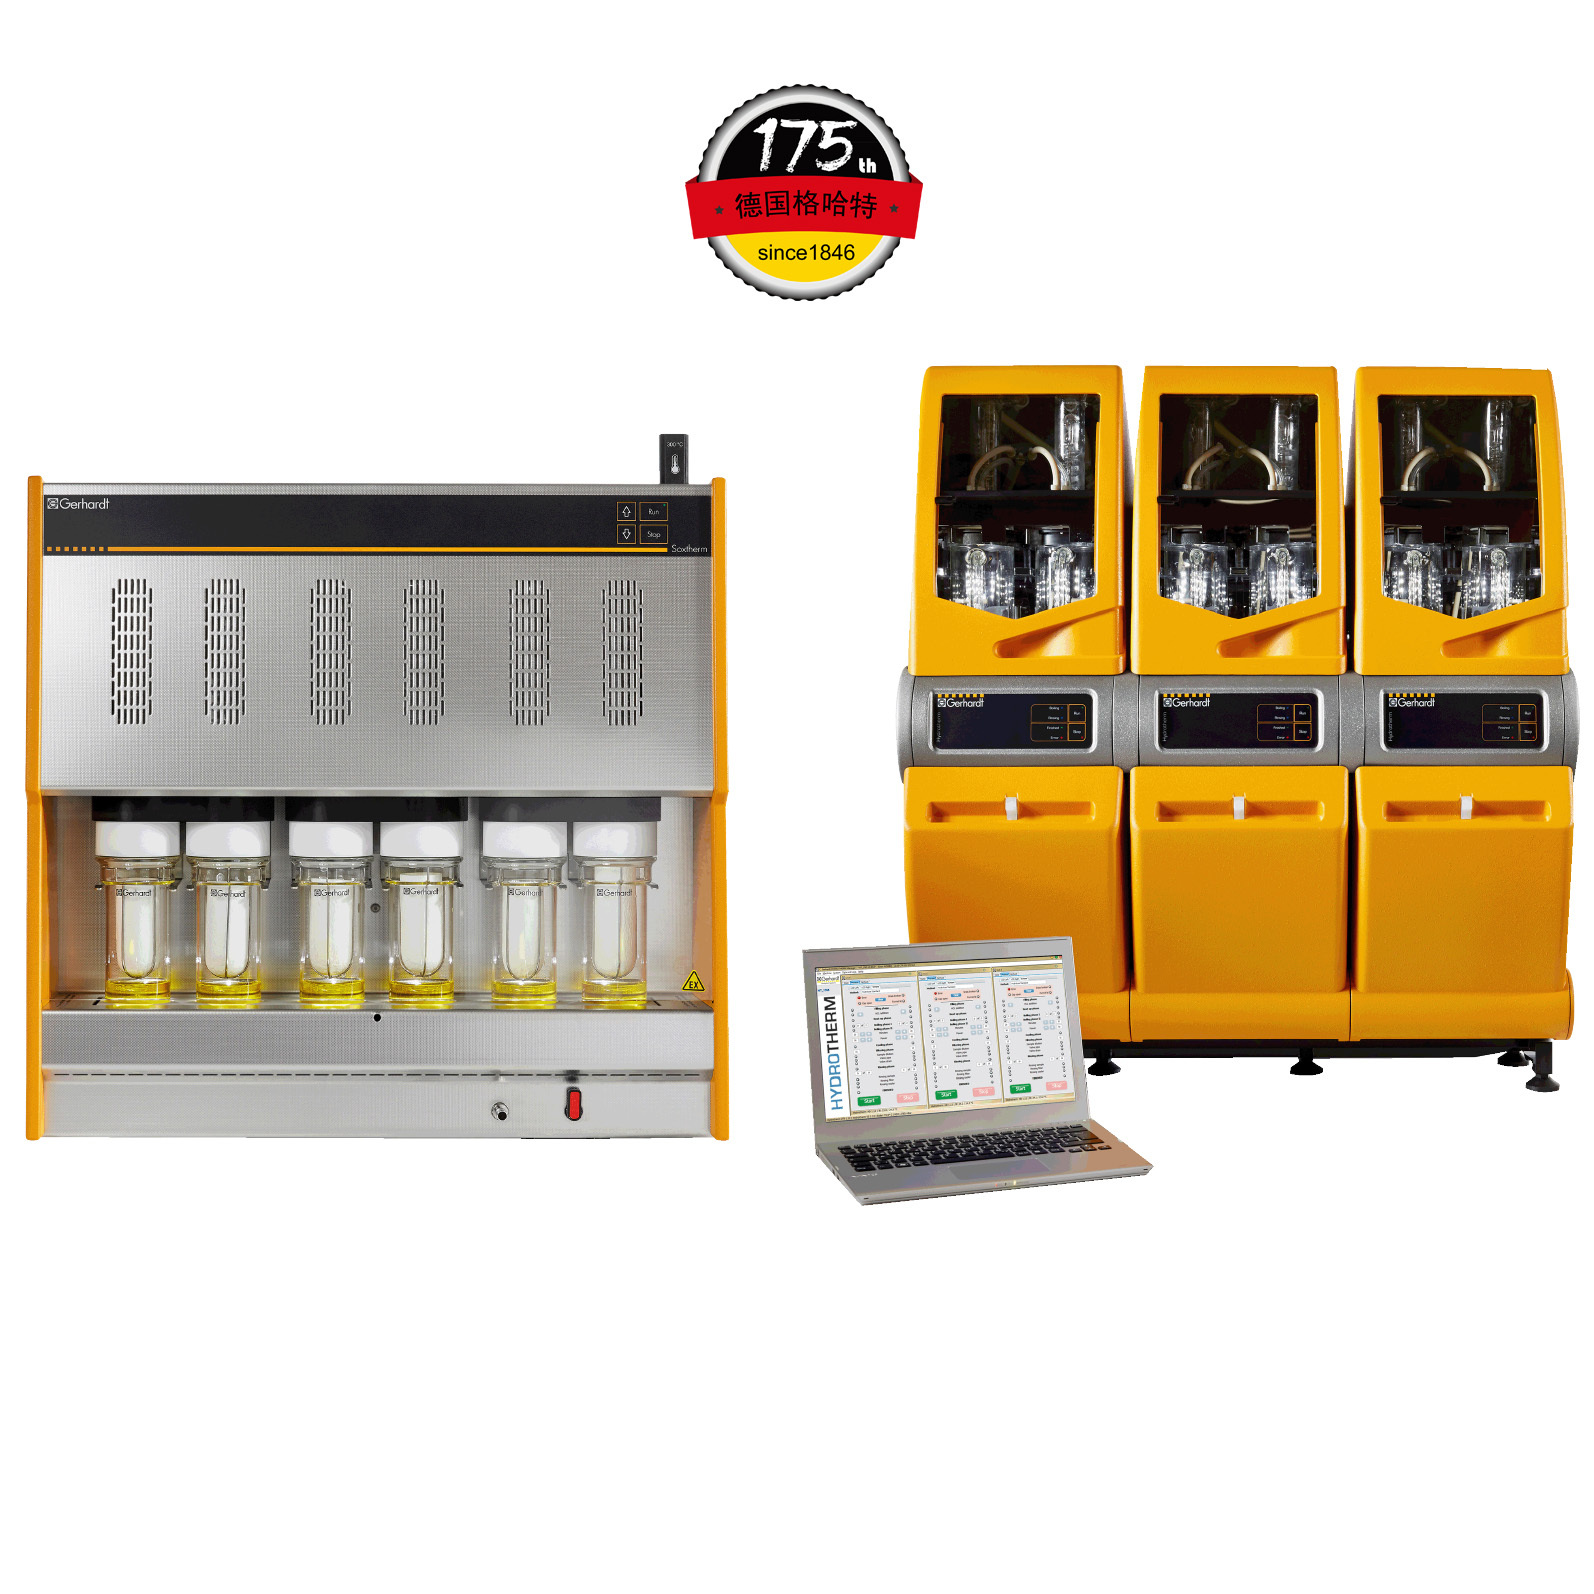
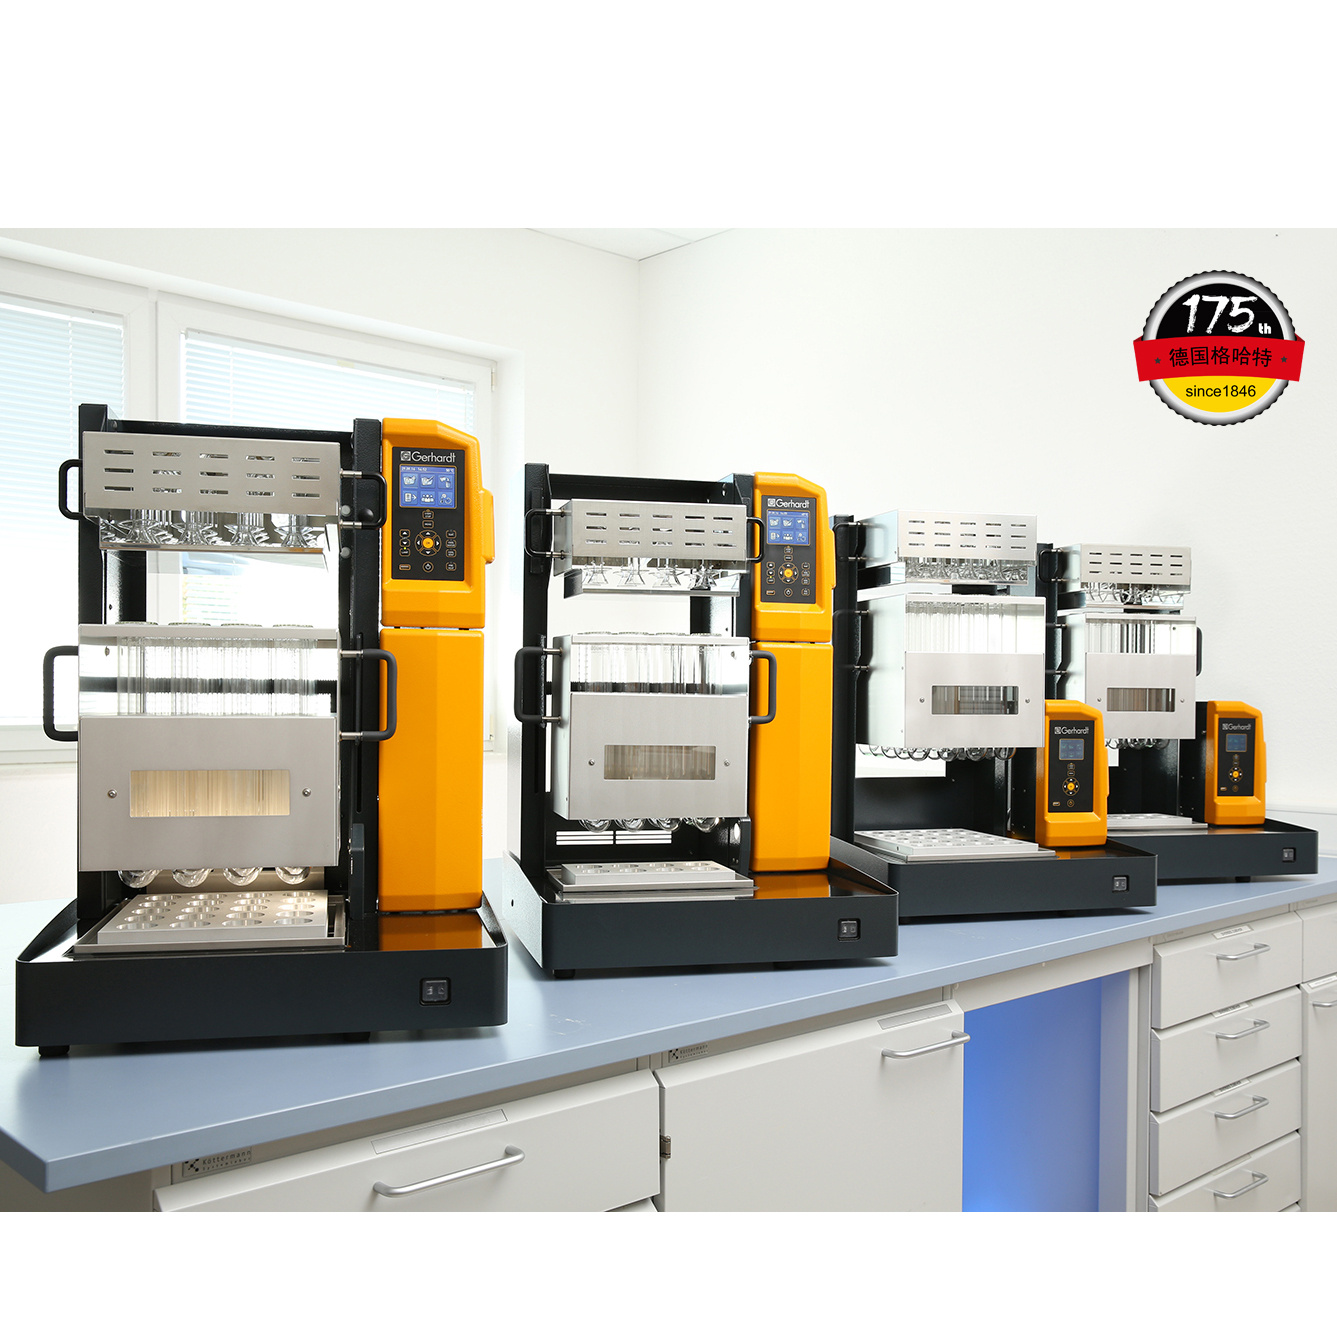
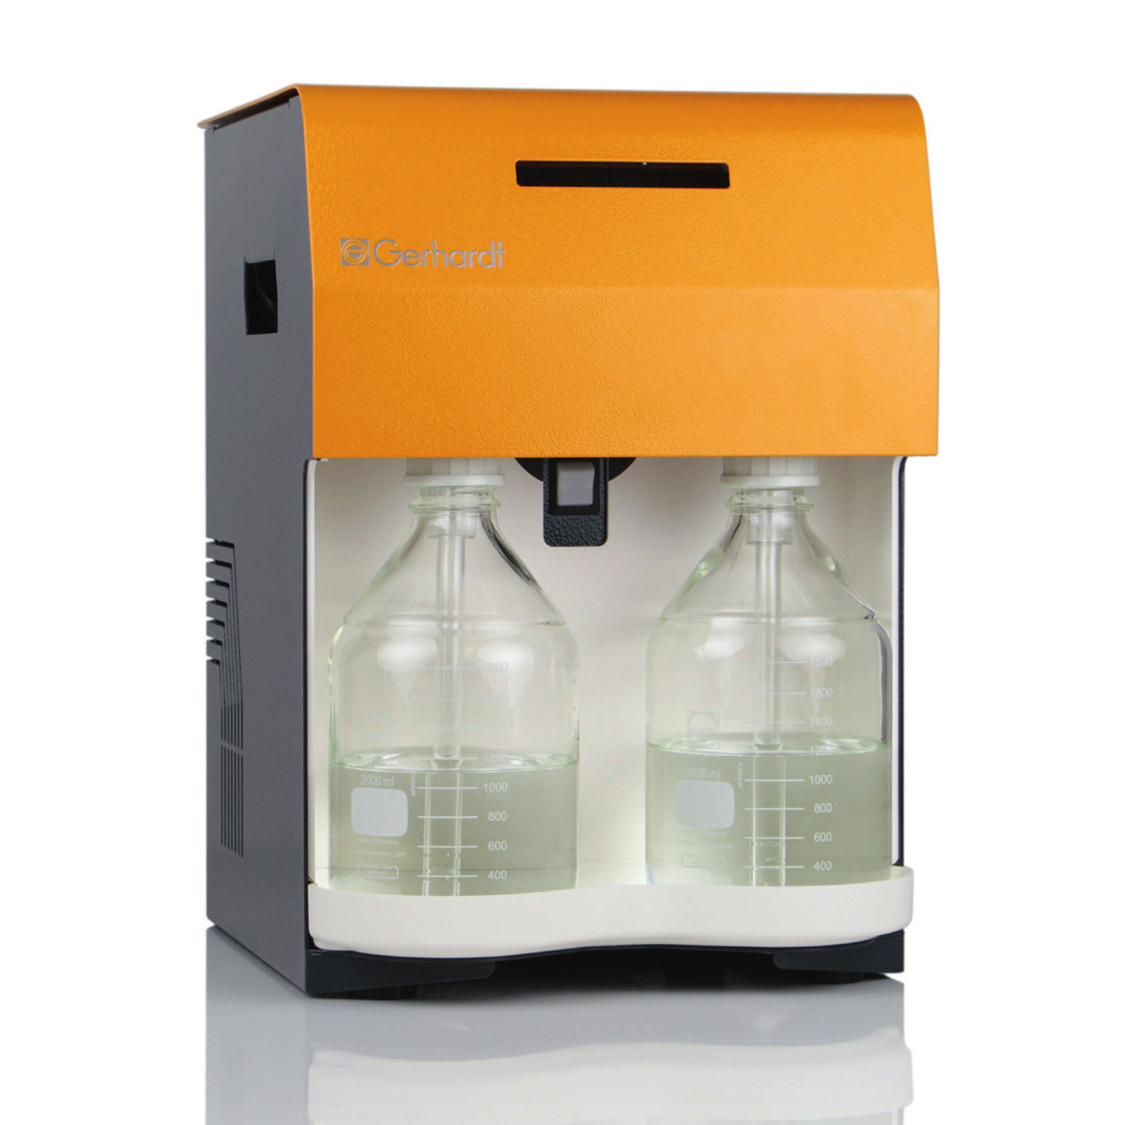
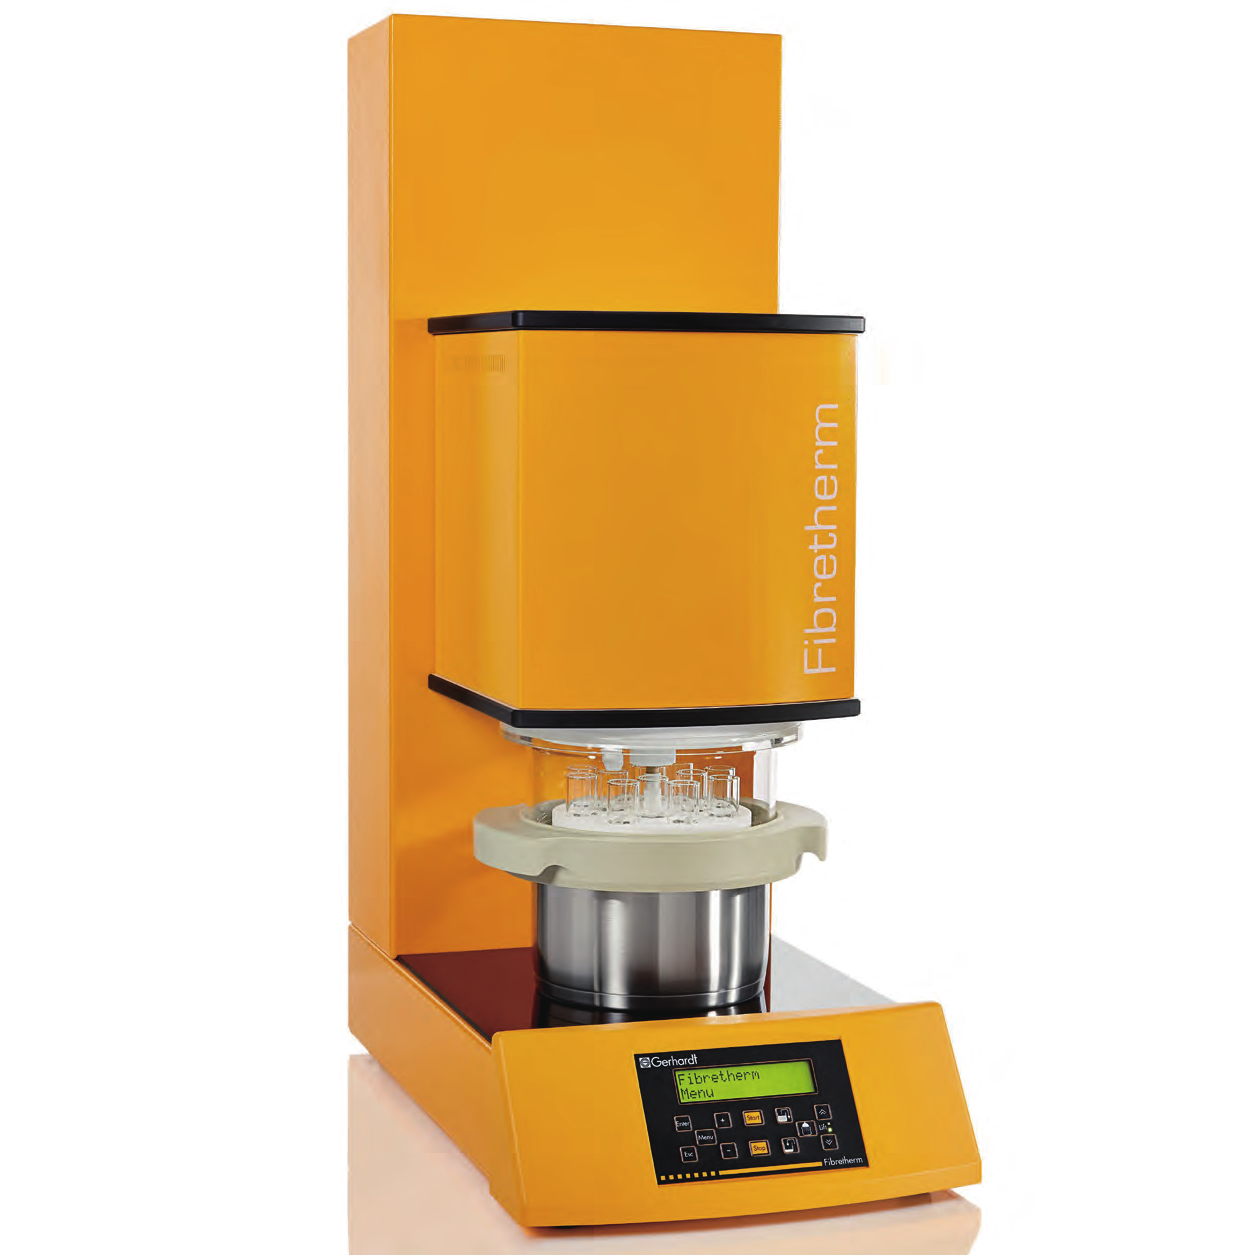
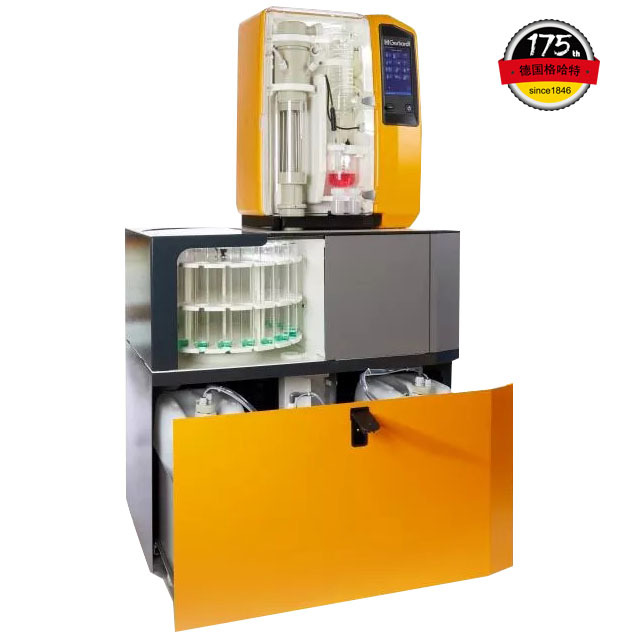
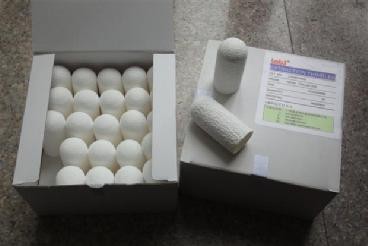
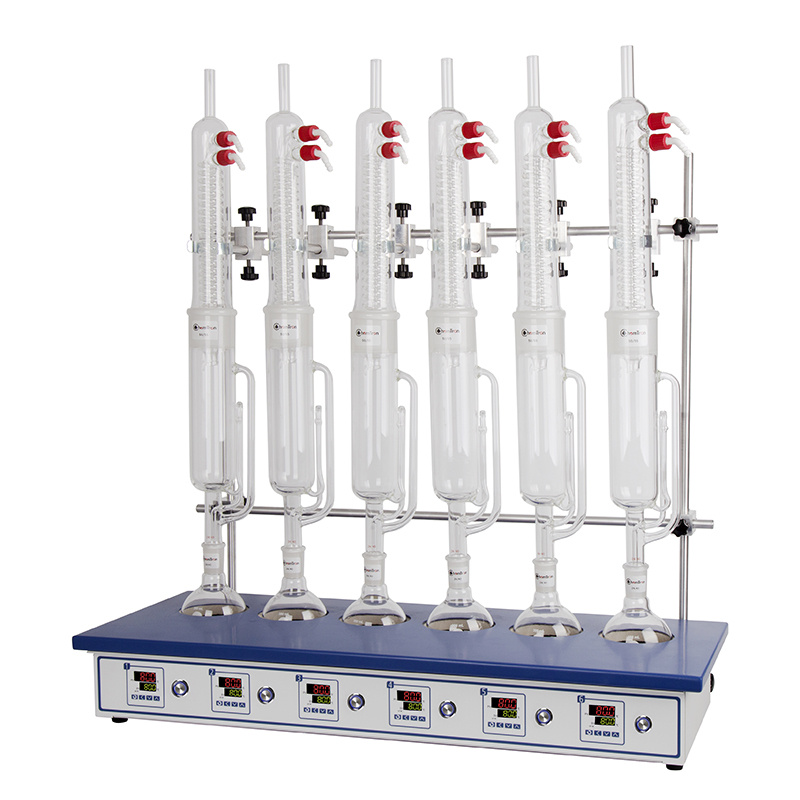
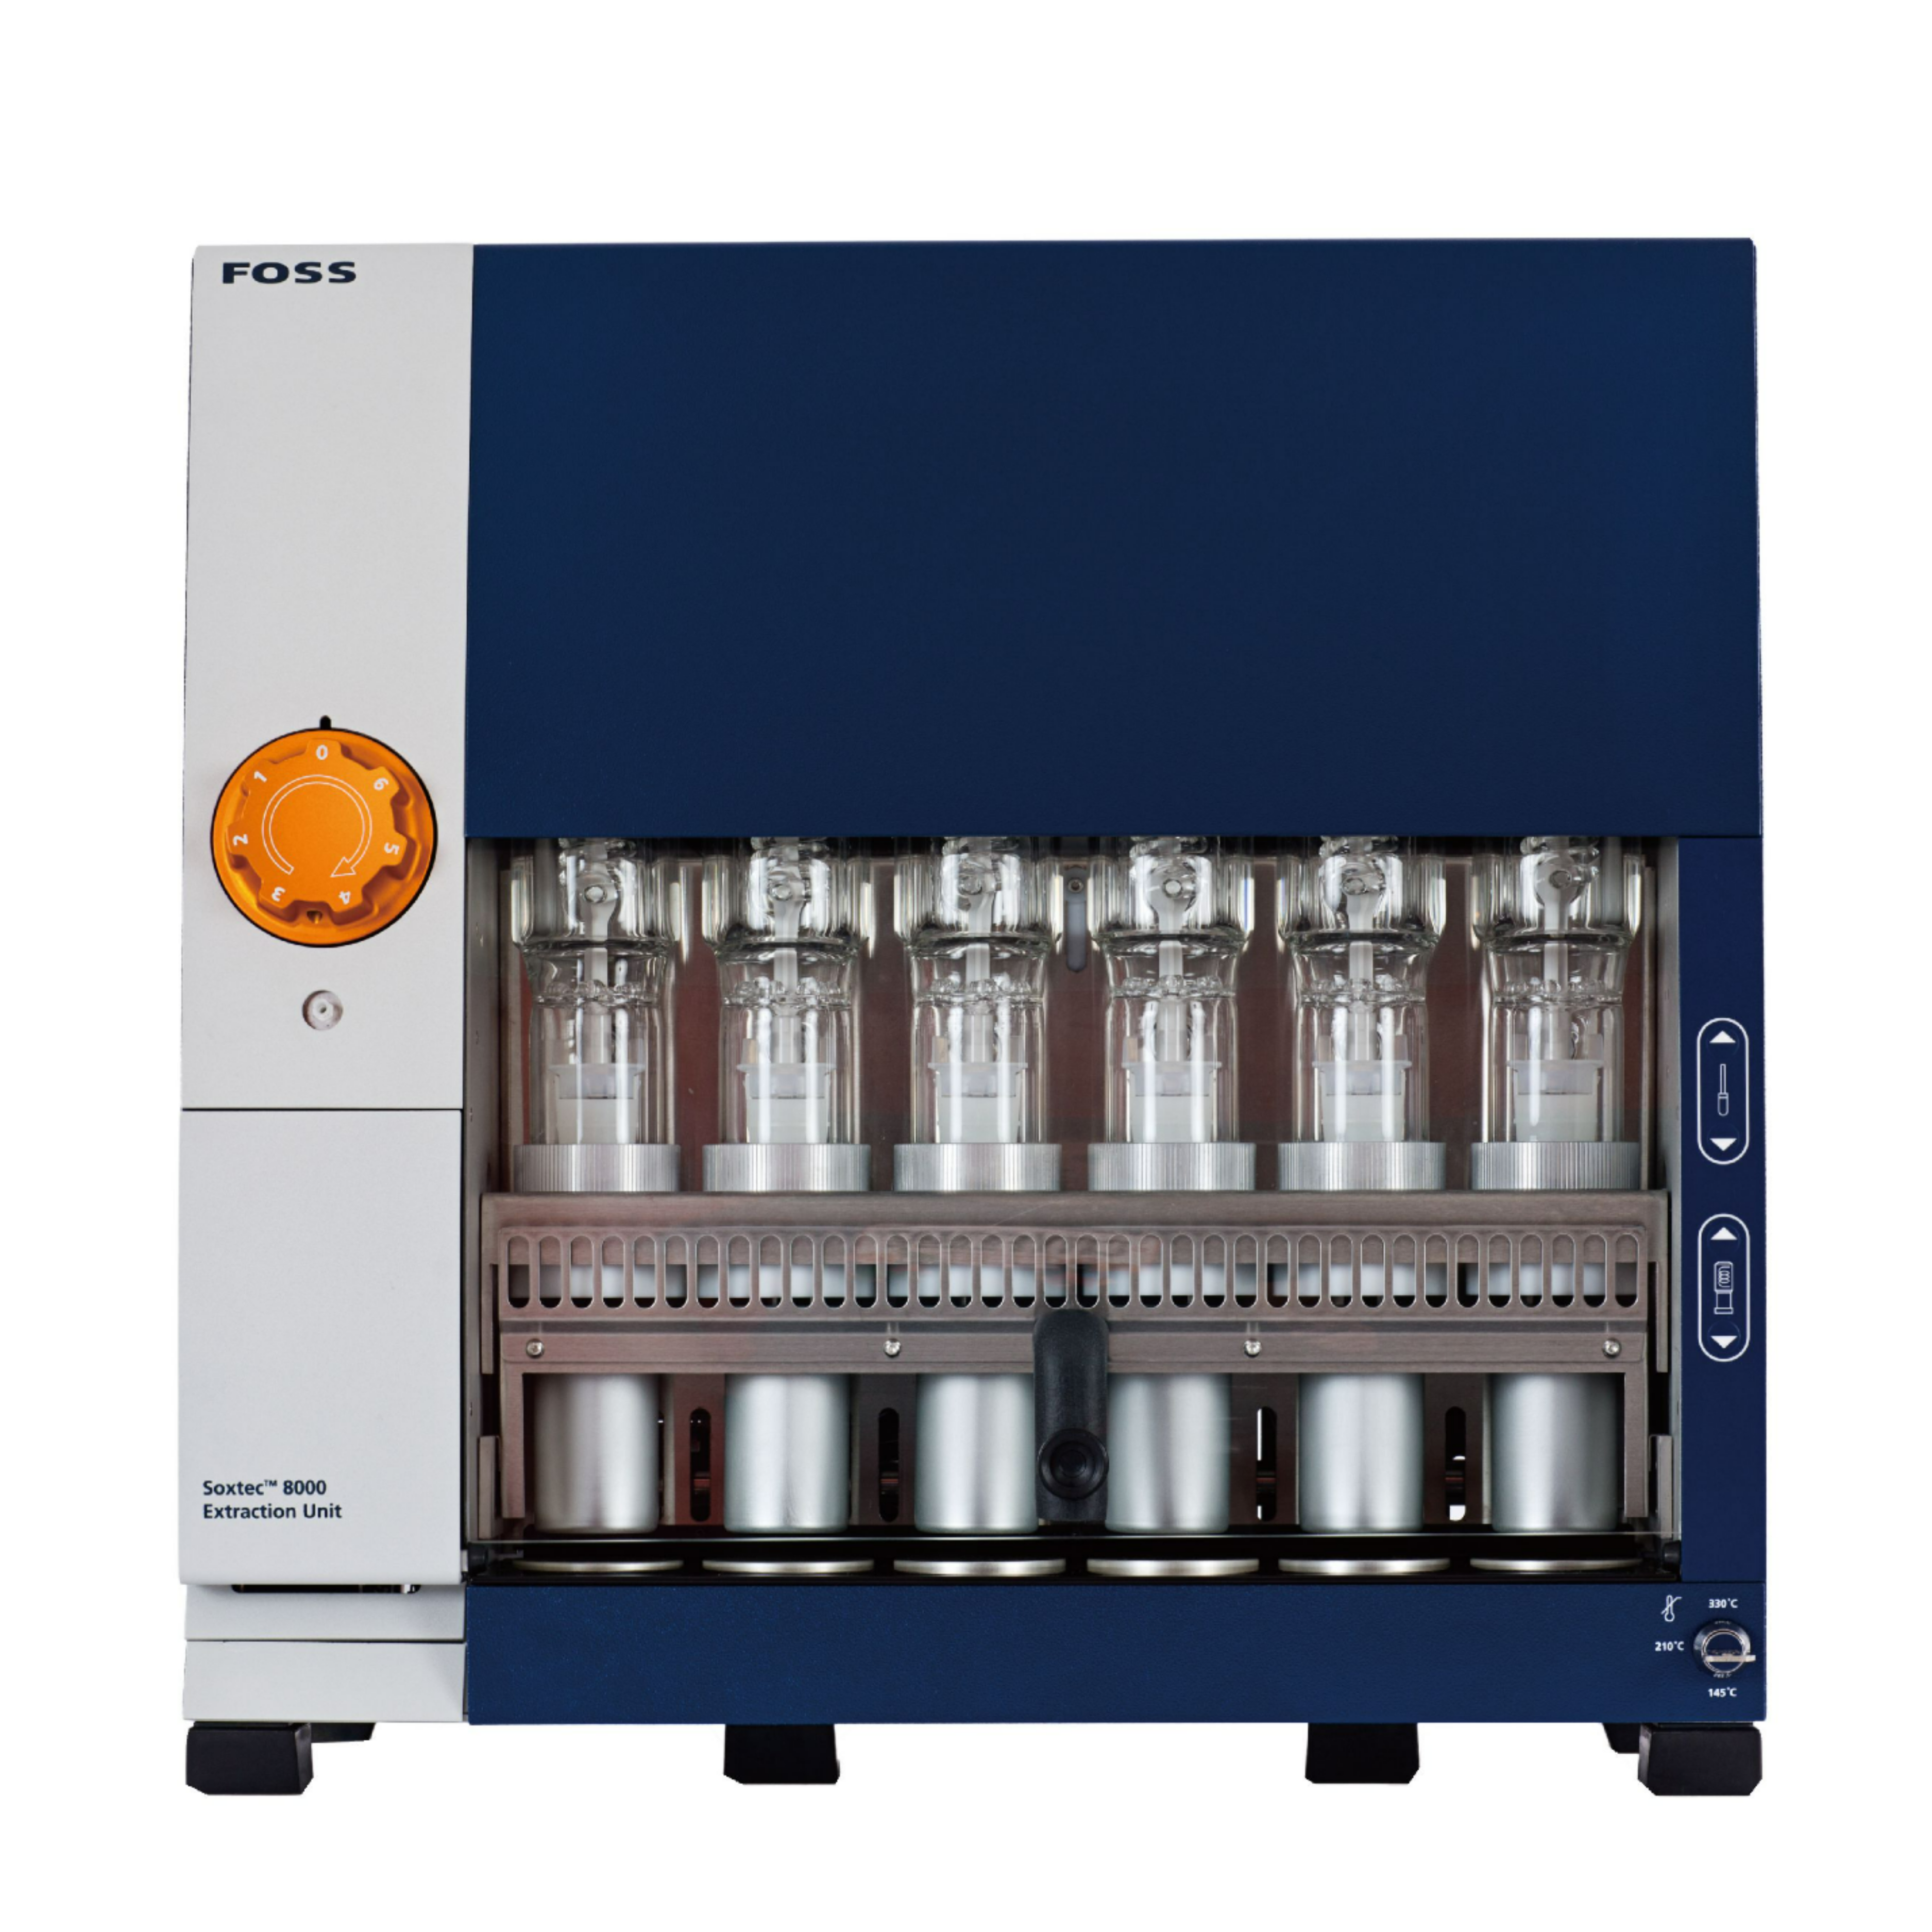
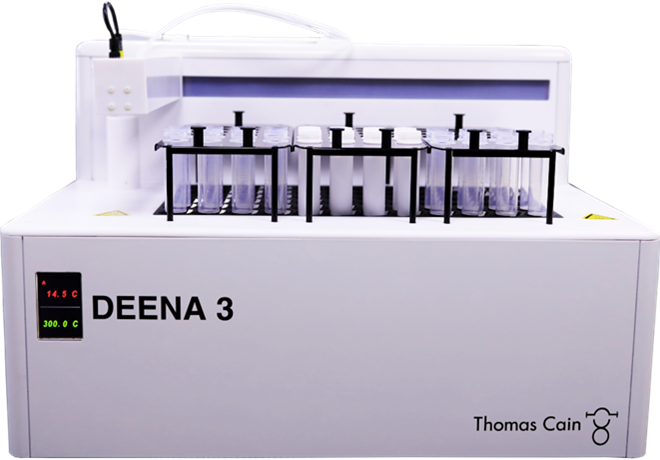
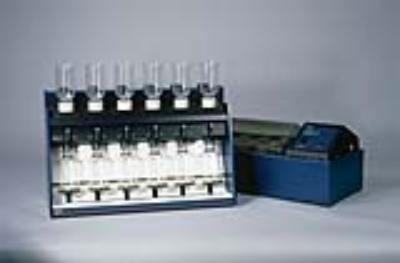
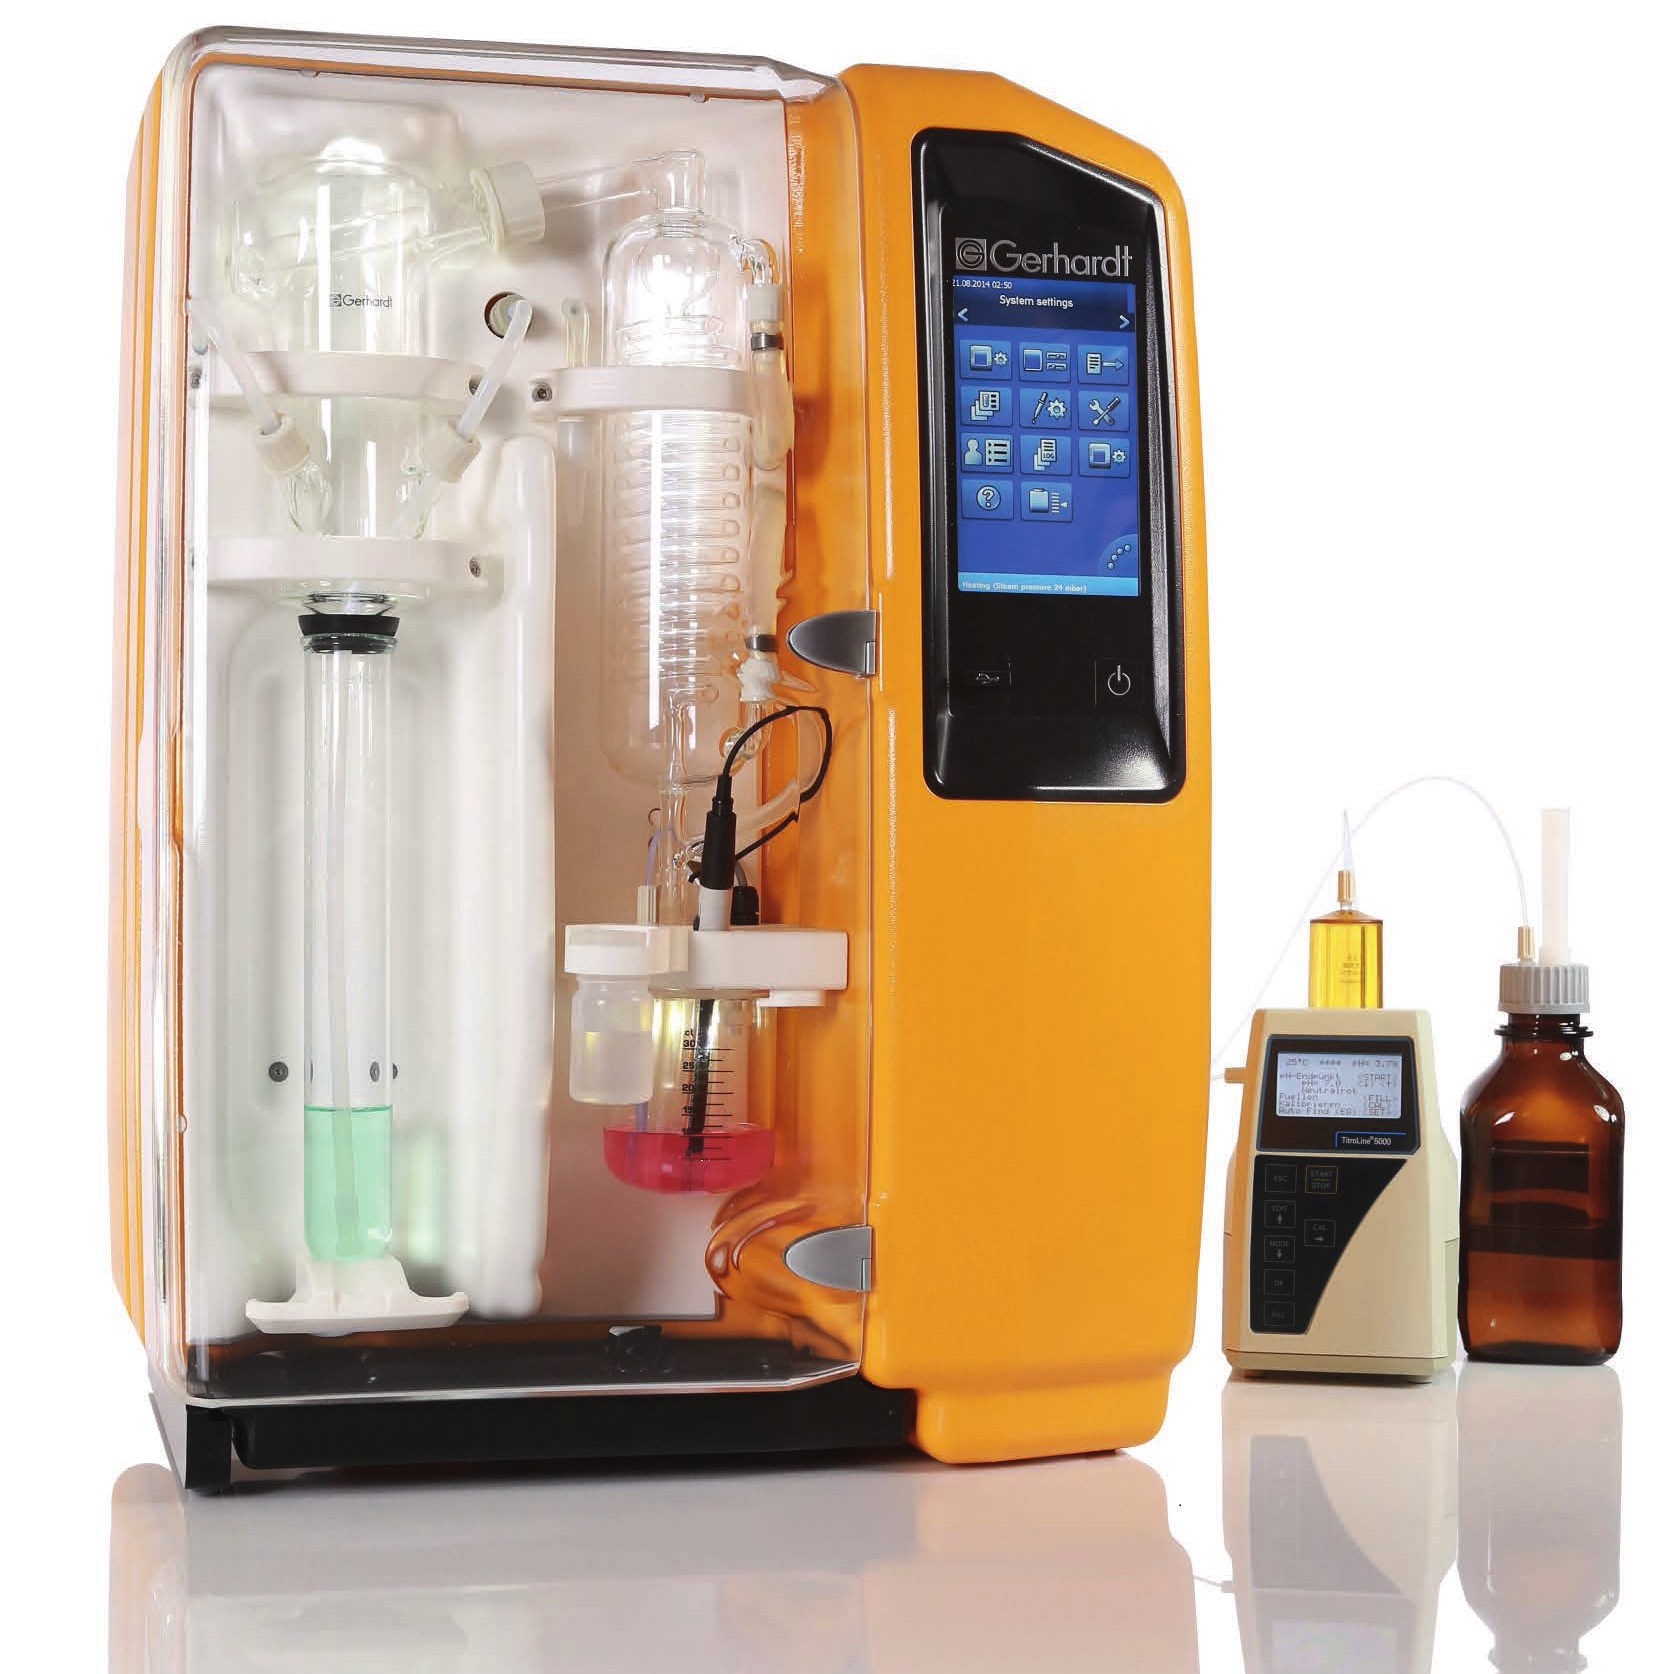
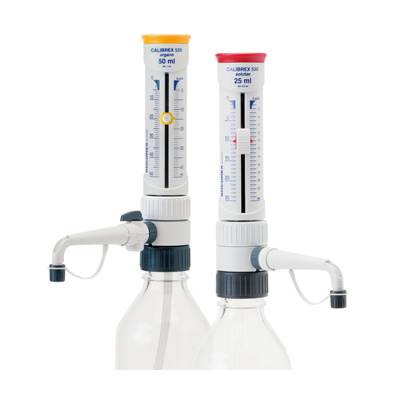
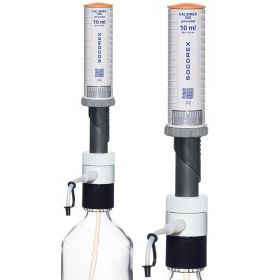
中国格哈特为您提供《羊饲料和排泄物蛋白质、脂肪、粗纤维、中性洗涤纤维、酸性洗涤纤维含量的检测》,该方案主要用于饲料中营养成分检测,参考标准《暂无》,《羊饲料和排泄物蛋白质、脂肪、粗纤维、中性洗涤纤维、酸性洗涤纤维含量的检测》用到的仪器有格哈特全自动超级总脂肪测定系统HT6+SOX416、格哈特凯氏消化系统KT8S、格哈特维克松废气实验室废物处理系统涤气VS、格哈特全自动型纤维分析仪FT12、格哈特带自动进样器凯氏定氮仪VAP500C、德国加液器MM、滤纸筒。
我要纠错


相关方案
 咨询
咨询