西南民族大学 中国农业大学 萨能奶山羊饲料蛋白质、总脂肪、中性洗涤纤维、酸性洗涤纤维及排泄物总氮、总脂肪、中性洗涤纤维、酸性洗涤纤维含量的检测
检测样品
饲料
检测项目
营养成分
关联设备
共6种
下载方案
方案详情文
西南民族大学教育部青藏高原动物遗传资源储备与利用重点实验室
中国农业大学原乳质量与安全控制北京工程技术研究中心动物营养国家重点实验室
萨能奶山羊饲料蛋白质、总脂肪、中性洗涤纤维、酸性洗涤纤维及排泄物总氮、总脂肪、中性洗涤纤维、酸性洗涤纤维含量的检测
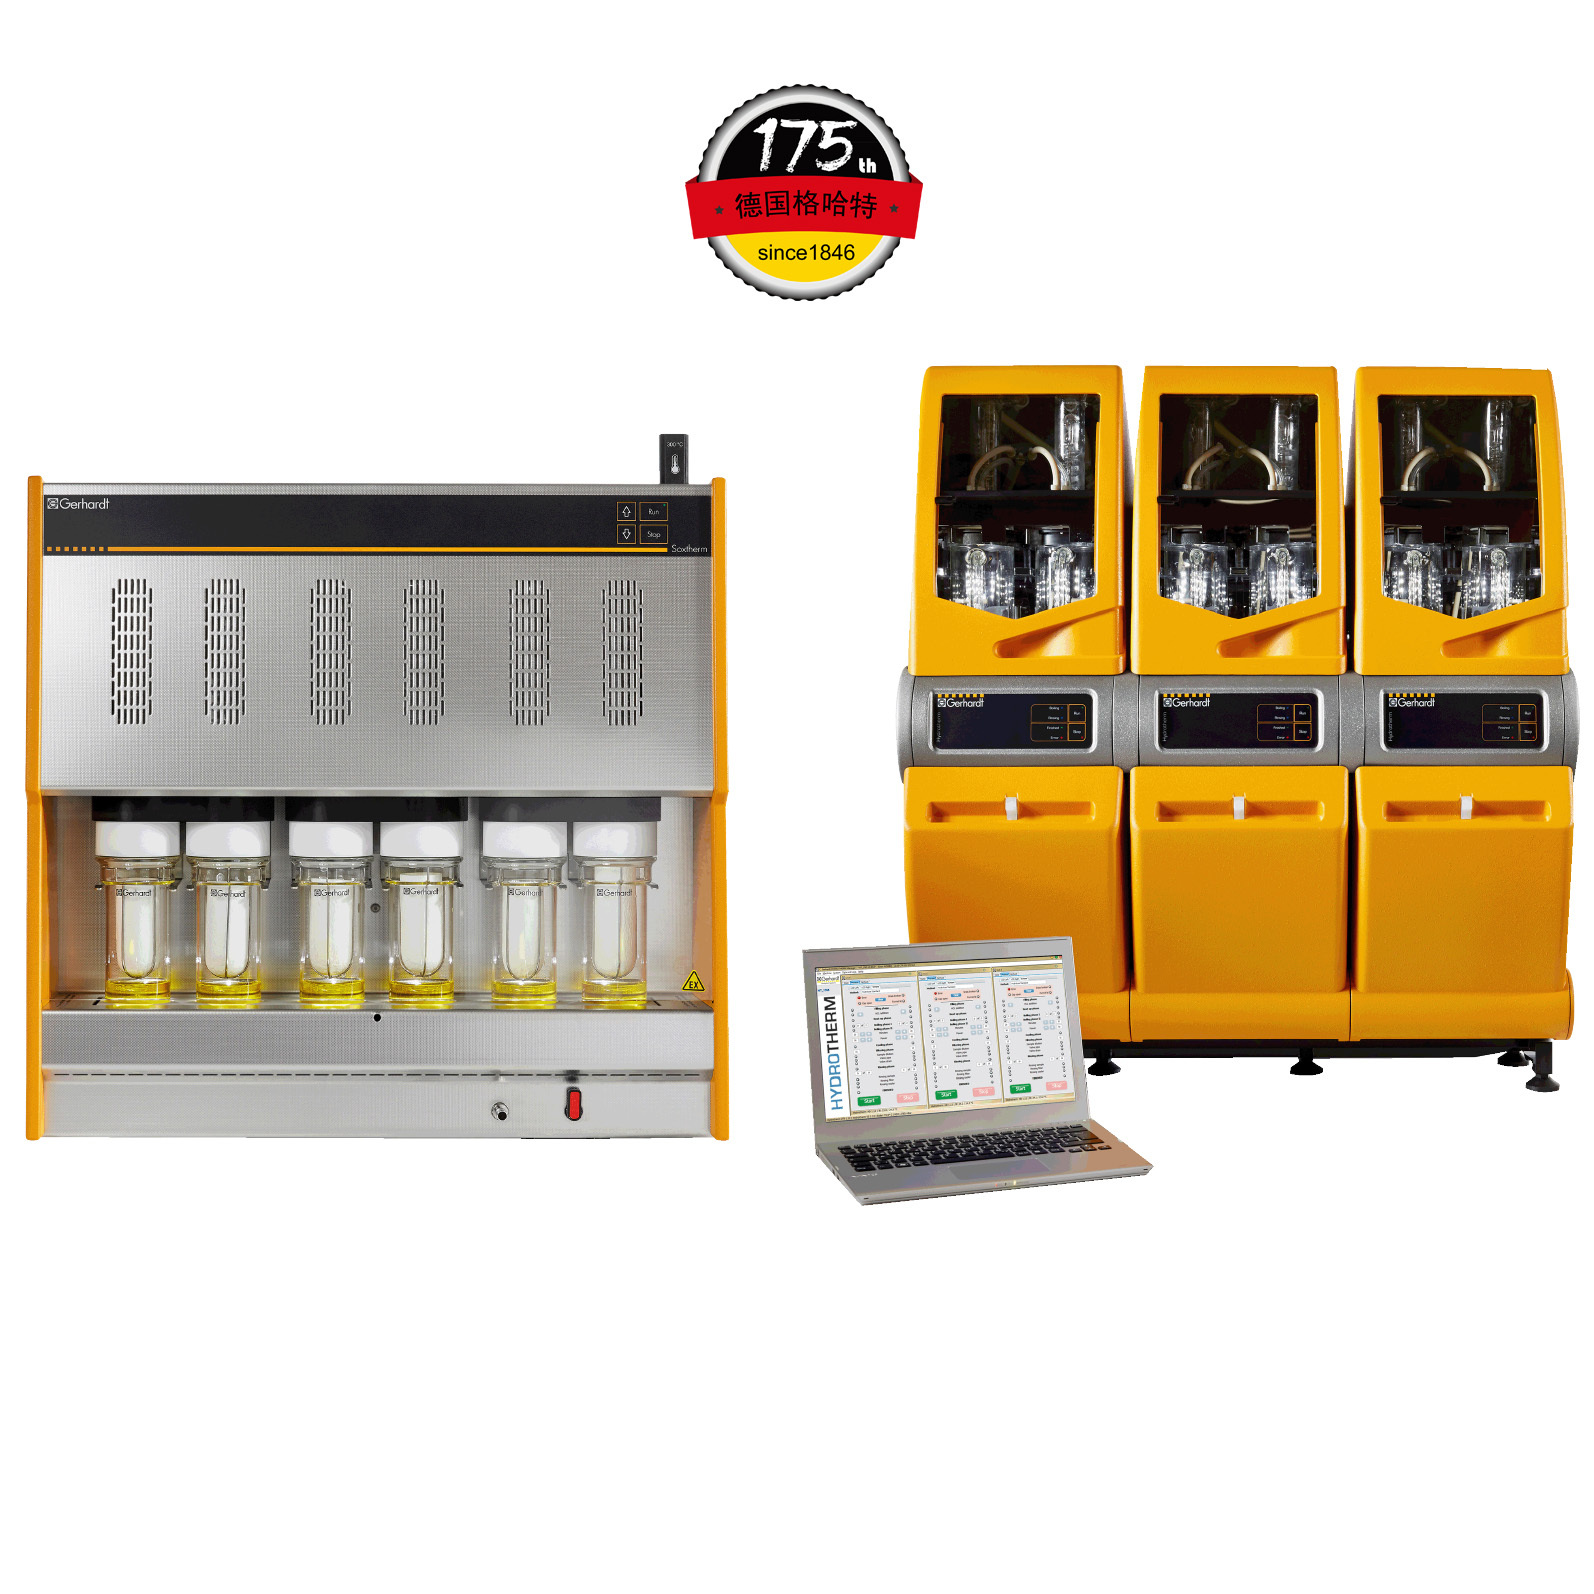
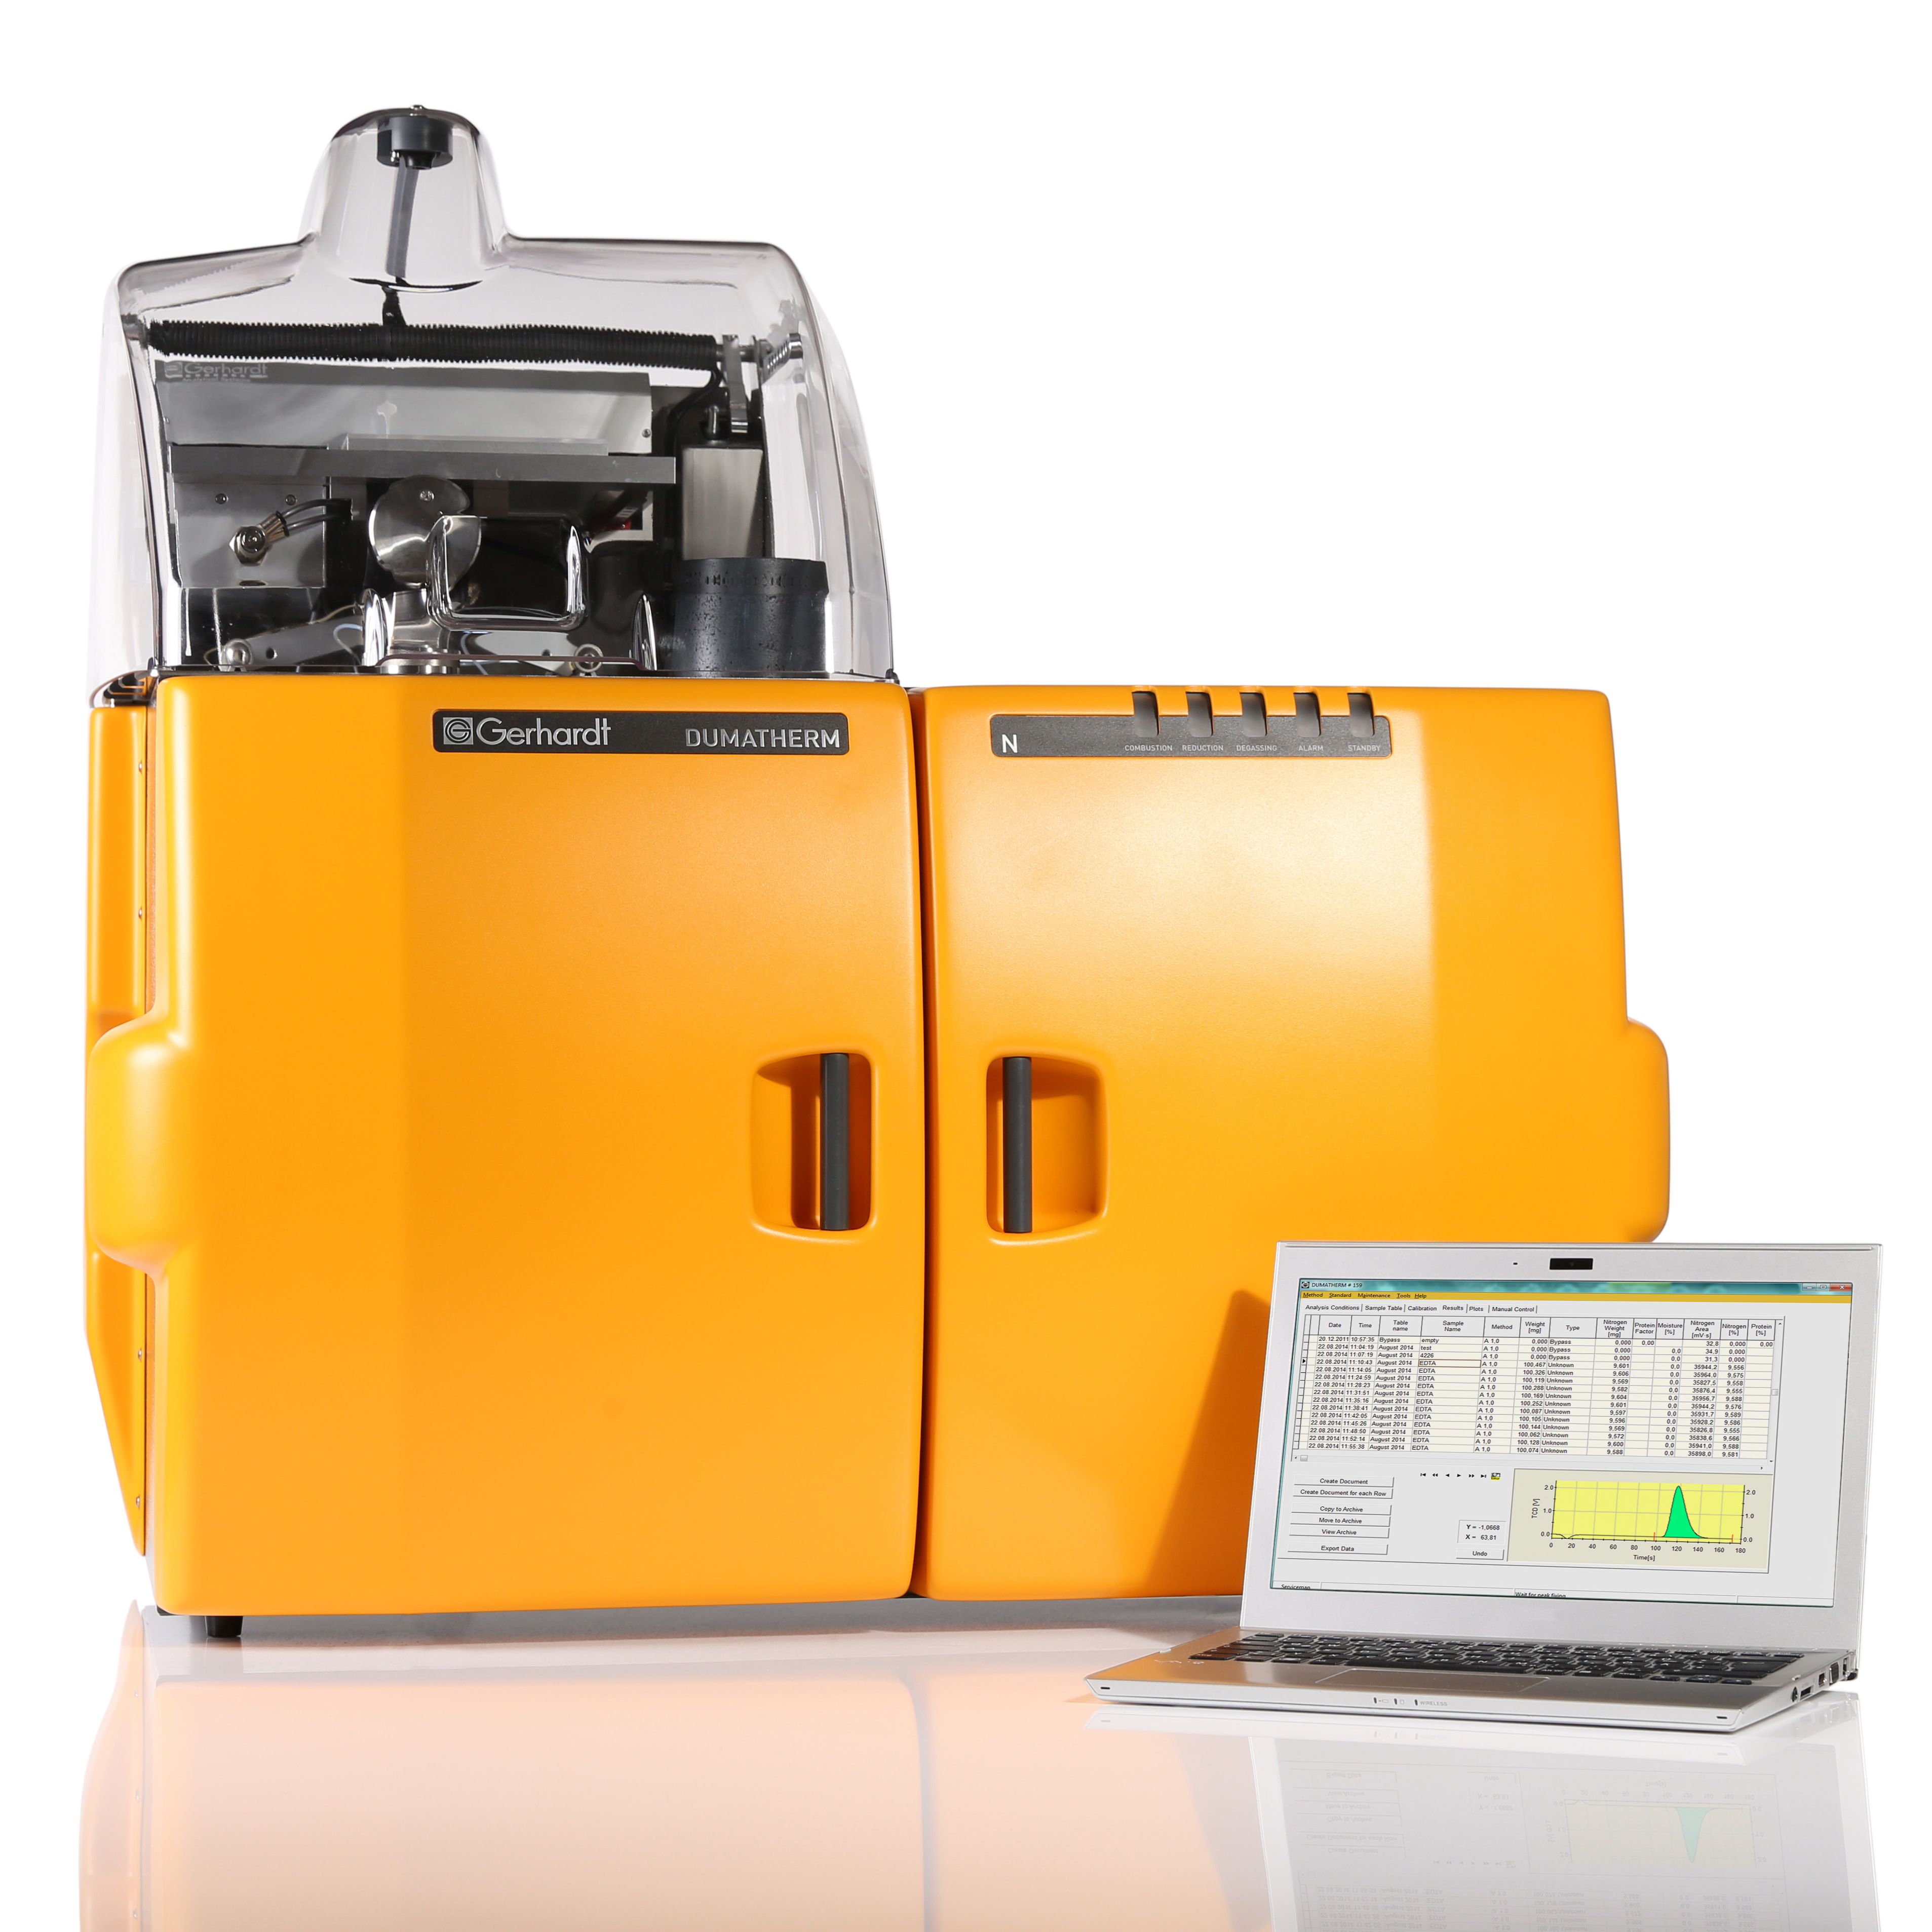
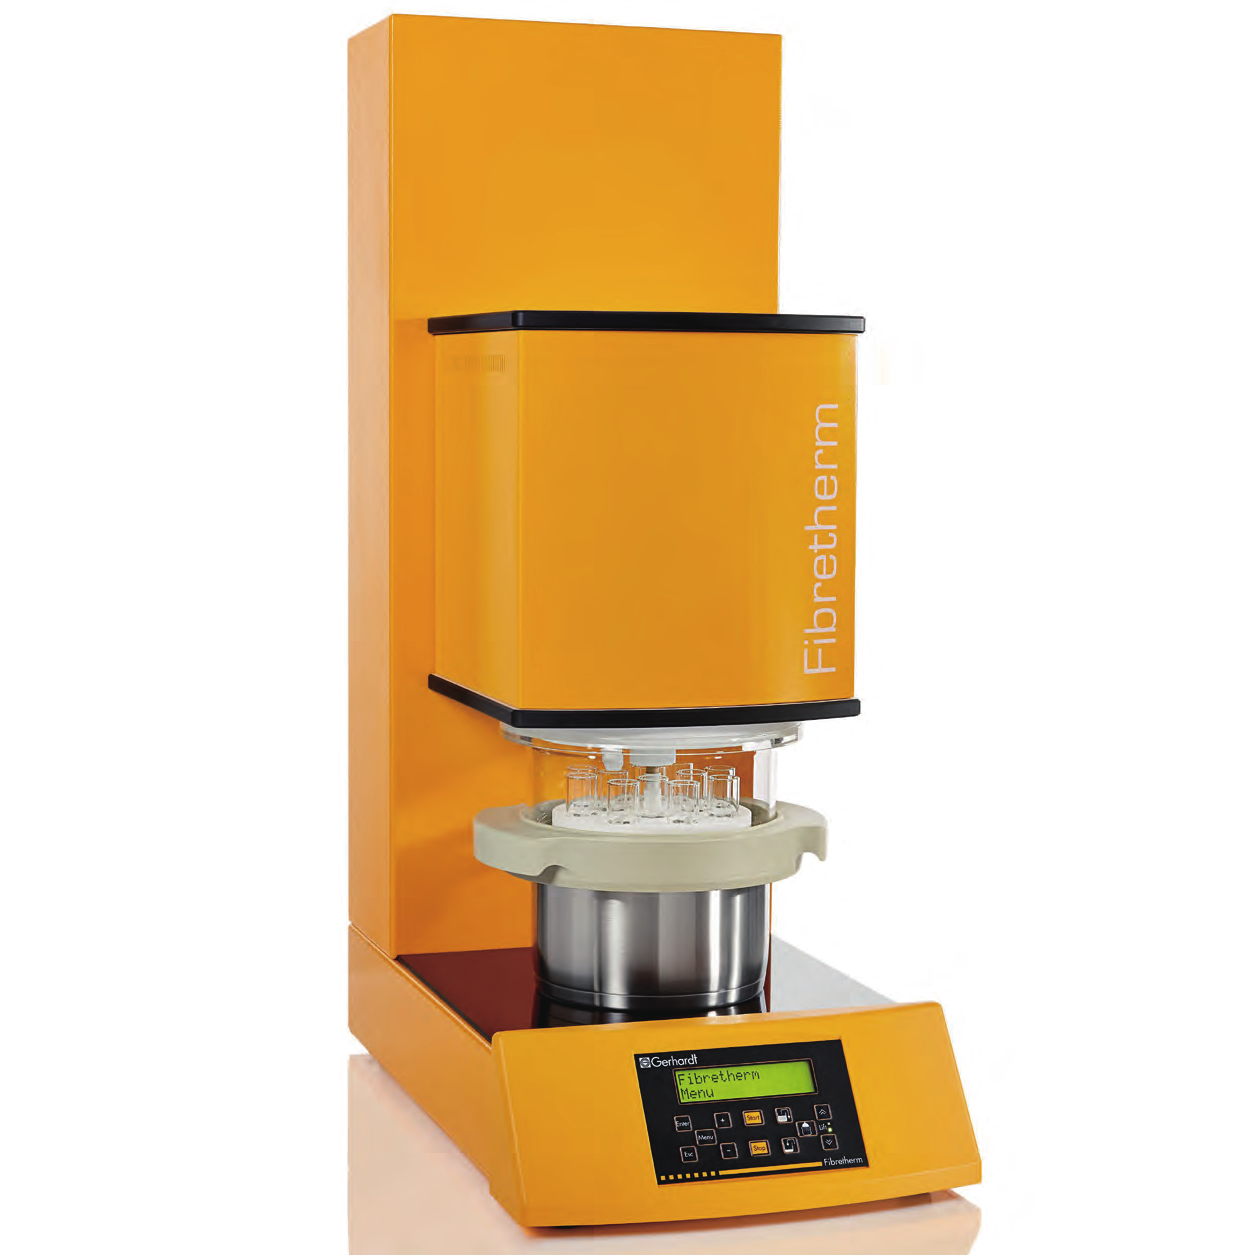
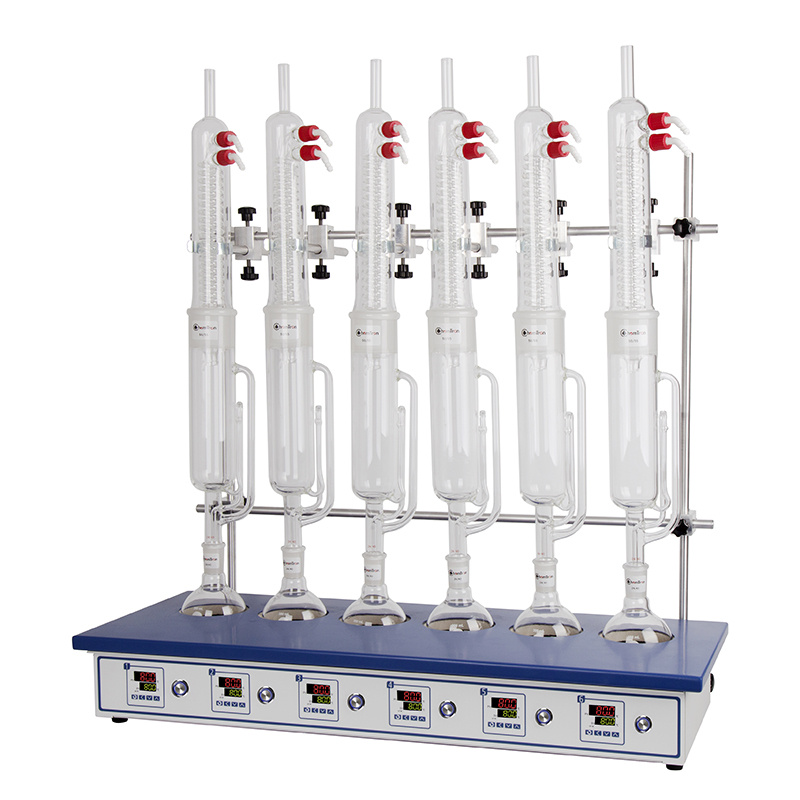
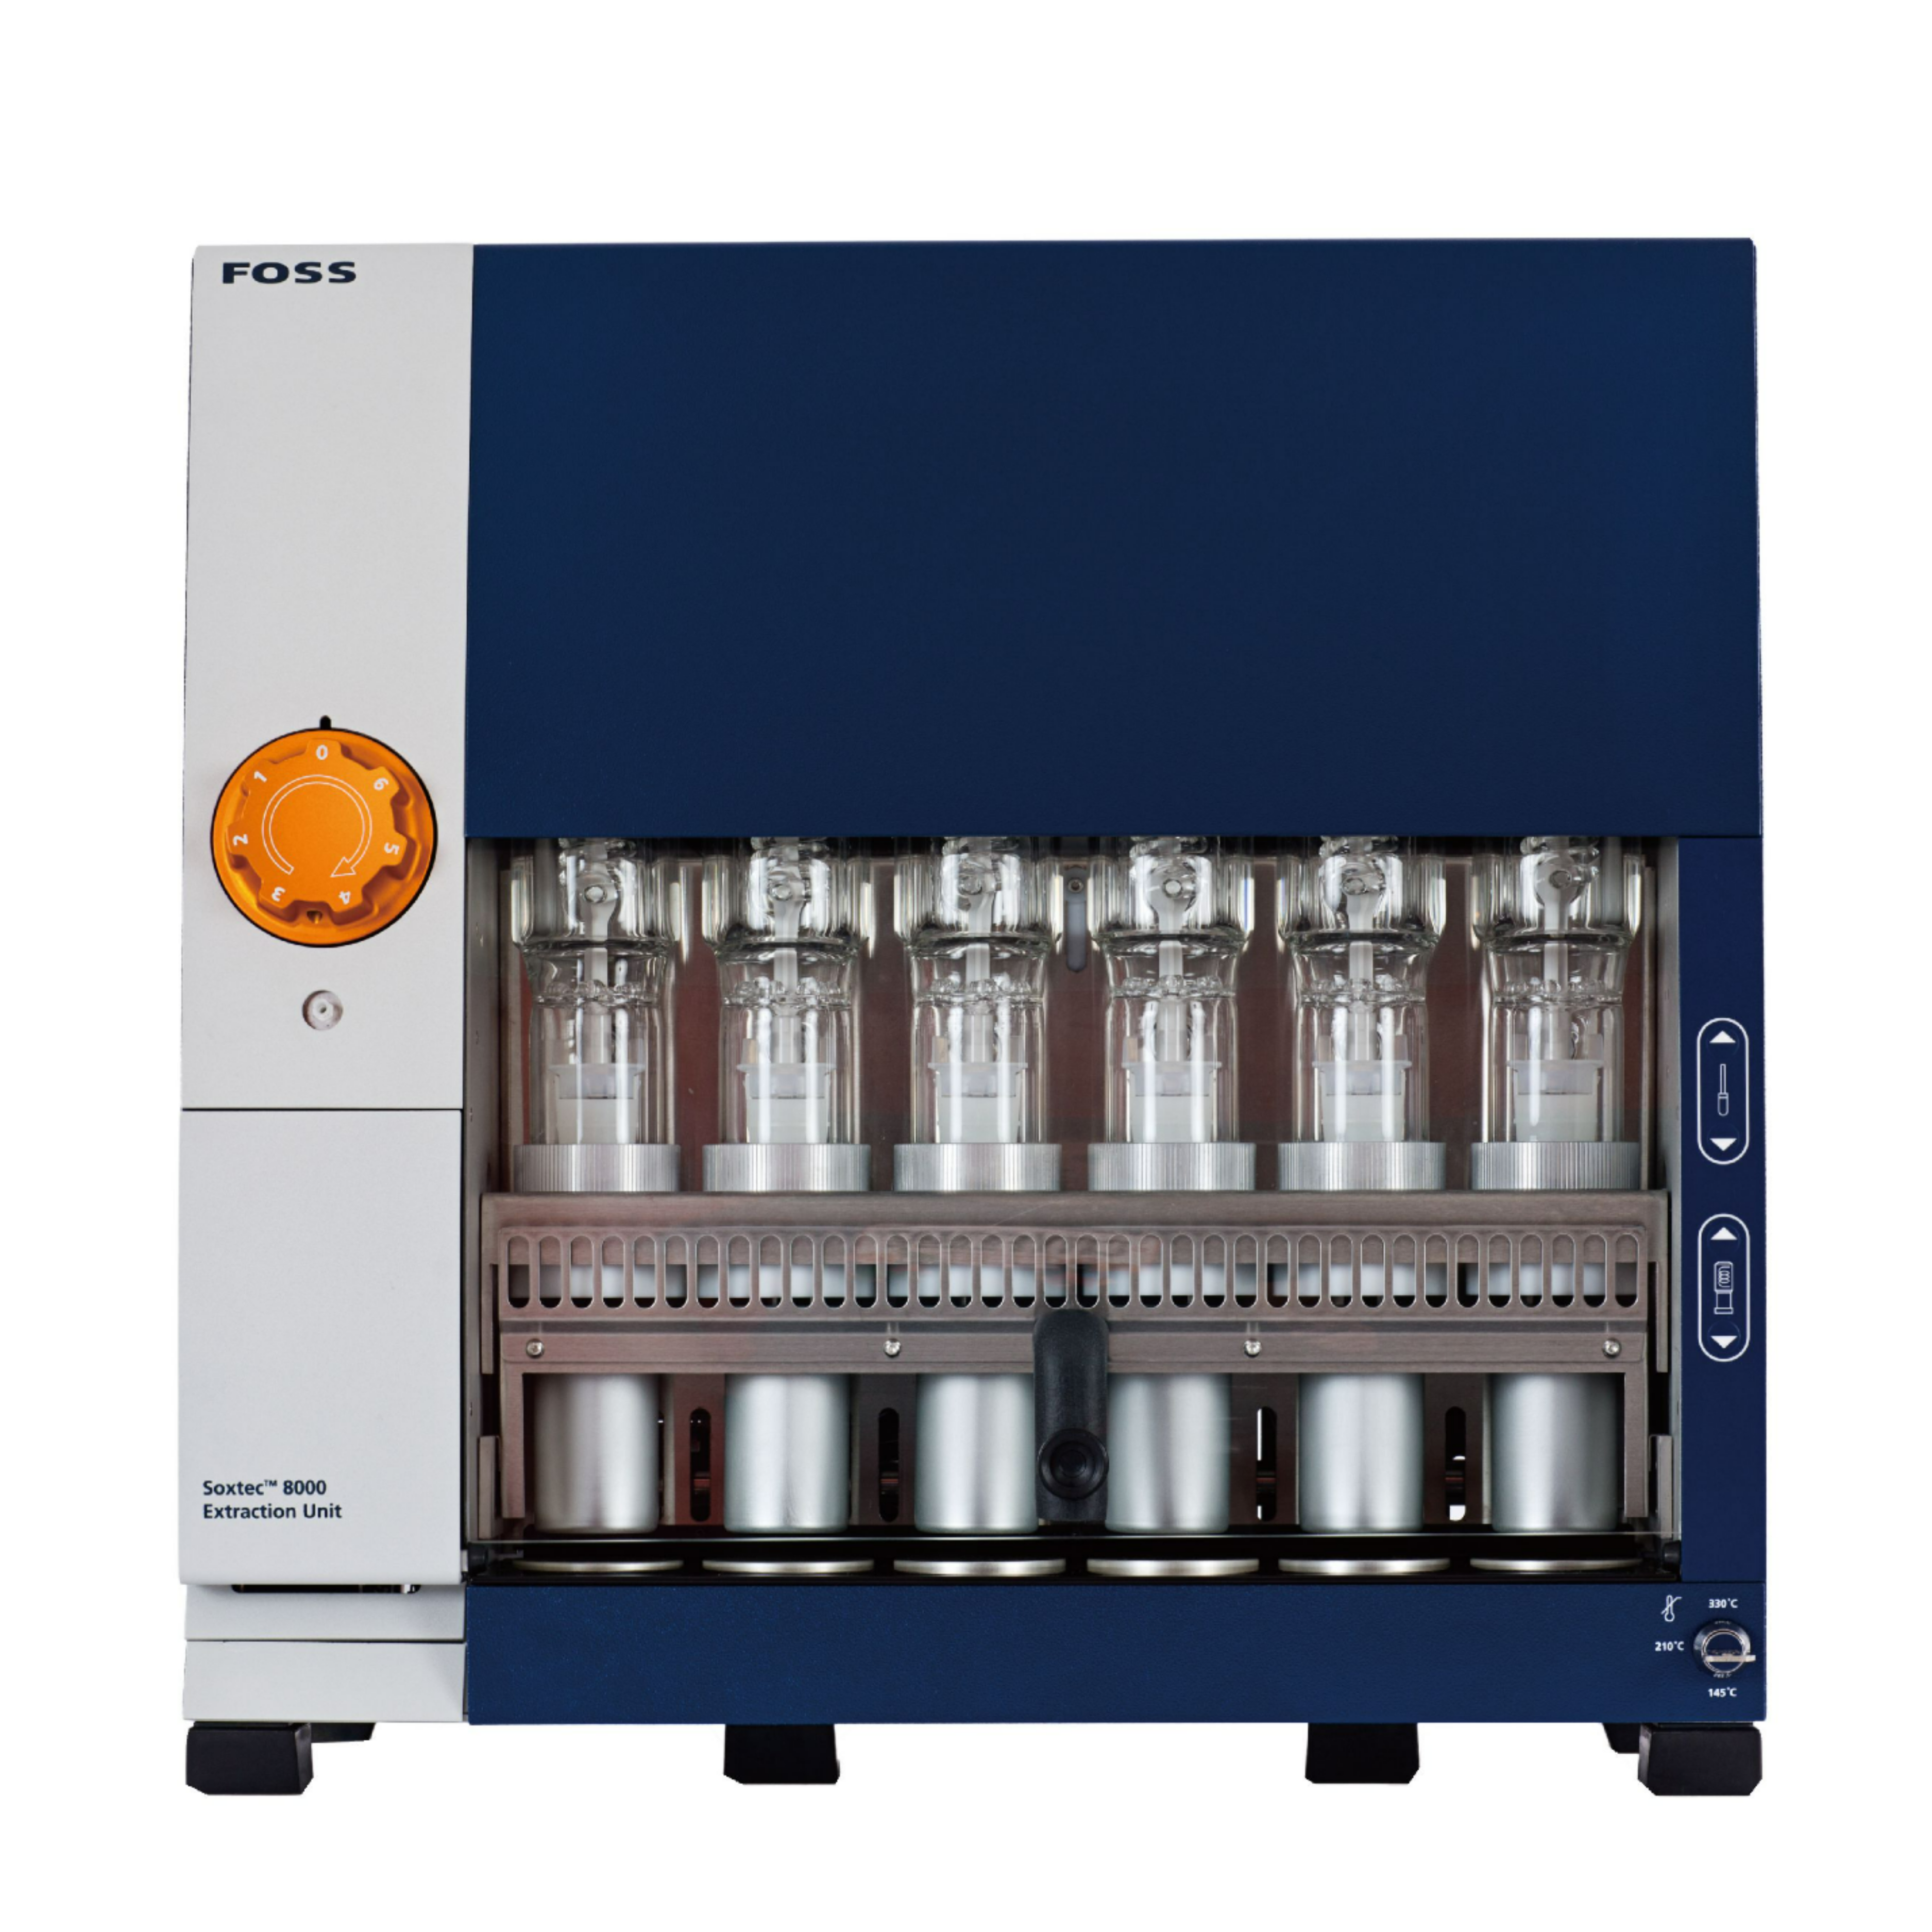
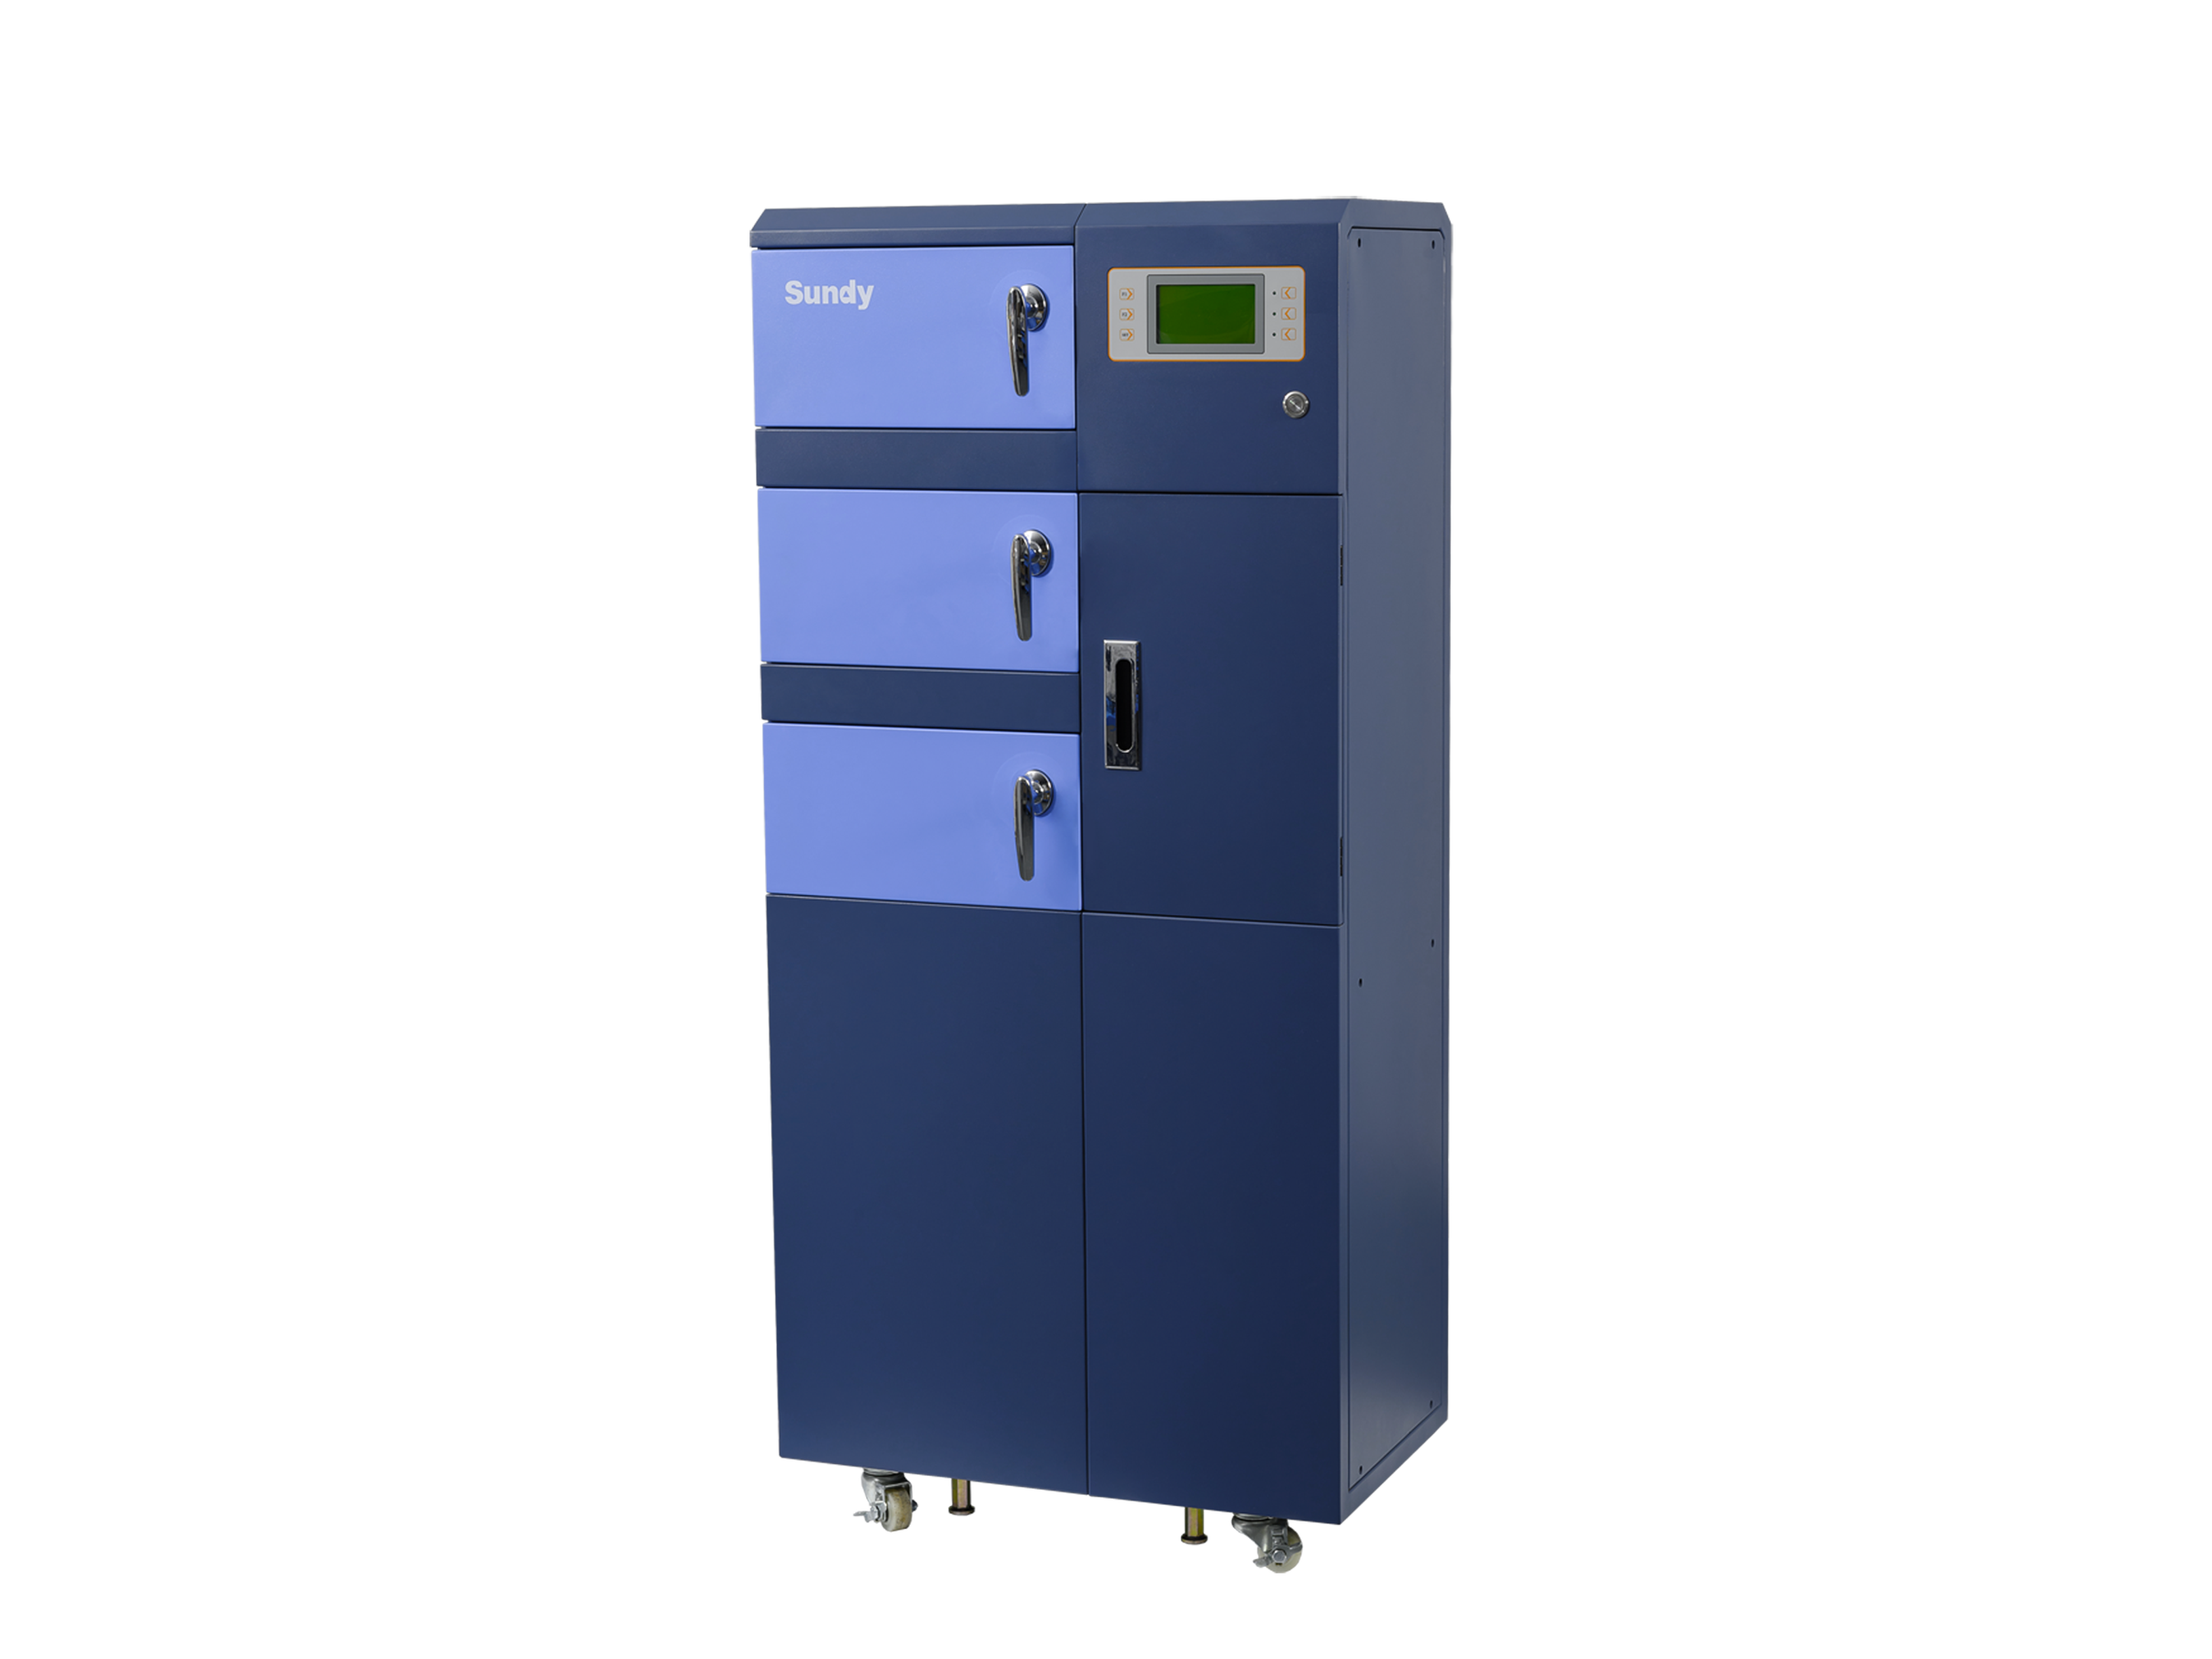
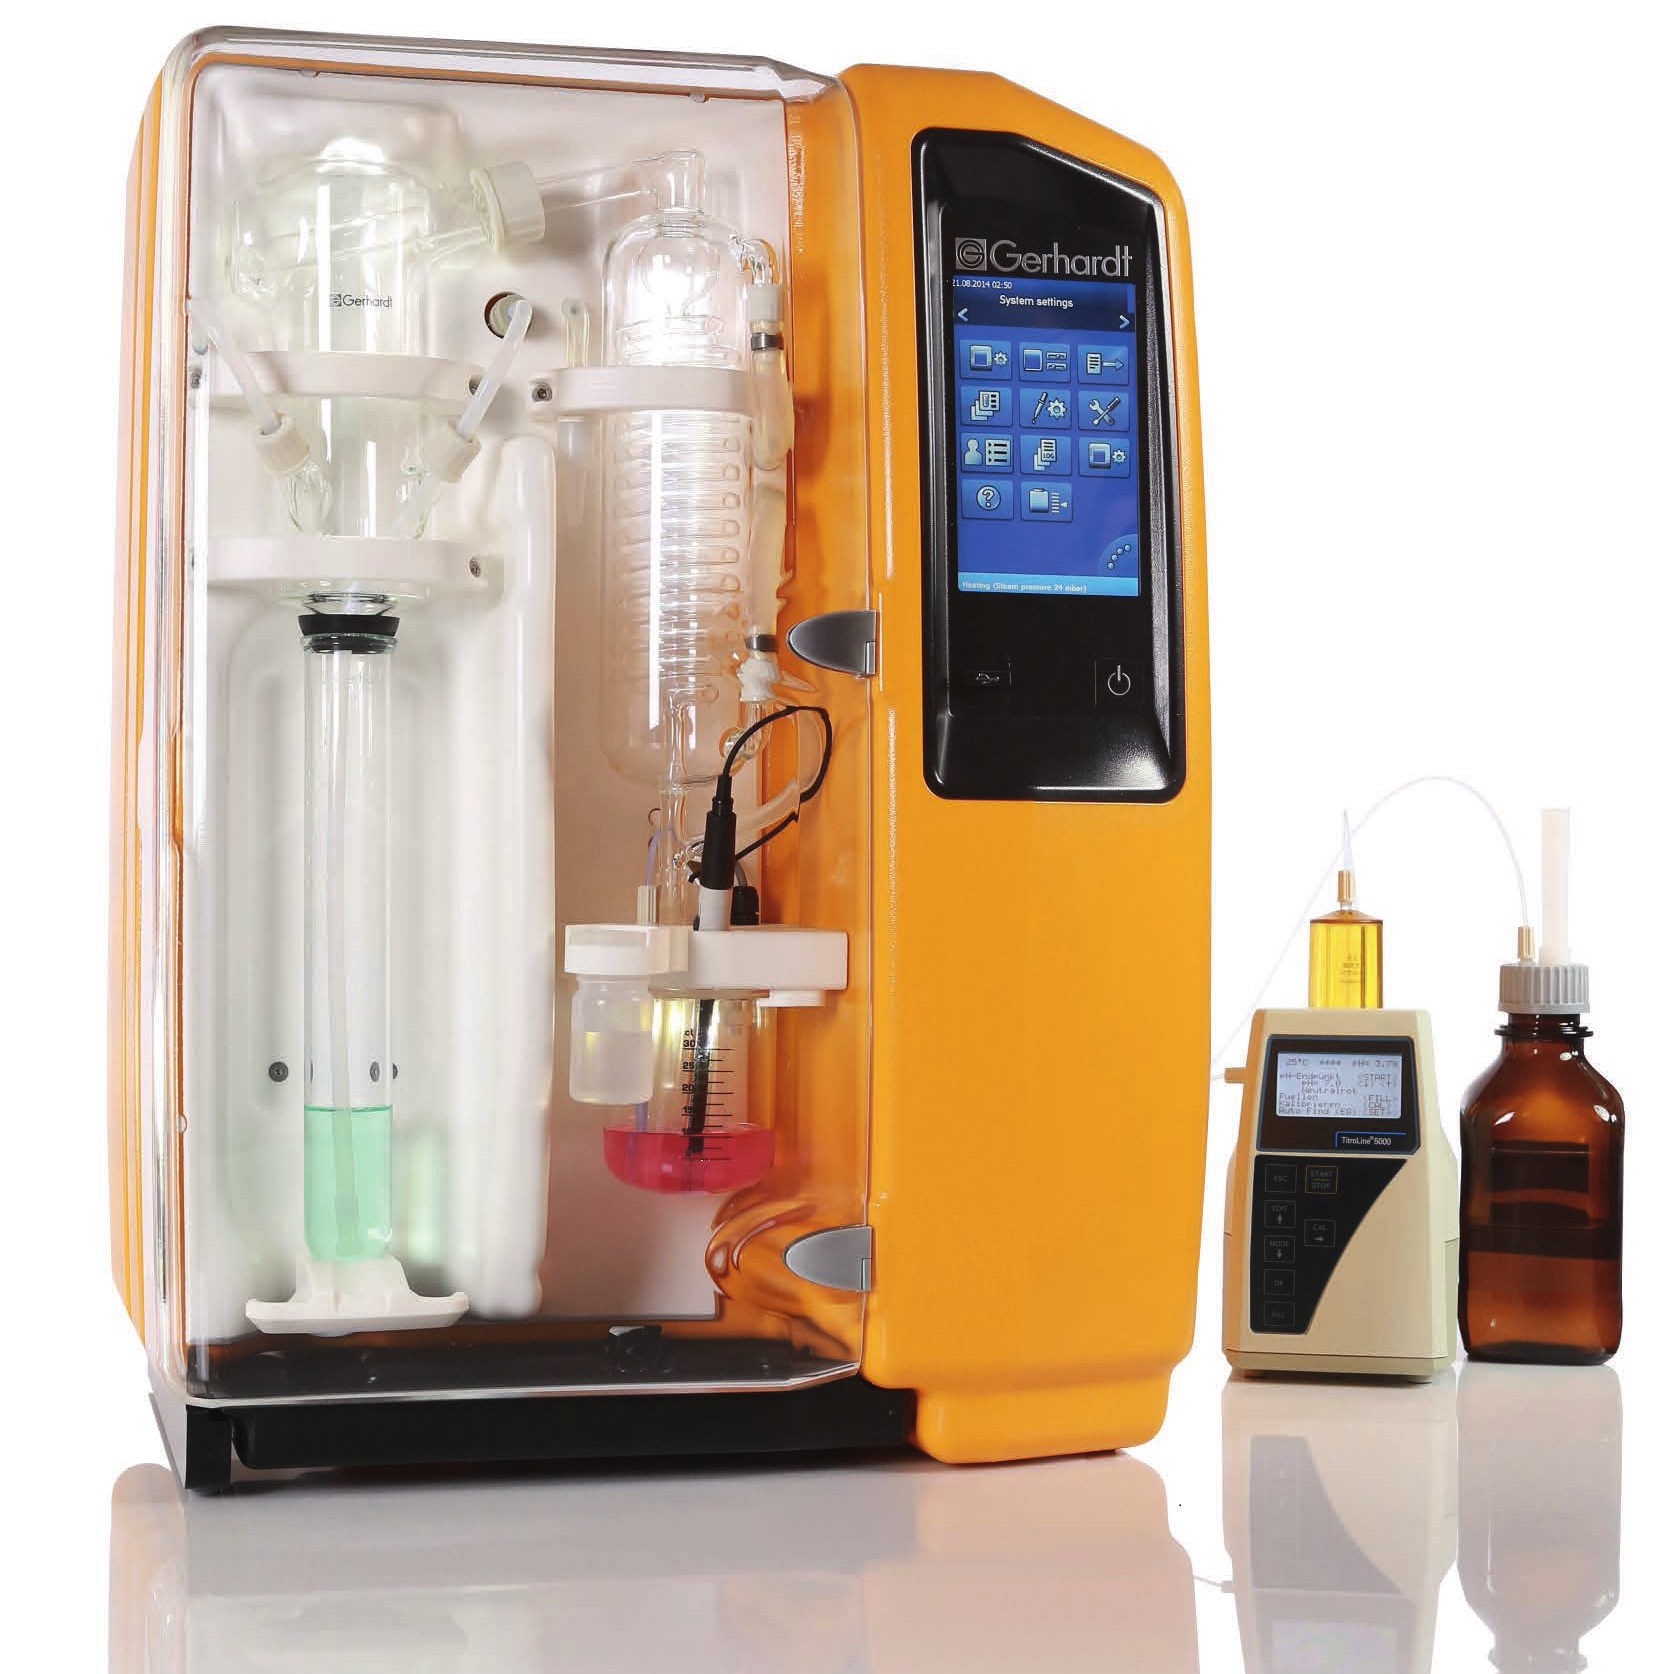
Feed and feces samples. Total nitrogen and ether extract were determined using the Dumatherm DT Dumas nitrogen analyzer and Soxhlet Extractor SOX 416 (Gerhardt), respectively. Neutral detergent fiber and ADF were analyzed by Fibertherm FT12 Fiber Analyzer (Gerhardt).
智能文字提取功能测试中
西南民族大学教育部青藏高原动物遗传资源储备与利用重点实验室中国农业大学原乳质量与安全控制北京工程技术研究中心动物营养国家重点实验室萨能奶山羊饲料蛋白质、总脂肪、中性洗涤纤维、酸性洗涤纤维及排泄物总氮、总脂肪、中性洗涤纤维、酸性洗涤纤维含量的检测Feed and feces samples . Total nitrogen and ether extract were determined using the Dumatherm DT Dumas nitrogen analyzer and Soxhlet Extractor SOX 416 (Gerhardt), respectively. Neutral detergent fiber and ADF were analyzed by Fibertherm FT12 Fiber Analyzer (Gerhardt).ARTICLE IN PRESSShi et al.: AFLATOXIN-INDUCED PLASMA METABOLOMIC CHANGES Shi et al.: AFLATOXIN-INDUCED PLASMA METABOLOMIC CHANGES 不同剂量黄曲霉毒素B1对萨能奶山羊的生长性能、消化率和血浆代谢组学的影响 J. Da i r y Sc i . 105 htt p s ://d o i .o rg /10.3168/jds.2022-22129 ◎ 2022, The Authors. Published by Elsevier Inc. and Fass Inc. on behalf of the American Dairy Science Association .This is an open access article under the CC BY license (http://creativecommons.org/licenses/by/4.0/). Growth performance, digestibil i ty, and plasma metabolomic profile s of Saanen goats exposed to differe n t doses of aflatoxin B 西南民族大学教育部青藏高原动物遗传资源储备 与利用重点实验室 Haitao Shi ,* Jing Peng, Jingjing Hao, Xi Wang, Meng Xu, and Shengli Li? 'Key Laboratory of Qinghai-Tibetan Plateau Animal Genetic Resource Reservation and Utilization, Ministry of Education, Southwest Minzu University, Chengdu, Sichuan, 610041, China State Key Laboratory of Animal Nutr it ion, Beijing Engineering Technology Research Center of Raw Milk Quality and Safety Control , China Agricultural University, Beijing 100193, China 中国农业大学原乳质量与安全控制北京工程技术研究中心动物营养国家重点实验室 Aflatoxin contamination of feed poses a great risk to the global dairy industry. Analyzing the aflatoxin B (AFB_)-induced metabonomic changes in ruminants and screening potent i al biomarkers for early diagnosis of AFB exposure is urgently needed. Here, the effects of different doses (0, 50, and 500 pg/kg of the diet,dry matter basis) of AFB exposure on digestibility and performance of Saa n en goats were studied, and a comprehensive untargeted metabolomic analysis Was performed to revealplasma metabonomic cchanges caused by the AFB exposure. In the current study,AFBi exposure decreased total-tract nutrient digest-ibilit i es, nitrogen retention, total weight gain, and average daily gain of Saanen goats in a dose-dependent manner. Untargeted metabolomics revealed alterations in the plasma metabolome. A total of 3,310 and 1,462ion peaks were obtained in positive and negative ion modes, respectively. Based on the screening criteria,1,338 differential metabolites were detected between control and low-dose AFB (50 pg/kg) groups, 1,358metabolites dif f ered between control and high-dose AFB1 (500 pg/kg))groups, and 58 metabolites di f -fered among al l groups. Pathway analyses showed that choline metabolism in cancer and glycerophospholipid metabolism were significantly affected by the AFB treatments.Moreover, dysregulation of amino acid metabolism was also observed in AFB treated goats.The findings provided novel insights into the toxicity of AFB in ruminants. Exploring the underlying molecu-lar causes of the changes may help the development of rapid diagnostic techniques and effective interventions for AFB intoxication. Rec e iv e d April 6,2022. Accepted July 22, 2022. *Corresponding a uthor: shi h aitao @swun.edu.cn or shih a itao010@163.com K ey words: afla at to ox x i i n ns s ,, untargeted1metabolomics.biomarker , ruminant aflatoxicosis IN TROD U C T ION M ycotoxins are toxic metabol i tes mainly produced by certain types of molds f rom Fusarium,Claviceps,Penic i llium, Alternaria, and Aspergillus S genera (Shi et al., 2018). Among all the ident i f ied mycotoxins, af-latoxins could be the most documented group due to their high toxic i ty and contamination rates. Afl a toxi n s are produced primarily b y Aspergillus section Flavi (Blankson and Mill-Robertson, 2016). Aflatoxin B (AFB) has been considered as the most carcinogenic and prevalent member, and it can be biotransformed into aflatoxin M via oxidative reactions, catalyzed by hepatic cytochrome P450 enzymes (Marin et al., 2013;Giovati et al., 2015). Aflatoxin M has a high transfer rate to animal products, especially milk (Giovat i et al.,2015). Af la toxin B is very stable and, so far, the commonly used processing methods (e.g., cooking, baking, extru-sion, and roast i ng) are una b le to completely eliminate i t (Marin et al., 2013; Adebo et al., 2017). Previous stud-ies showed t h at ingestion of AFBi-contaminated feed c CO o U uld decrease performance, impair liver function, and i n crease disease susceptibility in cows and goats (Fink-Gremmels, 2008; Battacone et al., 2012; Elgioushy et al., 2020). However , information on afla t oxins in rumi-nants is st i ll limited (Elgioushy et a l ., 2020). Up to now,most studies on AFB toxicity were conduc t ed on small laboratory animals such as rats or established cel l lines,partly because puri f ied and standard AFB is very ex-p ensive , the digest i ve systems of ruminants are more complicated, and they usually have greater feed intakes t han laboratory animals (Zhang et al., 2011; Rotimi et al ., 2017; Wang et al, 2021). Consequently, available 11S studies on aflatoxicosis in production animals usually chose naturally contaminated feeds as AFB sources.However, t h ese feeds may contain various mycotoxi n s because mycotoxin co-contamination is very common in feeds (Shi et al.,2018). The coexistence of multiple toxins in feeds could further complicate the treatment effects and make it difficult to identify the specific e f-fects caused by AFB1· At present , it is difficult to evaluate the global effects of aflatoxicosis in ruminants. The symptoms of aflatoxi-cosis are sometimes similar to many ot h er better-known ailments (Ogunade et al., 2018). Th u s, investigat i ng the plasma metabolome alterations of AFB -challenged ruminants may provide new insights into the toxicity of AFB and benefit the development of new mitigation strategies for aflatoxicosis. Untargeted metabolomics aim to examine changes in metabolite profiles between control and experimental groups, which can detect metabolomic alterations and screen potential markers for disease diagnosis (Luo et al., 2019). In this st u dy, the untargeted metabolomics technique, based on ultra -HPLC combined with quad-rupole time-of-f l ight MS, was applied to investigate the p lasma m etabolomic profiles and identify potential new biomarkers of Saanen goats challenged with di f ferent doses of purified standard AFB . The effect of AFB exposure on performance, nut r ient digestion, and nitro-gen metabolism was also evaluated. MATERIALS AND METHODS Animal and Exp e rimental D e sign The procedure for animal care and handling was ap-proved by the Institutional Animal Care and Use Com-mittee, Southwest Minzu University (Chengdu, Sich-uan, China ), and the s t udy compl i ed with the Guide for the Care and Use of Agricultural Animals in Research and Teaching (FASS, 2010). Eighteen healthy half-sib male Saanen goats wi t h similar BW ((31.78±1.81kg) and body condition,aged 6 mo, were selected as experimenta l animals. The experiment was conducted in a completed randomized design with 3 treatments and 6 replications repetitions.Before the experiment started, all goats were treated with ivermectin to prevent and control the parasites,and acclimated to the experimental fac i lity and diet for 14 d. All goats were individually housed i n 2-m p ens that were protected from wind and rai n with free access to fresh water . Afterward, the goats were ran-domly assigned to 1 of the 3 t r eatments and subjected t o a s h ort -term AFB treatment protocol (Reed et al.,2018). The treatments were (1) control diet (CON;b asal diet ), (2) low-dose AFB diet (LD; oral dose of 50 g/kg die t DM), and (3) high-dose AFB diet (HD;oral dose of 500 pg/kg diet DM). For the 2 AFB treat-ments, the AFB challenge was beginni n g on d 15 and cont i nued for 14 d. T h e experimental diet (Table 1) was Tab l e 1. Ingredients and chemical c ompo s i tion of the diet (DM ba s is) Ingredient Chemical % of DM composition % of DM Corn grain 27.0 CP 15.8 Soybean meal 6.00 Ether extract 2.7 Soybean hulls 9.30 OM 90.6 Cottonseed meal 3.00 NFC 29.5 DDGS 1.20 NDF 42.7 Molasses 1.20 ADF 23.2 Corn cob 8.40 Hemicellulose 19.5 Oat hay 16.0 Ca 1.33 Alfalfa hay 24.0 P 0.35 Premix* 3.90 Total 100 Expressed a s % o f DM unless otherwise st a t e d. NFC =100- CP - a sh -NDF - ether extract . DDGS = dist i l l er s dried grains w i th solubles. 4Premix contained: C a = 15 to 18%; P (minimum)=8%; Mg (mini -mum) = 0.75%; NaCl = 27 t o 33%; Cu = 2,500 to 2,700 mg/kg ; Se (minimum) = 50 mg/kg; Zn (minimum), 4,000 mg/kg, K (minimum),0.1%; v i t a min A (minimum)= 660,000 IU/kg ; v i t a min D: (minimum)=66,000 IU /kg; vitamin E (minimum) = 4,000 IU/kg . formulated and provided to meet the nutrition require-ments of goats (NRC,2007). To minimize the interference of aflatoxins that al-ready existed in the diet , all feedst u ffs were free of mold contamination and screened for aflatoxins using the AgraQuant aflatoxins test Kit (Romer Labs), and the aflatoxins level in selected feedstuffs were below detec-t i on limits (<3 ppb). The amount of diet supplied was adjusted based on the real capability of consumption of t he animals to control the orts. Aflatoxin B standard was purchased from Pr i bolab Co., Ltd . and dissolved in methanol to prepare the concentration of 2 and 0.2 mg/mL as stock solutions that were stored in a refrigerator at 4℃ (Cheng et al.,2017). The diet was provided twice daily (0630 a nd 1830 h). During the experimental period, the calculated amounts of AFB solutions were prepared, mixed with 200 g of TMR, and provided to the low-dose and hi 工1gh-dose groups before morning feeding. In the meantime,t he CON group received similar quantities of methanol .To guarantee the correct ingestion of AFB, the re-maining quantity of the diet for each goat was provided only when it had consumed all the pre-weighed 200 g of TMR. Al l goat s were weighted weekly at 0600 h before morni n g feeding and the ADG was calculated. The carcass study was conducted on d 29 and al l goats were killed at the slaughterhouse using standard commercial p rocedures. Slaughte r live weight was recorded immedi-ately before slaughter. The tai l , kidneys, pelvic fat , a n d testes were retained in the carcass, and the HCW was recorded immediately after sla u ghter. Blood S a mple Colle c tion and An a lyses Whole blood samples were col l ected aseptically from t h e left jugular vein of all goats after 3 h of morning feeding on d 14, 21, and 28 for the analyses of blood count analyses, and plasma samples were simultane-ously processed using 10-mL vacutainer tubes contain-ing EDTA as an anticoagul a nt . Complete blood count analyses were performed on a fully automated hematol-ogy analyzer (Mindray BC-1800). After centrifugation at 1,100 × g for 15 min at 4C, the plasma was ke p t frozen at -20℃ or -80℃ unti l further analyses. Untargeted plasma metabolomics analyses were per-formed on the plasma samples collected at d 28 by Bio-marker Tech using Waters Xevo G2-XS Q-TOF mass spectrometer (Waters) coupled to an I-class Waters Ac-quity ultra-HPLC system. The mass spectrometer was equipped with an dW electrospray ionization source, and both positive and negative ion modes were performed. In brief, the plasma sample was thawed at 4℃, and a 100-p.L aliquot was taken from each sample and transferred into 500 pL of a pre-cooled methanol/acetonitrile solution (1:1, vol/vol). After vortex mix-ing and centrifuging (12,000 × g, 4℃) for 15 min, the supernatant was gathered and dried in a vacuum con-centrator. Aqueous acetonitrile (acetonitrile: water =1:1, vol/vol) was used to dissolve the dried supernatant,and vortex mixing and centrifuging (12,000 × g,4℃)was performed to collect the resulted supernatant for further analyses. Chromatographic separation was con-ducted on an Acquity UPLC HSS T3 column (1.8 pm,2.1×100 mm; Waters Corp.). The MassLynx 4.2 soft-ware (Waters) was used for controlling the acquisition of the mass data . In each data acquisition cycle , data were taken at both low and high col l ision energies. The quality control sample was prepared by mixing equal amounts of all samples and acetonitrile was used as a blank. The blank and quality control sample was first analyzed to monitor data qual i ty and system stabi l ity.A detailed description of the metabolomics analyses could be found i n a previously published study (Liu et al., 2020). Nutrient Digestibil i ty and Nitrogen Retent i on From d 25 to 28, the total feces and urine of each animal were collected. Urine was collected into buck-ets containing HCl (10%, vol/vol) to maintain the pH be l ow 3 and minimize nitrogen losses. The total feces and urine collected was weighed , mixed, and recorded daily (Shi et al., 2015). Aliquots urine (10%) and total fecal (20%) output were taken and stored at -20℃unt i l chemical analyses to determine the digestibi l ity and N retention. Nitrogen balances were calculated as the difference between the amount of N ingested and t hat lost in urine and feces. Chemical Analyses Feed and feces samples were ground using a Wiley mill with a 1-mm screen before analyses. AOAC In-ternational (2005) methods were used to analyze DM (method 934.01) a n d ash (method 942.05). Total ni-trogen and ether extract were determined using the Dumatherm DT Dumas nitrogen analyzer and Soxhlet Extractor 416 (G e rhardt), r espec ti vely.Neutral detergent hber and AD F were analyzed by Fibertherm FT12 Fiber Analyzer (Gerhardt). The content of hemi-cellulose, cellulose, total carbohydrate, and NFC was evaluated based on the NRC (2001). Dat a Processing and St a t istical Analy s es Plasma metabolomic raw data were collected by MassLynx 4.1 workstation and pretreated by the Pro-genesis QI software package for the extraction, align-ment , deconvolution, and normalization of peaks. The software was set to automatically search the selected databases such as Human Metabolome Database (http:///www.h mdb.ca/) and METLIN Metabolite Database (h ttps://m et l in.scripps.edu/) to identify the metabo-l i tes based on m/z , retention t i me, and fragment in-formation. After being recognized and aligned , all data were normalized to the sum total ion intensity per chro-matogram (Peng et al., 2022). Then, the data sets, in-cluding peak number (retention time-m/z pair), sample name, and normalized ion intensities, were imported into MetaboAnalyst 4.0 (h t tps://www.metaboanalyst .ca ) to complete data preprocessing, including missing d a ta estimation, median centering, and unit variance scaling. The detailed workflow for data preprocessing and metabolites identi f ication was available in previous studies (Liu et al., 2020; Peng et al., 2022). The multivariate statistical analyses were performed On the BMKCloud platform (www.bioc l oud.net ).Principal components analysis and orthogonal partial leas t-squares discriminant analysis (OPLS-DA) were employed to visualize differences in metabol i te profiles among samples. The adjusted P-value (false discovery rate) cutoff was set as 0.05 before the principal com-ponents analysis and OPLS-DA analysis. Differential metabolites were selected accordi n g to the following 3conditions: minimum fold change (FC) > 1, P-value <0.05 in single-dimensional statistical analysis, andvaria b le importance value (VIP) > 1 in the OPLS-DA Table 2. Apparent digestibility (%) of nutrient s in goat s fed the experiment a l diets AFB P-value Item 0 50 500 SEM L Q DM 74.0 71.5 71.3 0.71 0.031 0.088 0.033 Ether extract 67.8 66.3 62.8 0.78 0.001 <0.001 0.383 CP 75.2 72.7 70.9 1.22 0.075 0.048 0.235 OM 72.2 69.5 69.0 0.78 0.025 0.048 0.043 NDF 60.9 57.7 55.3 1.23 0.019 0.013 0.130 ADF 58.9 55.6 51.6 1.44 0.009 0.004 0.201 Hemicellulose 63.3 60.2 59.6 1.28 0.125 0.156 0.131 Zero = control diet without a f l atoxin B (AFB ); 50= 50 pg/kg AFBi per kg of diet a ry D M; 500 = 500 p g/kg AFBi pe r kg o f diet a ry DM; n= 6 a nimal s /treatment . model (Peng et al., 2022). Moreover, a permutation test was conducted to evaluate the quality of the OPLS-DA models. The goodness-of-fit was represented by R'Y,and the predictive ability was indicated by Q. The differential metabolites were further annotated to Kyoto Encyclopedia of Genes and Genomes (KEGG)pathways by the KEGG PATHWAY data b ase (h ttp://www.kegg.jp/kegg/pathway.html ). Furthermore.Met ab oAnalyst 4.0 was also used to perform receiver operating characteristic (ROC) analysis based on the identified differential metabolites and the ROC curves were constructed by Random forest algorithms (Liu etal., 2020). The effects of AFB on apparent digestibility, ni-trogen metabolism, growth performance, and blood cell counts were analyzed using one-way ANOVA by generalized linear model procedure in SAS 9.4 software (SAS Institute Inc.). The statistical model for analys i s was yi j=以+Ti+ e, where yi is the observation, u is the overall mean, T is the effects of AFB1 doses (low and high), and e is the random error. Duncan’s test was used for multiple comparisons if the major effect is significant at a 0.05 level. Orthogonal polynomial contrasts were performed to determine linear and qua-dratic effects of treatments on the responses analyzed.Signi f icant differences were declared at P ≤0.05, and trends were reported at 0.05 0.05). Exposure to increasing levels of AFB linearly decreased (P=0.029)t he total weight gain and ADG of the animals. Blood Cell Count Parameters Complete blood ce l l count parameters are shown in Table 5. The levels of red blood cell count (RBC;P=0.028), hemoglobin (HGB; P=0.013), mean corpus-cular volume (MCV; P=0.005), and mean corpus-cular hemoglobin (P =0.045) were changed linearly with increasi n g AFB doses. No significant difference i n t he values of hematocrit, mean corpuscular hemoglobin concentration, and red cell distribution width index (RDW) were observed among groups. Metabol i te Profiling of Plasma Samples After checking the data i n tegri t y, a total number of 3,310 and 1,462 ion peaks were obtained in positive and negative ion modes, respectively. The supervised OPLS-DA A analysis s was constructed to visualize the alterations in metabolic profiles among the 3 groups (Supplemental Figure S1; h ttps://doi.org /10.6084/m9.f igshare.21194458.v2; Shi , 2022). The OPLS-DA mod-els revealed good separations (RY> 0.9,Q">0.4)among all groups except LD versus HD in negat i ve ion mode . Apparent di f ferences were observed in plasma metabolome among the treatments. The differences be-tween the CON and HD were more obvious than tha t between CON and LD. Different i al Metabolites and Their Ident i fication Based on the screening criteria , 1,307 (CON vs. LD),1,319 (CON vs. HD), and 506 (LD vs. HD) differential metabolites were detected in positive ion mode , respec-tively . However, only 31 (CON vs. LD), 39 (CON Vs.HD), and 6 (LD vs. HD) different i al metabol i tes were detected in the negative ion mode. As shown in Figure 1, 98.2% of the differed metaboli t es in the positive mode were upregulated in LD and HD groups when compared with the CON group. Among the differed metabolites,20 of them were only affected by the low-dose AFB (Supplemental Table S1; h ttps://doi.o r g/10.6084/m9.f igshare.21194458.v2; Shi, 2022), 17 metabolites were only affected by the high-dose AFB (Supplemental Ta-ble S2; h ttps://doi.o r g/10.6084/m9.f igshare.21194458.v2; Shi, 2022), and 58 metabolites were affected by both low- and high-dose AFB (S u pplemental Table S3;h t tps://doi .org/10.6084/m9.f igs h are.21194458.v2;Shi, 2022). Fold change of the metabolites was also calculated and included in Supplemental Tables S1-S3. The 95 metabolites can be categorized into 20 classes;specifically, glycerophospholipids, carboxylic acids and derivatives, and organonitrogen compounds were the 3l.cooo most abundant classes. The relative average normalized levels of those me t abolites were plotted in a heatmap created by the R package, pheatmap (Figure 2). The metabol i tes were clustered according to their Pearson correlationn coefficients.Obviou I s S 2alterationsin n tthe identified differential metabolites among groups can be observed in the heatmap. The area under the curve (AUC) of the ROC curves was calculated using the trapezoida l rule and the AUC values of the 95 metabolites (Supplemental Tables S1-S3) ranged from 0.81 to 1. Sh i et al.: AF L A T O X IN-IN D U CED P L AS MA M E T AB OL OM I C C HA NG E S Tab l e 5. Complete blood ce l l count s of goats f e d the exper i mental diet s AFB P-value” Item* 0 50 500 SEM L Q WBC (10/L) 11.5 12.9 14.0 0.84 0.141 0.085 0.312 RBC (102/L) 19.8 21.4 22.4 0.65 0.040 0.028 0.165 HGB (g/L) 103 108 113 2.22 0.028 0.013 0.275 Hematocrit (%) 33.7 33.4 33.6 1.05 0.972 0.981 0.814 MCV (fL) 14.6 14.6 16.6 0.49 0.017 0.005 0.861 MCH((pg) 5.12 5.03 4.70 0.14 0.122 0.045 0.830 MCHC (g/L) 330 315 310 8.84 0.302 0.232 0.322 RDW (%) 21.6 22.2 23.0 0.56 0.238 0.109 0.621 WBC= white blood ce l l count ; RBC = re d bl o od cel l count ; HGB=hemoglobin; MCV= mean corpuscular volume; MCH = mean corpuscular hemoglobin; MCHC = mean corpuscul a r hemoglobin concentration; RDW = red cell distribution width ind e x. Ze r o = control di e t w i thout afl a tox i n B (AFB ); 50=50 p g /kg AFBi pe r kg o f di e t a ry D M; 500= 500 p g /kg AFB per kg o f di e tary DM; n = 6 animal s/treatment . Metabolic Pathway Analyses The KEGG enrichment analysis and topology analy-ses (Meta b oAnalyst 5.0) were performed based on the 95 differential metabolites l isted in Supplemental Tables S1-S3)((h tt p s://doi.o r g/10.6084/m9.figshar e .21194458.v2; Shi, 2022) to investigate and map the metabolic differences among treatments. Pathways with an im-pact value greater than 0.1 or P < 0.05 were considered as significantly altered pathways and were labeled in Figure 3. Pathway topology analysis revealed that the 58meta b olites differed among all groups enriched in 19pathways, glycerophospholipid metabolism, tyrosine meta b olism, caffeine metabolism, and cysteine and methionine metabolism were the most impacted path-ways (pathway impact values >0.1). Based on KEGG enrichment analysis, the intestinal immune network for IgA production, small cell lung cancer, proteoglycans in cancer, glycosaminoglycan biosynthesis, a nd gastric cancer were significant metabolic pathways between CON and LD. Glycerophospholipid metabolism and choline metabolism in cancer were significant meta-bolic pathways b etween CON and HD. Moreover, 20pathways including choline metabolism in cancer, glyc-erophospholipid metabolism, and hepatoce l lular carci-noma, were enriched as significant metabolic pathways among all groups. Compared with the CON, t he level of LysoPC 18:3(6Z,9Z,12Z)], LysoPC [22:5(4Z,7Z,10Z,13Z,16Z)],LysoPC [20:5(5Z,8Z,11Z,14Z,17Z )],a nd triethanolamine in HD was significantly increased (P < 0.05, FC >2),and the level of sn-glycerol -3-phosphoethanolamine in LD was also increased (P <0.05, FC= 2.31). Notably,12 of the 58 differential metabol i tes among all groups were enriched in the glycerophospholipid metabolism pathway, and their levels were significantly upregulated with increasing AFB dose (P< 0.05). Moreover, 10of them were also enriched in choline metabolism in cancer pathway together with diacylglycerols (DG)16:0/18:1(11Z)/0:0and DG 16:0/18:2(9Z,12Z)/0:0]J .nterestingly,DG [16:0/18:1(11Z)/0:0] andDG 16:0/18:2(9Z,12Z)/0:0]were also the 2 metabolites enriched in hepatocellular carcinoma and other 17 sig-nificant pathways. Fifteen metabolites that differed among all groups (FC: 1.2-4.06, P<0.05)were associated with AA metabolism, including met a bolic pathways associated with phenylalanine (ko00360; salicylic acid), arginine, F igu r e 1. Changing t r end st a tis t ics of the met a bolit e s detect e d in (A) positive a nd (B) negative ion modes a mong g roups . C= control group; L= 50 pg /kg af latoxin Bi (AFB ) per kg o f die ta ry DM; H=500 pg /kg AFBi per kil o gram of dietary DM; up, d o wn, and unchange means several metabolites that are upregulated, d ownregulat e d, and unaffected metabolites, respectively. Sh i et al .: A F LATOXIN-IN D U C E D P LASMA M E T A B OL O M I C C H A NG E S A B ·1-Methyl h istid i ne -7 ·Hyp oxa n t h ine -Pi p ecolic acid -13.5 -Lyso P C(17:0) -LysoPC(15:0) -20 -I n dinavir - meta 1411 -LysoPC(22:5(4Z ,7Z,10Z,13Z,16Z )) -Lyso P C(20:1(11Z)) -LysoPC(20:5(5Z,8Z,11Z,14Z,17Z)) -Lyso P C(18:3(6Z ,9Z ,12Z )) -Cholesterol 3-sul f ate - meta 262 -Cholesterol g l ucu r o n ide -N i cotina m ide r ibot i de -Dopaquino n e -Tr i e t hanolamine 四厂 四' 四' 四w' 四四工 一工四四工工四工N 四'一 C -12.5 F ig u r e 2. He a tmaps are gener a ted b y the R package pheatmap w i th standard s ettings. The colors from green to red indicate the normalized relative l e vel s of met a bo l ites. (A) Met a bolites only affected by l ow-do s e a f la toxin B (AFB; 50 pg/kg AFB per kg of die t a ry DM); (B) me-tabolites only af f ect e d b y hi g h-dose AFB (500 pg/kg AFBi per kg of diet a ry DM); (C ) met a bo l it e s a ffect e d by both low- a nd high-dose AFB;me ta _288: sn-glycero-3-phosphoethanol a min e; met a _1414: carbamazepi n e -O-quinone; met a _262: 4-(2-aminoph en yl)-2,4-dioxobut a noic a cid;meta _1411: 1-pa l mitoy l-s n-glycero-3-phosphocho l ine ; met a _1310: 3,4-d i hydrox y phenylacet a ldeh y de ; meta _1588: a-[3-(nitrosoamino)propy l ]-3-pyridinemethanol ; met a _3274: 1-palmitoyl-sn-glycero-3-ph o sph o choline. Shi et al .: AF LATOXIN-IN D U C ED P LASMA M E T AB OLOMIC C H A N G E S Statistics of Pathway Enrichment B Rich factor Fi gu r e 3. (A, C , and E) Kyoto Encyclopedia of Genes and Genomes pathw a y enrichment and (B, D, and F) topology analysis of metabolites di f fered a mon g groups. (A and B) 20 met a bolites o nly af f ect e d by low-dose af la toxin B (AFB ; 50 p g /kg AFBi per kg of diet a ry DM); (C and D ) 17 metabolites only a ffected by high -dose AFB (500 p g /kg AFBi per kg of di e tary DM); (E and F) 58 metabolites af fe cted by both low - and high-dose AFB. The color of each circle changes according to the P-values (more signif i cant changes of met a bol it es in the pathway are shown by darker col o rs), wherea s the metabolite numbers and pathway impact score is depicted by the s i z e of the circle . The most impacted pathw a ys with the highest st a tistic a l si g nificance scores are annotated for c l arity . and proline (ko00330; creatinine a n d pyrrole-2-carbox-ylic acid), lysine (ko00300 and ko00310; saccharopine,2,4-diaminobutyric acid, and L-cystathionine),CyS-teine and methionine (ko00270; L-cystathionine and 5-methylthior i bose),t tyrosine metabolism(ko00350;3,4-dihydroxyphenylacetaldehyde, homogent i sic acid,leucodopachrome,4-fumarylacetoacetic acid),a n d tryptophan metabolism (ko00380; 3-methyldioxyindole,indole, and tryptophanol, 6-hydroxymelatonin), and their content was significantly increased with elevated AFB doses. To achieve more reliable results, animals used in this study were strictly selected before the experiment to minimize e ir adividual vvariations.Nat u ral 1F AFB-contaminated feeds are usually co-contaminated with many other mycotoxins; therefore, we selected purified standard AFBi to avoid the interference of other toxins derived from contaminated feeds. During the feeding exper i ment , al l goats appeared to be c li nically normal and no deaths resulted from the intoxication. Nutrient Digest i bility and Nitroge n Balance Our results suggested that when the AFB level in the diet exceed 50 pg/kg, the total-tract digestibility of most nutrients in goats could be affected. This is in line with the previously published observations. For instance , Edrington et al. (1994) reported decreased intake, daily gain, and feed efficiency in growing lambs intoxicated with 2.5 mg/kg aflatoxin. Aflatoxin E B exposure also decreased the apparent total-tract di-gestibil i ty of DM and ether extract of pigs at different growi n g stages (Pu et al., 2021). Growth Performance The decreased growth performance agreed with previ-ous observations. Fernández et al. (1996) reported that t h e reduction in BW is the most sensitive indicator of aflatoxin intoxication in growing lambs (Fernandez et al., 1996). In another study, Fernandez et al. (2000)also observed a nonsignificant decrease in BW and a signi f icant decrease i n ADG in lambs intoxicated with a diet contaminated with 2 ppm afla t oxin. Sun et al. (2018) found that the AFBj-contaminated diet decreased BW and ADG of male rabbits . Feeding a diet supplemented with 280 pg/kg AFB tended to decrease the final BW and ADG of pigs (Pu et al.,2021). The decreased growth performance of intoxicated animals could have partly resulted from t h e suppressed nutrient digestibility and nitrogen retention. Blood Cel l Count Parameters Hematological indices could reflect the pathological,physiological, and nutritiona l status of intoxicated ani-mals. We found no significant difference in RBC, HGB,and MCV among groups before the AFB challenge Ervtl (data not shown). Erythrocytes are the main medium for delivering oxygen to tissues and organs. The lev-els of RBC and HGB are associated with erythrocyte function, which delivers oxygen to organs and supports aerobic respiration and metabolism (Schaer et al.,2013). Increased RBC and HGB in lambs fed 2.5 ppm of aflatoxins have also been reported by Fernandez et al. (1996). They inferred that the relative polycythemia was proba b ly associated with th Was e decrease in water intake because many studies observed an increase in hematological parameters in animal aflatoxicosis due to the hemoconcentration phenomenon. In another study,the MCV and HGB were elevated in mice treated with fumonisin B for 8 wk (Chen et al., 2021). Zhang et al. (2020) found that orally administered with 0.75 mg/kg AFB decreased RBC and HGB,whereas MCV was not affected. The difference in re-sults might be partly due to the discrepancy in animal species, dietary level , and sources (pur i fied or natural l y contaminated) of AFB. Metab o lite Profiling of Plasma Sample s The parameters R'Y (model interpretation rate) and Q(predictive ability of the model) were greater than 0.4 of most OPLS-DA models, indicating these models were stable and reliable. Cross-validation and permuta-t i on tests for these models showed that the Q"intercept is close to or underlies zero, indicating that there was no overfitting (Yong et al., 2021). Symbols representing di ff erent groups were distributed to different sides of t he OPLS-DA score plots, suggesting that clear dif-ferences existed in the plasma metabol i te prof i les of di ff erent groups. Our results agreed well with previous studies that dense peaks and ions identified in plasma b y positive modes are far more than that by negative modes, because most of the plasma metabolites (e.g.,glycerophospholipid and AA) can be easier ionized at positive modes (Zhao et al., 2018). Differential Metabolites and Their Identification There is no uniform standard for differential metabo-lites and biomarker selection so far, and t he differential metabol i tes selected may not be really useful as c l ini-cal biomarkers. Receiver operating characteristic curve analysis has been widely cons i dered as an objective and statistically valid method for biomarker performance evaluation (Xia et al.,2013). The AUC values >0.8means good ut i lity, and >0.9 means excellent perfor-mance. Researchers suggested al l metabolomic studies present ROC analysis results to facilitate further dis-covery and validation studies (Xia et al.,2013). When taking the FC and AUC (FC >3, AUC >0.8)into consideration simultaneously, 5 metabolites be-tween CON and LD, 6 meta b olites between CON and HD, and 29 metabolites among the 3 groups co u ld be considered as the most significantly altered metabo-lites, and might be used as biomarkers for discrimi-nating CON, LD, and HD groups. Those metabolites might have the potential to be used as new biomarkers to diagnose aflatoxicosis in goats induced by different AFB doses. One limitation of our study was that the level of some reported blood biomarkers of aflatoxicosis in humans and animals, such as AFBj-albumin ad-duct and AFB-lysine adduct (Xue et al., 2016), was not determined . Further studies focused on comparing the ident i fied metabol i tes with exist i ng markers a n d validating their effectiveness in aflatoxicosis diagnosis are highly needed. Moreover , the AUC values could be affected by many factors such as small study sample sizes (Carter et al.,2016), more investigations with dif-ferent animals , and larger sample sizes are encouraged. To exert its carcinogenic potential, AFBi must be meta b olically activated by P450 enzymes in the liver,whereas the critical P450 enzymes in different animals have yet to be identified. Alpha-[3-(N itrosoamino)propyl ]-3-pyridi n emethanol, 4-Oxo-1-(3-pyridyl )-1-bu-一 tanone, and 3-hydroxylidocaine were related to cyto-chrome P450 metabolism (ko00980 and ko00982), and their levels were significantly upregulated (FC > 2.36,小 P < 0.01) with increasing doses of AFB . In the human liver, P450s are critical for the formation of 4-Oxo-1-(3-pyridyl)-1-butanone (keto aldehyde), which could methylate DNA, and is believed to be important in the carcinogenic progress (Rendic and Guengerich, 2021).Moreover, carbamazepine-O-quinone,S-(1,2-dichlorovinyl) glutathione were also related to cytochrome P450 metabolism (ko00980 and ko00982),and their content was significantly increased (FC >2.38, P <0.01) in LD when compared with CON. Fur-ther study is encouraged to evaluate the potential of these metabolites used as targets to block the activa-t ion of AFB in the liver. Sphingosi n e has been reported factor in various cell types and may play important role in some apoptotic systems. It is also able to in-duce apoptosis in a mitochondrion-dependent manner (Cuvi l lier, 2002). In the present study, the content of p lasma sphingosine was increased with AFB doses (S u p plemental Table S3), and the relationship between s p hingosine and cell apoptosis in ruminants deserves further research 1.. Met a bolic Pathway Analyses Based on our results, glycerophospholipid metabol i sm (ko00564) and choline metabolism in cancer (ko05231)p athways were the most affected pathways in AFB1intoxicated goats, and many common metabolites were shared between them. The elevation of plasma choline and phosphocholine might be related to the hepatotoxicity and carcinogenic-ity of AFB. Zhang et al . (2011) observed a significant elevation of choline metabolites (choline, phosphocho-l i ne, glycerophosphocholine) in plasma, and increased li p ids and AA (tyrosine, histidi n e, phenylala n ine, leu-cine, isoleuc i ne, and valine), chol i ne, and nucleic acid metabolites in the liver of rats exposed to AFB1 Choline metabolism could be affected in various types of cancers , and increased levels of p hosphocholine and total choline-containing compounds have increas-ingly been considered as endogenous biomarkers of many cancers (Glunde et al., 2015). Detecting changes in choline metabolism in p lasma could prove to be a useful way in early tumor ident i fication (Glunde et al., 2015). Research confirmed that several enzymes in choline, ethanolamine, and phospholipid metabolism are i nvolved in tumor progression and carcinogenesis Cheng et al., 2016). Further studies on discovering the genes and signaling pathways leading to the changes in choline-containing metabolites are needed. Glycerophospholipids are major lipid constituents of cell membranes and play vital roles in cell proliferation ,differentiation, and apoptosis (van Meer et al., 2008).The content of phospholipids was increased during cell transformation and tumor progression (Cheng et al.,2016). Aberrant choline and ethanolamine phospholipid meta b olism have been observed in all cancers so far (Cheng et al., 2016). Liver injury and disturbed expres-sion of genes associated with lipid metabolism were also observed in rats exposed to 0.5 and 1 mg/kgof AFB for 7 d (Rotimi et al., 2017). Research on Hep3B ce l ls reported similar findings. Wang et al . (2021) evaluated the effects of AFB exposure on metabolomic changes of Hep3B cells, and a marked elevation in glycerophos-p holipids level was observed. The level of 8 phospho-choline,12 phosphatidylethanolamine, and 9 phos-p hatidylserine metabolites was significantly increased in high-dose AFB cells. Moreover, elevated level of choline and phosphocholine in AFBj-exposed cells was also observed. Their results indicated disturbed struc-tura l integr i ty of cell membranes was induced by AFB b ecause choline, phosphochol i ne, and p hosphocholine are essential elements of them. Enzymes mediating the abnormal choline metabolism are being investigated as targets for cancer therapy. The role of the choline metabolism in ruminant AFB intoxication and the un-derlying molecular causes mer i ts further investigation. Dysregulation of AA metabolism was also observed in our study. The levels of the 15 differential metabo-lites among all groups related to AA metabolism were upregulated with increasing AFB levels. This is agreed with a previous study that AFBi could induce signifi-cant changes in AA metabolism in Hep3B ce l ls (Wang et al., 2021). CONCLUSIONS Exposure to AFB decreased total-tract nutrient digest i bility , N retention, and ADG of Saanen goats.The ability of ruminants to inactivate AFBi might be limited and the long-standing hypothesis that ru-minants are less vulnerable to AFBi may need to be reevaluated.Untargeted metabolomics S successfully revealed the alterations in plasma metabolome. Meta-bolic changes in the high-dose group were more obvious than that in the low-dose group. Fifty-eight metabolites were significantly affected by both low and high doses of AFB, and there is merit in the further investigation to explore the potential of using them as biomarkers for AFB intoxication diagnosis. There were remarkable n. plvcerc changes in choline metabolism, glycerophospholipid metabolism, and AA metabolism pathways. Exploring the underlying molecular causes of the changes may help the development of rapid diagnostic techniques 6+1xTA and preventive strategies for AFB intoxication. ACKNOWLEDGME N TS This study was supported by the National Na t ural Science Foundation of China (grant no. 31902187),the Fundamental Research Funds for the Centr a l Univer-sities, Southwest Minzu U n iversity (Chengdu, China;grant no. 2021HQZZ04, 2021057), and the Innovation Team Development Funds for Sichuan Mutton Goat &Sheep (Chengdu, China; grant no. cxtd2019-14). The work described here has not been published previ-ously and is not under consideration for publication elsewhere . The authors have not stated any conf l icts of interest. REFERENCES Adebo, O. A., P. B. Njobeh, S. Gba s hi, O. C . Nwinyi, and V. Mavu-mengwana. 2017. Review on microbial degr a dation of a flatoxins.Cr i t . Rev . F o od Sc i . Nutr. 57:3208-3217. h tt ps ://d oi.org /10.1080/10408398.2015.1106440. AOAC Internation a l. 2005. Official Methods of Analysis of AOAC.18th e d . AOAC Intern a tion a l . Battacone , G., A . Nudd a , S. P. G. Rassu, M. Dec a ndia , a nd G. Pu l in a .2012. Excret i on pattern o f a flatoxin M 1 i n the mi l k of goat s fed a single dose of aflatoxin Bj . J. Dairy Sc i . 95:2656-2661. h t tps://do i .org/10.3168/j ds.2011-5003. Bl a nkson, G. K., and F . C . Mil l -Ro b ertson. 2016. Af l atox i n contamina -6.1 1d-t i on and exposure in processed cereal -based complement a ry foods for infants and young children in greater Accr a , Ghana. Food Con-trol 64:212-217. https://doi.or g/10.1016/j.foodcont .2015.12.032. C a rter , J. V., J . Pan, S. N. R a i , and S . Gal a ndiuk. 2016. ROC -ing along : Evaluati o n and interpretation of receiver operating charac -teristic curves. Surgery 159:1638-1645. https://doi.o r g /10.1016/j .surg.2015.12.029. Chen, Z ., F. Zhang , L . Ji a ng, Z. Chen, and H. Sun . 2021. Toxic e f -fects of myc o toxin fumonisin B1 at six different dos e s on femal e BALB/c mice .Toxins (Ba s e l ) 14:21. h ttps://doi .o r g /10.3390/tox i ns14010021. Cheng, J., S. Huang , C . Fan , N. Zh e ng, Y. Zhang, S. L i, a nd J . Wa n g.2017. Metabolomic analysi s of alterat i ons i n lipid oxidat i on, car -bohydrate, and amino acid met a bolism in d a iry goat s caused by exposure to aflotoxin B1. J. Dairy Res. 84:401-406. h t tps://do i .o rg /10.1017/S0022029917000590. Cheng, M., Z. M. Bhujwalla, and K. Glunde . 2016. T a rget i ng phospho-lipid me t abolism in c a ncer. Front . Oncol. 6:266. h ttps://d oi .org /10.3389/fonc.2016.00266. Cuvi ll ier, O. 2002. Sphingos i ne in apoptos is signaling . Biochim. Bio-phy s . Act a Mol. Cell Biol. Lipids 1585:153-162.h ttps://d oi.or g /10.1016/S 1388-1981(02)00336-0. Edrington,T. S ., R. B. Harvey , and L. F. Kubena. 1994. Effect of afla-tox i n i n growing l a mbs f e d ruminally d e gr ad able or e scape prote i n TA sources. J . Anim. Sc i . 72:1274-1281. h ttps://d oi.org/10.2527/1994.7251274x . Elgioushy , M. M., S . A. Elgaml, M. M. El-Adl, A . M. Hegazy, and E. A. H as hish. 2020. Af la toxicosis in c a tt l e : C li nic a l findin g s and biochemical alt e rations. E nviron. Sc i. Pollut. Res . Int . 27:35526-35534. https://doi.or g/10.1007/s11356-020-09489-3. FASS. 2010. Guide for the Care and Use of Agricultural Animals in Research and Te a chi n g. 3rd e d . FASS Inc . Fernandez, A., M. Hernandez, M. T. V e rde , and M. Sanz. 2000. E f fect of afl a t o xin on performance, hematolo g y , a nd clinic a l immunology in l a mbs. Can. J. Vet . Res. 64:53-58. Fernandez , A ., J. J . Ramos , M. C . Sanz , T. S ae z, and D. F . Luco.1996. Alter a tions i n the performance , ha e matology a nd c li nical biochemistry of grow i ng lambs fed with a flatoxin in the diet . J .Appl. T oxicol .16:85-91.https://doi .or g /10.1002/(SIC I )1099-1263(199601)16:1<85::AID-JAT315>3.0.CO;2-T . Fink -Gremmel s, J. 2008. Mycotoxins in cattle feeds and c a rry-over to dairy mi l k: A review. F o od Addit . Contam. Part A Chem. Anal.Control Expo. Risk As s ess. 25:172-180. https://doi.org /10.1080/02652030701823142. Gio v at i , L., W. Magli a ni, T . Ciociol a , C. Santinoli, S. Cont i , a nd L.Polone ll i . 2015. AFM1 in milk: Physical, bio l ogical, a nd prophy-l a ctic methods to miti g ate contamination. Toxins (Basel) 7:4330-4349. h ttp s://doi.or g/10.3390/toxi n s7104330. Glunde , K., M.-F . Penet, L . J i a ng, M. A. Ja c obs, and Z. M. Bhujwall a.2015. Choline met a bolism-based molecular di ag nosis of canc e r : An updat e . Expert Rev . Mol. Di a gn . 15:735-747. https://doi.org/10.1586/14737159.2015.1039515. Reed, K., K. Mendoza, J . Abr a h a nte , a nd R . C o ulombe. 2018. Com-parative re s ponse of the hepatic transcriptomes of domestic a t e d and wild turkey to aflatoxin B. Toxins (Basel ) 10:42. h t tps://doi .o rg /10.3390/toxi n s 10010042. L i u, X., M. Zhang, X. Cheng, X. Liu, H. Sun , Z. Guo, J. Li, X. Tang,Z . Wang, W . Sun, Y. Zhang, and Z. Ji. 2020. LC-MS-ba s ed plasma met a bolomics and lipidomics analyse s for different ia l di a gnosis of bladder cance r a n d renal c el l carcinoma. Front. Oncol. 10:717.h tt p s ://doi.or g/10.3389/f onc.2020.00717. Luo, z . Z., L. H. Sh e n, J . Ji a ng, Y. X. Huang, L. P. Bai, S. M. Yu, X.P. Yao, Z . H. Ren, Y . X. Yang, and S. Z. C a o. 2019. Plasma me-t a bolite changes in d a iry cows during partur i tion identified u si ng untargeted met a bolomics. J. Dairy Sci. 102:4639-4650. https://d oi .org /10.3168/jd s .2018-15601. Marin, S ., A. J . Ramos , G. C a no-S a ncho, and V. Sanc h is . 2013. My -cotoxins : Occurrence , toxicology , and exposure a ssessment . Food Chem. T o xicol. 60:218-237. h t tps://doi.org /10.1016/j.f ct .2013.07.047. NRC . 2001. Nut r i e nt Requirements of Dairy C a ttl e . 7th ed. Nat l .Acad. Sci . NRC. 2007. Nutrient Requirement s of Small Ruminant s: Sheep, Goat s,Cervids, and New W o rld Camelids. 1st rev. ed. Natl. Acad. Press . Ogu n ad e , I ., Y . Ji a ng , J. Ad e yemi , A. Ol i veir a , D. Vyas, a nd A. Ad -e s ogan . 2018. Biomarker of a f l atoxin ingestion: H NMR-based plasma met a bolomic s of dairy cows fed aflatoxin B with or with-out sequestering agent s. Toxins (Base l) 10:545. https://d oi .org/10.3390/tox i ns 10120545. Peng, J ., L. Ma, L. Y . Kw o k , W . Zhang , and T . Sun. 2022. Unt a r -geted metabolic footprint i ng reveal s key di f ferences between fer-mented brown milk and fermented milk me ta bolomes.J . Dairy Sci.105:2771-2790. h t tps://doi.o r g/10.3168/j ds.2021-20844. Pu, J ., Q. Yuan, H. Yan, G. Ti a n, D. Chen, J . H e , P. Zheng, J . Yu,X. Mao , Z. Huang, J . Luo, Y. Luo , and B. Yu. 2021. Effec t s of chronic exposure to low level s of diet a ry afl a toxin Bi on growth performance , apparent tot a l tr a c t dig e st i bi l i ty and intest i nal he a lth in pigs. Animal s (Basel ) 11:336. h ttps://doi .o r g/10.3390/an i11020336. Rendic , S. P ., and F. P. Guen g erich. 2021. Human f a mily 1-4 cy-tochrome P450 enzyme s involved in t he met a bolic a ctivation of xenobiotic a nd physiological chemic a ls: an update. Arch. T o xicol .95:395-472. https://doi.or g/10.1007/s00204-020-02971-4. Rotimi, O. A., S . O. Rotimi , C. U . Duru, O. J. Ebebeinwe , A . O.Abiodun, B. O. Oyeniyi , an d F. A . Fad u yile. 2017. Acute a f l atox i n B1-I nduced hepa t otoxicity alters gene expre ss ion a nd di s r u pts lipid and lipoprotein metaboli s m in rat s. Toxicol . Rep. 4:408-414.https://doi.org/10.1016/j .toxrep.2017.07.006. Sch a e r , D. J ., P . W. Buehl e r , A. I . Al a yash, J . D. Belcher , and G. M.V e rce l lotti . 2013. Hemolysis and free hemoglobin revi s i t e d: Explor -ing hemoglobin and hemin s cavengers as a novel cl a s s of therapeu-t i c prote i ns. Blood 121:1276-1284. h t tps://d oi.org /10.1182/bl ood -2012-11-451229. Shi, H. 2022. J DS22129.pdf . figsh a re . Online re s ource . https://doi .org /h t tps ://doi.or g/10.6084/m9.f i gshare.21194458.v2. Shi, H., S. Li, Y . Bai, L . L. Prates , Y. Le i , and P. Yu. 2018. Myco-toxin c o nt a mi n ation o f food a nd fe e d in China : Occurrence, det e c -tion technique s, toxicological effect s and advances in mitigation technologie s. Food Control 91:202-215. https://d oi .org/10.1016/j .foodcont.2018.03.036. Shi , H. T., S. L. Li , Z. J . Cao, Y. J. Wang, G. M. Alugongo, and P.H. Doane. 2015. Effects of r e placing wild rye, corn s i l a ge, or c o rn g rain with CaO-tre a ted corn s t o ver and dried dist i llers grains with solubles in lactat i ng cow diet s on performance , dig e stibil i ty, and profit a bility . J . Dairy Sc i. 98:7183-7193. h ttps://do i .o r g /10.3168/ids.2014-9273. Sun, Y ., G. Dong, G. E, M. Liao, L. T a o, and J. Lv . 2018. The effects of low level s of af la toxin B1 on h e alth , growth performanc e and re-pro d uctivity in male rabbit s. World Rabbi t Sc i . 26:123-133. h ttps://doi .org/10.4995/wrs.2018.7433. v a n Meer, G., D. R. Voelker , and G. W . Feigenson. 2008. Membrane lipi ds : Where they a re an d how they behave . Nat . Rev. Mol. Ce l l Bio l . 9:112-124. h tt p s ://d oi .or g/10.1038/nrm2330. Wang, S., X. Yang, F . Liu, X. W a ng, X. Zh a ng, K. He , and H. Wang .2021. Comprehensive met a bolomic analysis reveals d y namic meta-bolic reprogrammin g in Hep3B cells with a fl a toxin B1 exposure.Toxins (Basel ) 13:384. h tt p s://doi .or g/10.3390/toxins13060384. Xia ,, J., D. Y . Broadh u rst , M. Wilson, a nd D. S. Wishart . 2013.Tr a nslational biomarker discovery in clinical met a bolomics: An introductory tut o rial. Metabolomic s 9:280-299. https://d oi.org /10.1007/s11306-012-0482-9. Xue, K. S., W . C a i , L. Tang, and J . S. Wang. 2016. Af l atoxin B1-lysine adduct in dried blood spot samples of a nimal s and humans . Fo o d Chem. Toxicol. 98:210-219. https://doi.or g/10.1016/j.f ct.2016.11.002. Yong , K., Z. Luo, Q. Luo, Q. Yang , Y . Huang , X . Zhao, Y . Zhang ,a nd S . C a o . 2021. Plasma met a bolome a lteration in dairy cow s with left displac e d a bomasum befor e and a fter surgic a l correction. J.Dai r y Sc i . 104:8177-8187.h t tps ://doi .org /10.3168/jd s .2020-19761. Zhang, J ., P. Wang , F. Xu, W . Hu a ng, Q. Ji , Y . Han, B. Shao , and Y . Li . 2020. Protective effects of lycopene a gainst AFB-in d uced erythrocyte dysfunction and oxi d at i ve stres s in mice. R e s. Vet . Sci .129:103-108. h t tps ://doi.or g/10.1016/j.r vsc .2020.01.015. Zhang , L., Y . Ye , Y . An, Y. T i an, Y. Wang , and H . Tang. 2011.Systems response s of rat s to afl a toxin Bl exposure revealed with metabonomic changes in mul ti ple biologic a l matrices. J. Proteome Res. 10:614-623. h tt p s://doi.org/10.1021/pr100792q . Zha o , H., C . Wang, N. Zha o , W. Li, Z . Yang, X. Liu, W . Le , and X.Zhang . 2018. Potential biomarker s of Parkinson’s d i s ease revealed by plasma metabolic profi l ing. J. Chromatogr . B Analyt . Technol.Biomed. Li f e Sc i . 1081-1082:101-108. ht t ps://d o i .org /10.1016/j .ic h romb.2018.01.025.
关闭
-
1/12
-
2/12
中国格哈特为您提供《西南民族大学 中国农业大学 萨能奶山羊饲料蛋白质、总脂肪、中性洗涤纤维、酸性洗涤纤维及排泄物总氮、总脂肪、中性洗涤纤维、酸性洗涤纤维含量的检测》,该方案主要用于饲料中营养成分检测,参考标准《暂无》,《西南民族大学 中国农业大学 萨能奶山羊饲料蛋白质、总脂肪、中性洗涤纤维、酸性洗涤纤维及排泄物总氮、总脂肪、中性洗涤纤维、酸性洗涤纤维含量的检测》用到的仪器有格哈特全自动超级总脂肪测定系统HT6+SOX416、格哈特快速干燥仪STL56、格哈特杜马斯定氮仪DT N Pro、格哈特全自动型纤维分析仪FT12、德国加液器MM、滤纸筒。
我要纠错


 咨询
咨询