螺旋压豆粕(SPS)、溶剂提取豆粕(SES)、大豆蛋白分离物中蛋白质CP、酸水解总脂肪AEE和粗纤维含量的检测
检测样品 饲料
检测项目 营养成分


方案详情文
智能文字提取功能测试中
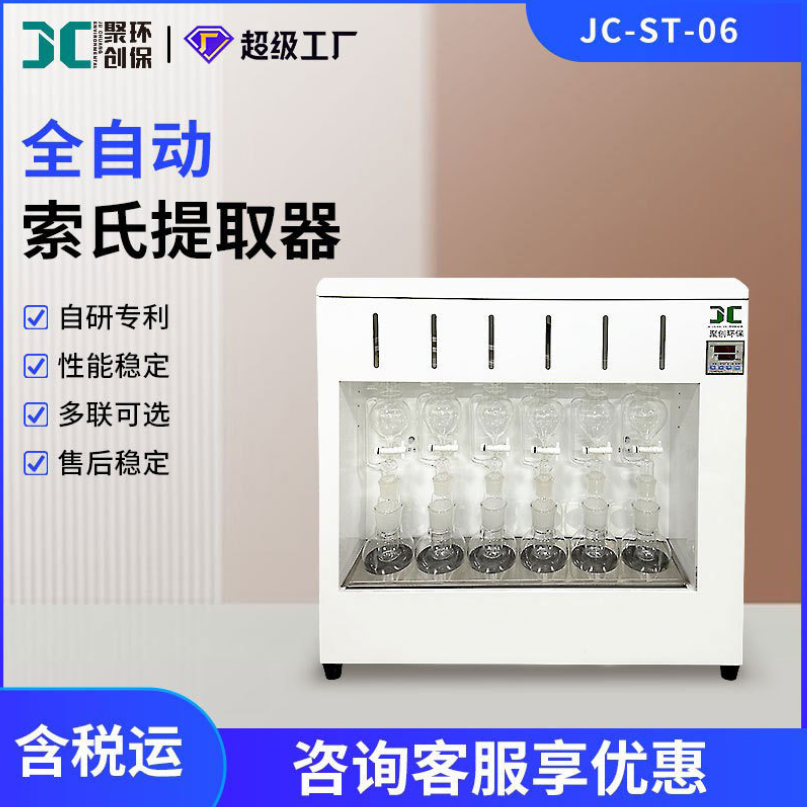
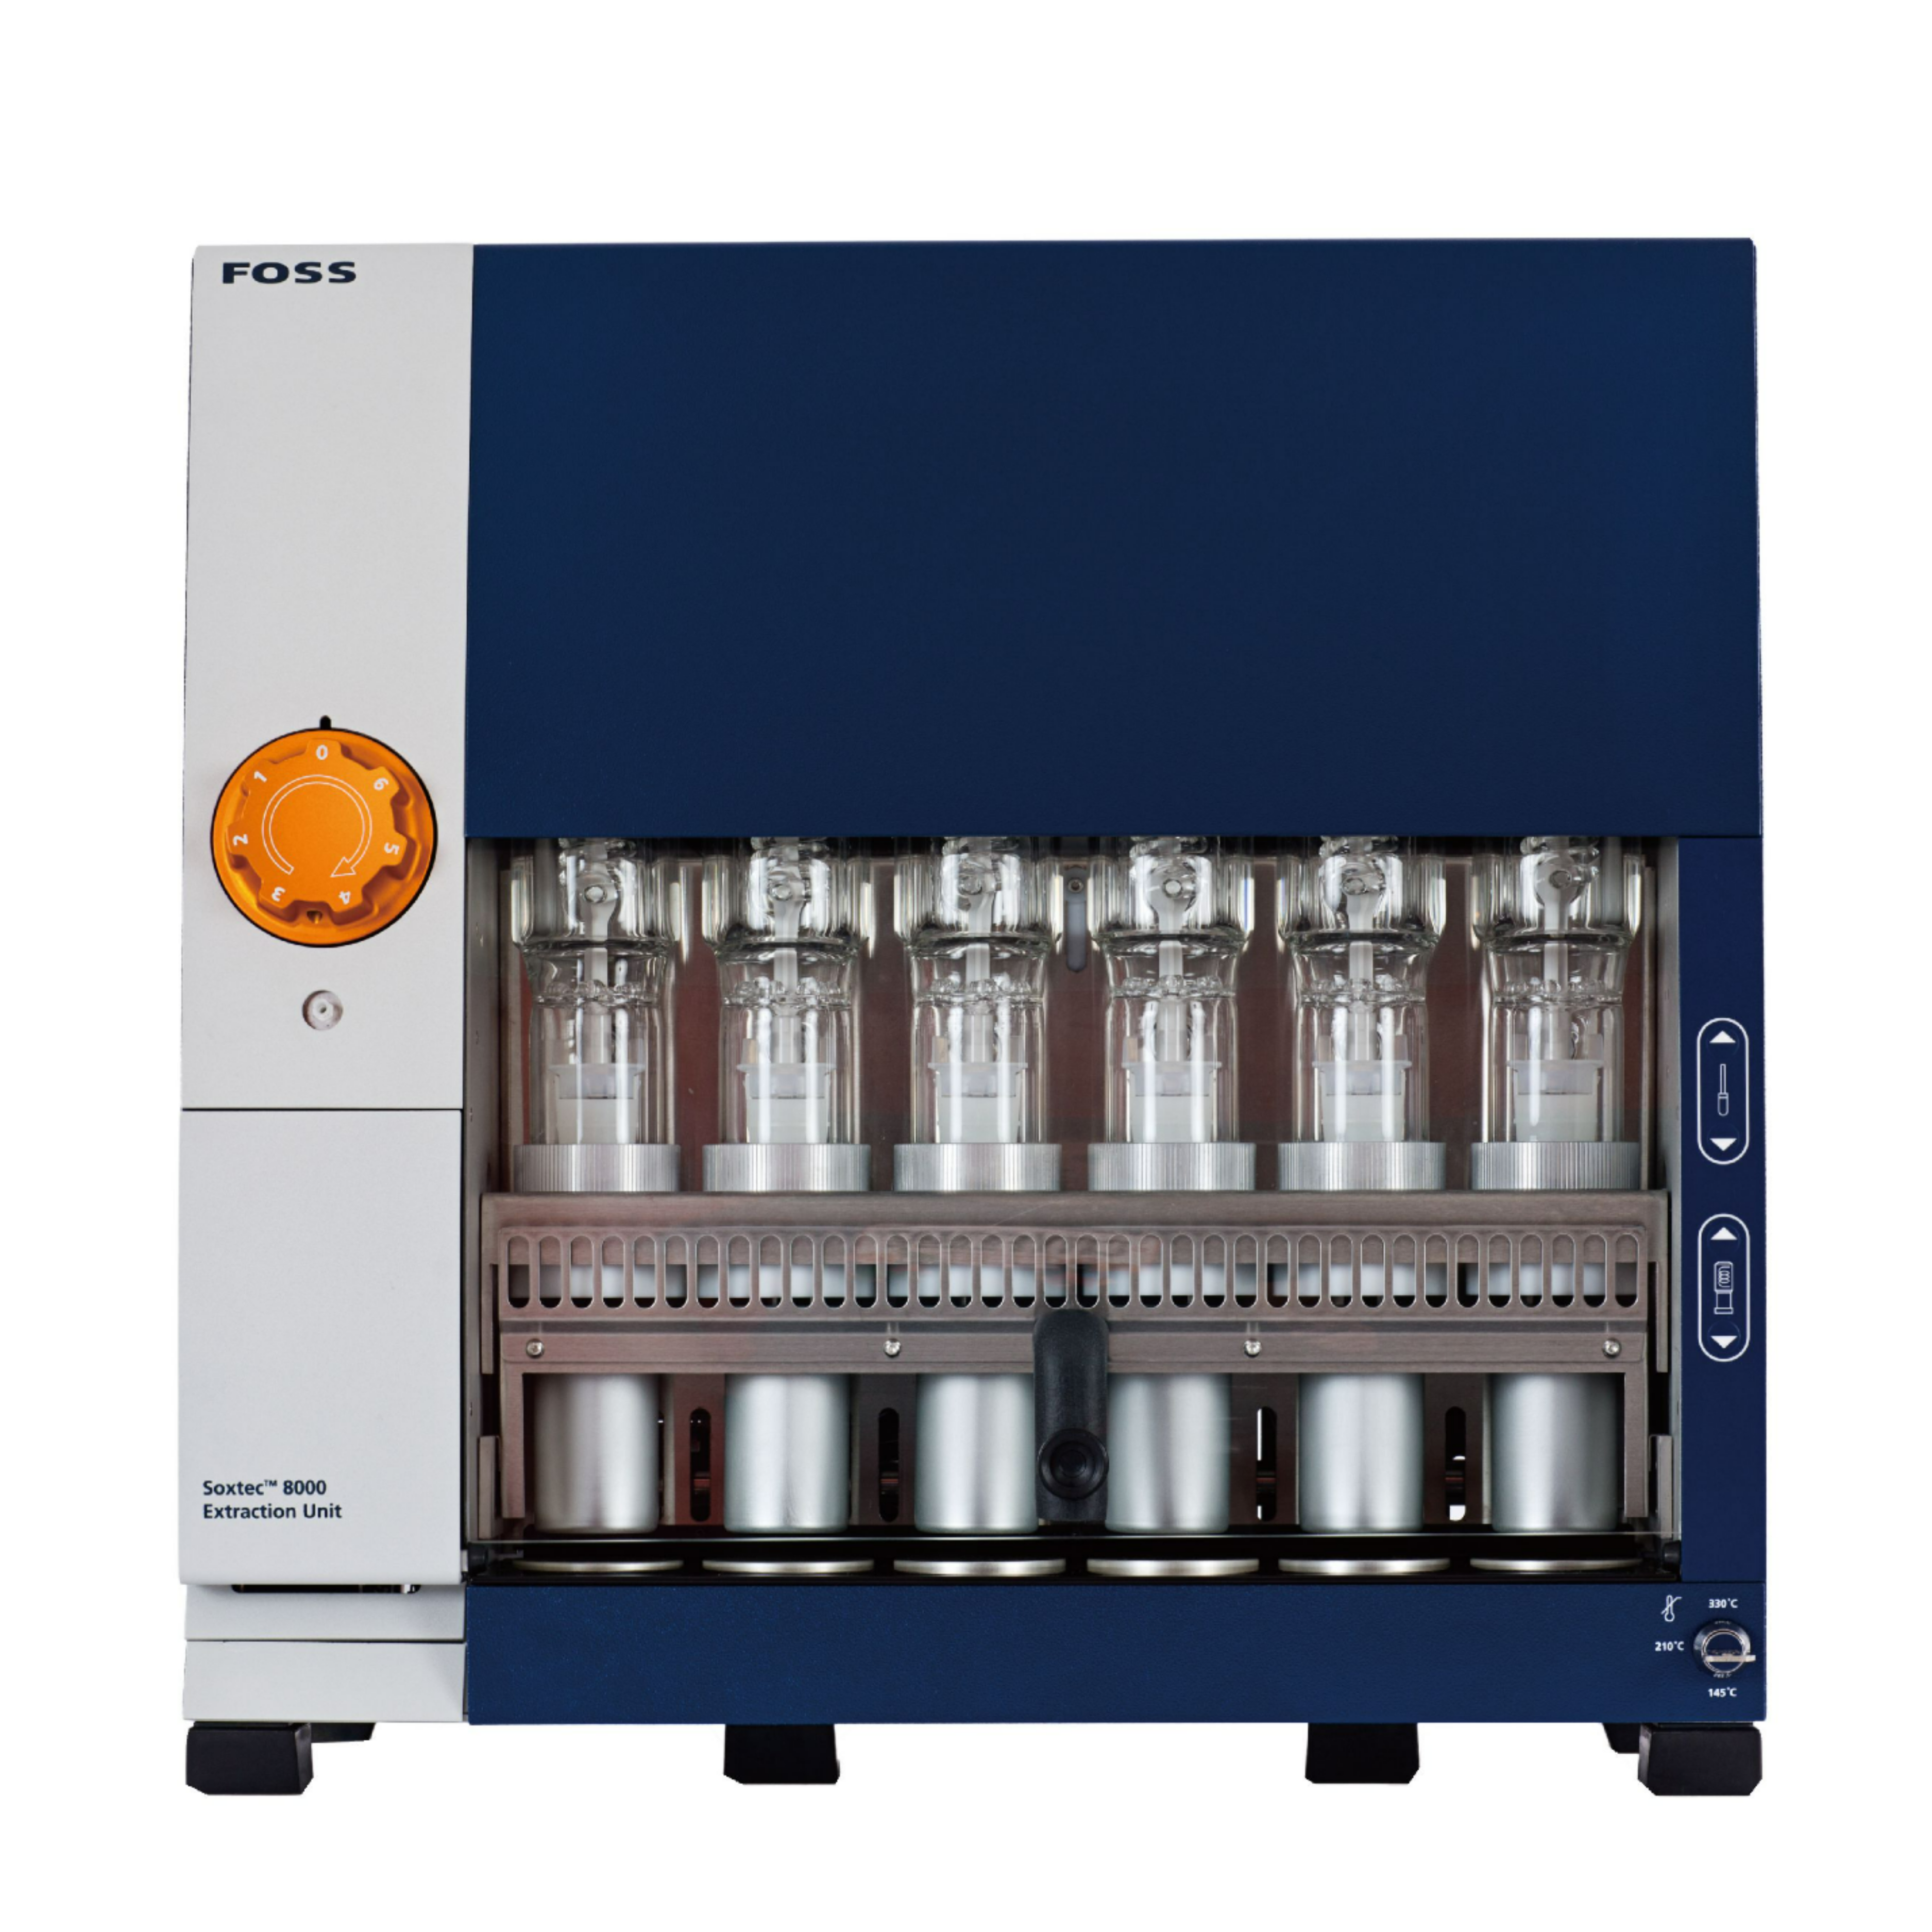
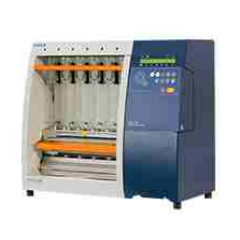
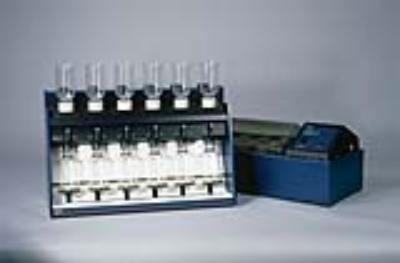
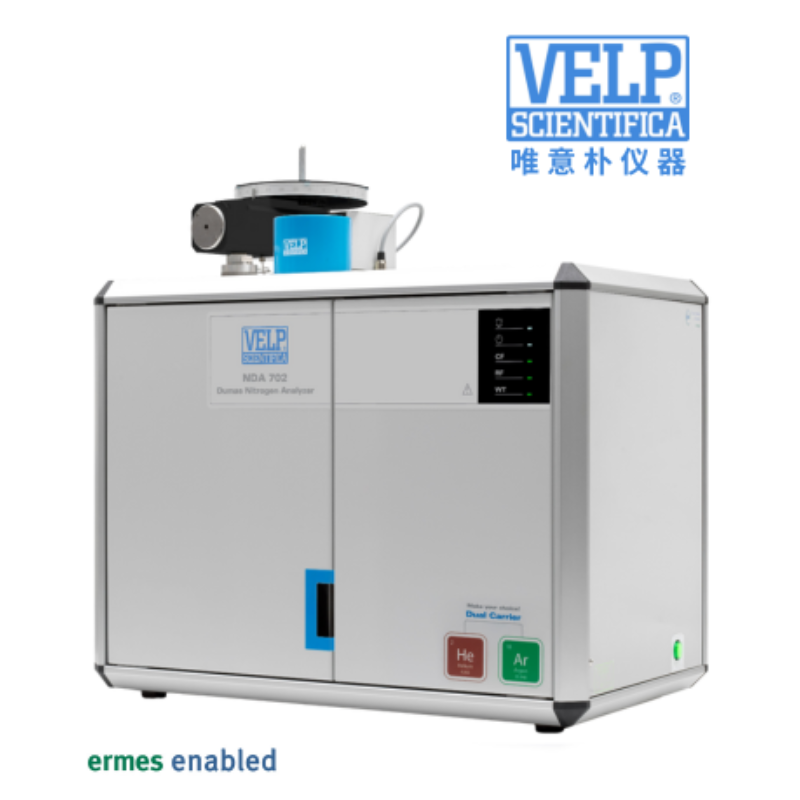
使用格哈特公司杜马斯定氮仪、全自动酸水解+全自动索氏提取、全自动纤维仪检测螺旋压豆粕(SPS)、溶剂提取豆粕(SES)、大豆蛋白分离物中蛋白质CP、酸水解总脂肪AEE和粗纤维含量。Animal Feed Science and Technology 294 (2022) 115501journal homepage: www.elsevier.com/locate/anifeedsci Animal Feed Science and Technology 294 (2022) 115501M. Tretola et al. Contents lists available at ScienceDirect Animal Feed Science and Technology 板栗提取物降低大豆基营养素的体外消化率和多酚生物利用度,但保护猪空肠段的上皮屏障功能 Chestnut extracts decrease the in-vitro digestibility andpolyphenol bioavailability of soy-based nutrients but protect theepithelial barrier function of pig jejunum segments after digestion Marco Tretola ad1, Paolo Silaccia2, Raquel Sousa b3, Francesca Colombo°c,4Sara Panserid5, Matteo Ottobonid6, Luciano Pinottid7, Giuseppe Bee a,*,8 Agroscope, Institute for Livestock Sciences, La Tioleyre 4, 1725 Posieux, Switzerland PAgroscope, Institute for Food Sciences, Schwarzenburgstr. 161, 3003 Bern, Switzerland C Department of Pharmacological and Biomolecular Sciences, University of Milan, Milan, Italy “ Department of Veterinary Medicine and Animal Sciences (DIVAS), University of Milan, Via dell'Universita 6, 26900 Lodi, Italy ARTICLEINFO ABSTRACT Keywords: Hydrolysable tannins Ussing chamber Polyphenols Intestinal integrity Polyphenols are known to interact with protein fractions of feed ingredients in the digestive tractthereby affecting the digestibility. These effects may differ depending on the chemical compo-sition of the protein fractions. Thus, the objective of the study was to study the impact of a tannin-rich chestnut extract (CHE) on the in-vitro digestibility (IVD) of soy protein isolate (SPI), screw-pressed soybean (SPS) and solvent-extracted soybean (SES). Pig In addition, CHE-derived metabolites were tested for their effects on intestinal epithelialintegrity. The SPI, SPS, and SES were digested in vitro without (SPI-, SPS-, SES-) or with CHE(SPI+, SPS+, SES+) or as a control (C) solely CHE. The metabolites and the polyphenols contentafter digestion of the soy-based products with or without CHE were quantified. The trans-epithelial resistance (TEER) was monitored in porcine jejuna in the presence of CHE-derivedmetabolites at three dilutions (1:4, 1:8, and 1:16 v/v) or in their absence. The claudin-1(CLDN1), occludin (OCLN) and zonula occludens-1 (ZO1) tight junctions-protein expressionswere determined. Finally, the effects of CHE-metabolites against indomethacin (INDO)-induceddecrease of TEER were tested ex vivo. The CHE decreased the IVD (P < 0.05) and decreased the Abbreviations: Arg, arginine; CD, compound discover; CHEs, chestnut extracts; CLDN1, claudin-1; CP, crude protein; CPD, crude protein di-gestibility; CTRL, control; DM, dry matter; FS, full scan; GAE, gallic acid equivalent; HT, hydrolysable tannins; INDO, indomethacin; IVCPD, in-vitrocrude protein digestibility; IVD, in-vitro digestibility; IVDMD, in-vitro dry matter digestibility; KRB, Kreb’s Ringier buffers; OCLN, occludin; OMD,organic matter digestibility; SES, solvent-extracted soybean; SPI, soy protein isolate; SPS, screw-pressed soybean; TEER, trans-epithelial resistance;TJ, tight junction; ZO1, zonula occludens-1. *Corresponding author. E-mail address: giuseppe.bee@agroscope.admin.ch (G. Bee). https://orcid.org/0000-0003-3317-4384 么https://orcid.org/0000-0001-7541-1961 >https://orcid.org/0000-0002-7738-9961 “ https://orcid.org/0000-0002-8099-0192 >https://orcid.org/0000-0001-6970-2009 °https://orcid.org/0000-0003-0123-3888 'https://orcid.org/0000-0003-0337-9426 https://orcid.org/0000-0002-6397-7543 detectable polyphenol content (P <0.05) after digestion of CHE with SPI, SPS, or SES. The SPIand SPI+CHE were the samples with the highest content of metabolites generated after thedigestion, while CHE presented the lowest content of metabolites. No detrimental effects on TEERwere observed. The 1:8 dilution increased (P <0.05) both ZO1 and OCLN protein expression byup to + 60% compared to the control, while the dilution 1:16 increased Zo1 expression by +100% without affecting OCLN expression. The 1:16 dilution also protected the jejunum from theeffects induced by INDO. These results suggest that the anti-nutritional effects exerted by CHE onsoy-based meals IVD may depend on the meal’s chemical composition. Moreover, we showed thatCHE polyphenols exert protective effects on the intestinal epithelium integrity ex vivo at lowconcentrations. 1. Introduction Several studies have reported that the use of chestnut extracts (CHEs) as feed ingredients affect different traits in both monogastricsand ruminants, such as gut health and microbial ecosystem (Selje et al., 2007; Tretola et al., 2019; Girard and Bee, 2020). Chestnut(Castanea sativa) is considered a rich source of polyphenols, as they consist of approximately 600 g/kg, as fed glucosidic hydrolyzabletannins (HT) (Aires et al., 2016). The polymers of HT cannot be absorbed in their native form and hydrolysis of linkages by intestinalenzymes and colonic microbiota occurs until they are gradually metabolized to urolithins (Girard and Bee, 2020). Studies havedemonstrated that a small amount of CHE-derived metabolites might be intestinally absorbed, exerting antioxidant (Reggi et al., 2020)and cytomodulatory (Cires et al., 2017) activities. Metabolites like punicalagin (Biolley et al., 2019) and gallic acid (Tretola et al.,2021) have also been found to affect the intestinal absorption of specific classes of amino acids. The interaction of HTs from CHE withnutrients, however, can lead to a reduced digestion rate and absorption of proteins, sugars, and lipids (Girard and Bee, 2020). Despitethese anti-nutritional effects, the interest in the use of HTs as functional compounds is still high. However, little is yet known about theeffects of CHEs on the digestibility of nutrients containing different levels of proteins and lipids, as well as how the CHE-derivedpolyphenols could affect the intestinal epithelial cell integrity in pigs. To test these interactions in the current study, four in-vitroexperimental approaches were used. INFOGEST, a harmonized in-vitro digestion model, was used to mimic the complex and dy-namic processes in gastric and small intestinal nutrient digestion (Egger et al., 2019). A second in-vitro digestion approach was used toevaluate the impact of CHE addition on in-vitro organic matter digestibility (OMD) and in-vitro crude protein digestibility (CPD) inthree different soy-based products. To test the toxicity of the INFOGEST-digested products and fluids, an in-vitro cell culture model wasused to mimic the functional and morphological intestinal organization. In addition, an ex-vivo model using the small intestinal tissueof pigs was used to study the transport and the influence on intestinal integrity of CHE-derived metabolites. The latter, evaluated byprotein expression of the tight junction (TJ) proteins, is essential to regulating intestinal permeability and to maintaining the rightpolarisation of the intestinal epithelial cells, thereby functioning as a barrier against pathogens and other potentially harmful agents(Amasheh et al., 2008). An improved understanding regarding the regulation of intestinal TJs by CHE is of key importance to betterestimate the potential and risks associated with the use of HT in feed ingredients. To our knowledge, this is the first time that theharmonized in vitro digestion is coupled with the perfusion chamber system to investigate the interaction between CHE and othernutrients and to directly investigate the effects of the obtained phenolic metabolites on the intestinal epithelium integrity in pigjejunum. In the present study, we hypothesised that bioactive compounds of CHE can affect nutrient digestibility depending on theirchemical composition, and that different concentrations of CHE-derived polyphenols differently affect intestine epithelial barrierfunctionality. 2. Material and methods 2.1. Samples and chemical composition Three different soy-based meals were used to test the effects of CHEs on soy products diverging in their chemical composition:screw-pressed soybean (SPS), solvent-extracted soybean (SES), and soy protein isolate (SPI). Samples were analysed for dry matter Table 1 Gross chemical composition of screw-pressed soybean meal (SPS), solvent-extracted soybean meal (SES), soy protein isolate and chestnut extract(CHE). Data are expressed in fresh material in g/kg. SPS SES SPI CHE Dry matter 904.4 877.5 941.4 906.5 Ash 56.6 64.5 45.3 9.3 Crude protein 451.7 441.8 864.3 9.9 Nitrogen 72.3 70.7 138.3 n.a. Ether extracts 55.1 20.4 30.3 n.a. Crude fibres 48.7 70.1 1.6 1.5 Hydrolysable tannins n.a. n.a n.a 560 Abbreviations: SPS = screw pressed soybean; SES = solvent extracted soybean; SPI = soy protein isolate; CHEs = chestnut extracts (DM) and ash content by grinding them to pass through a 1-mm screen, then heating at 105°C for 3 h, followed by dry-ashing at 550°C.The mineral content of the dry ashes was measured by an inductively coupled plasma optical emission spectrometer (ICP-OES, Optima7300 DV; Perkin-Elmer, Schwerzenbach, Switzerland) (European Standard EN 155510:2008). The crude protein (CP) content,calculated as nitrogen (N) x 6.25, where N was determined using the Dumas method (ISO, 2008). The ether extract (EE) was obtainedby petroleum ether extraction after acid hydrolysis (ISO, 1999), followed by the removal of the solvent under reduced pressure. Thecrude fiber (CF) content was determined gravimetrically (ISO, 2000) by incineration of residual ash after acid and alkaline digestionsusing a fiber analyzer (Fibretherm Gerhard FT-12, C. Gerhardt GmbH & Co. KG, Konigswinter, Germany). The HT content in the CHEwas determined as described by Johnson et al. (2014). The chemical composition of the SPS, SES, SPI and CHE samples was obtainedby two replicates and is reported in Table 1. 2.2. Digestion of the protein isolate and the soybean meal extracts using the INFOGEST protocol The CHEs (tannins 560 g/kg) were subjected to the in-vitro gastrointestinal INFOGEST protocol (Minekus et al., 2014). Theenzymatic activities and bile concentration were measured before the digestion experiment per the assays described in the harmonizedprotocol (Minekus et al., 2014). Each substrate of SPS, SES and SPI containing 0.04 g protein was digested without (SPS-, SES-,SPI-)and together with 30 g/kg, as fed CHE (SPS+, SES+, SPI+). This inclusion level was derived from a previous experiment withgrowing-finishing pigs in which the dietary supplementation of 30 g/kg CHE reduced the intestinal absorption of androstenone un-dergoing enterohepatic recirculation in entire male pigs (Tretola et al., 2019). In brief, 1 mL of water was added to each sample andmixed with 1 mL of simulated salivary fluid (pH 7) containing amylase (300 U/mL of digesta, Sigma-Aldrich Chemie GmbH, Buchs,Switzerland) for 2 min. Then, 2 mL of simulated gastric juice (pH 3) containing pepsin (2000 U/mL of digesta, Sigma-Aldrich ChemieGmbH, Buchs, Switzerland) were added and incubated for 120 min. Subsequently, 4 mL of simulated intestinal juice (pH 7) containingpancreatin (100 U trypsin activity/mL of digesta, Sigma-Aldrich Chemie GmbH, Buchs, Switzerland) and bile (2.5 mmol/L of totaldigesta, Sigma-Aldrich Chemie GmbH, Buchs, Switzerland) were added and incubated for 120 min. The digestion was performed at37 °C under constant gentle mixing on a rotating wheel. Digestion was stopped after 240 min using the protease inhibitor4-(2-aminoethyl)benzensulfonyl fluoride (AEBSF, trademark Pefabloc@, 500 mmol/L, Roche, Basel, Switzerland). Immediately afterstopping digestion, all samples were snap-frozen in liquid N and stored at - 20°C until further analysis. The digests were then split bycentrifugation (850 g x at 4 °C for 15 min) into a soluble and insoluble fraction by collecting the supernatant and the pellet,respectively. 2.3. In-vitro digestibility The determination of the DM and CP through in-vitro digestibility of SPI-, SPS-, SES-, SPI+,SPS+, and SES+ was performed induplicate. The heat-processed wheat was used as an internal control of the in-vitro digestion. The digestion enzymes alone have alsobeen used (or incubated and used) as blank, as described by Boisen and Fernandez (1997). Briefly, 1 g of each sample (SPS, SES and SPIwith or without CHEs, the heat-processed wheat and digestion enzymes alone) was mixed with 0.1 M phosphate buffer (pH 6.0).Subsequently, the pH of the solution was lowered with 10 mL of 0.2 M aqueous hydrochloric acid and then fine-adjusted to a final pH of2.0. Then, 1 mL of freshly prepared pepsin (P7000 Sigma-Aldrich, St. Louis, MO, USA) solution (10 mg mL-) was added. To minimizebacterial fermentation during digestion, a 0.5 mL chloramphenicol solution (5 mg mL-ethanol) was added to the mixture. The bottlewas placed in a shaking water bath at 39°C for 6 h (simulation of the gastric phase). Subsequently, 10 mL of 0.2 M phosphate buffer atpH 6.8 was added, followed by 5 mL of 0.6 M NaOH, and the pH was adjusted to 6.8 with 1 M HCl or 1 M NaOH. In addition, 1 mL offreshly prepared pancreatin (P3292; Sigma-Aldrich, Buchs, Switzerland) solution (50 mg/mL) was added to the mixture. The bottlewas placed in a shaking water bath at 39C for 18 h (simulation of the small intestinal phase). To enable the precipitation of undigestedsoluble proteins, 5 mL of 20% sulphosalicylic acid was added and the bottle was kept at room temperature for 30 min. The undigestedfraction (UF) was then collected in a filtration unit by using dried and pre-weighed glass filter crucibles (d: 3 cm; pore size: 40-90 pm)containing about 0.5 g Celite as a filter aid. All material was then transferred with 1% sulphosalicylic acid to the crucible. Afterconsecutive washings with 2×10 mL of ethanol and acetone, respectively, the undigested residues were dried at 80°C overnight. Thein-vitro DM and CP digestibility (IVDMD and IVCPD) was calculated as follows: IVDMD=(sample DM - sample UF of DM) / (sample DM)· IVCPD= (sample CP - sample UF of CP) / (sample CP)· 2.4. Quantification of polyphenols The polyphenol content in samples was quantified using Folin-Ciocalteu’s method, previously described by Singleton and Rossi(Singleton and Rossi, 1965), and applied with some modifications. The undigested samples (SPS, SES, SPI, and CHE) were solubilizedin HPLC-grade water (VWR International, Fontenay-sosu-Bois, France) to a final concentration of 5 mg/mL, sonicated and filtered with0.45 um PP filters (VWR International, Fontenay-sosu-Bois,France). The digested samples and the digestive fluids (used as blank) werecentrifugated at 10,000 g for 10 min and filtered with 0.45 um PP filters. Aliquots of 100 pL of suitably diluted samples, water ordigestive fluids (used for blank) were mixed with 0.5 mL of 0.2 N Folin-Ciocalteau's reagent (VWR International, Fontenay-sosu-Bois, France) and 0.4 mL of 7.5% Na2CO3(aq) (Sigma-Aldrich, St. Louis, USA). After 30 min in the dark, the absorbance was measured at765 nm in a UV-visible spectrophotometer (Varian Cary 50 SCAN, Palo Alto, California,USA) The polyphenol content was quantifiedusing a calibration curve of gallic acid (VWR International, Fontenay-sosu-Bois, France) (range: 5-50 ug/mL) and the results wereexpressed as equivalents of gallic acid (GAE) in mg/g. The interference of the digestive fluids used for in-vitro digestion in the finalquantification of polyphenols has been considered, subtracting the absorbance of the blank (containing only digestive fluids) from thatof the other samples. 2.5. Untargeted metabolomics 2.5.1. Sample preparation One mL of each sample after having been enriched with internal standard (proline D3, final concentration 0.1 ug/mL) was mixedwith 1 mL of cold extraction solvent (MeOH:H2O, 80:20). The sample was homogenized by vortex, and left 2 h under - 20°C,sonicated and centrifugated. 100 uL were resuspended in 900 mL of the initial HPLC mobile phase. The resultant solution was diluted(1:10) in the initial HPLC mobile phase (95% water acidified with 0.1% HCOOH and 5% methanol) and 5uL was injected. All sampleswere processed in two technical replicates. 2.5.2. HPLC-HRMS profiling and metabolomics approach All analyses were conducted by using Vanquish HPLC instrument (Thermo Fisher Scientific, San Jose, CA, USA) equipped with aRestek RP column. The separation gradient was HCOOH in water and methanol at 0.1%. HRMS determinations were set in positive and negative mode by using Exploris HRMS (Thermo Scientific, San Jose, CA, USA). Fullscan (FS) with resolving power 120.000 (two scan ranges of m/z 70-800 and 800-2500) was used for screening of compound profiles.Fragmentation was obtained with the following parameters: full scan data-dependent acquisition (FS-dd-MS2); resolving power60.000 and 17.500 for FS and dd-MS2 and collision energy (NCE) set at 20, 30, and 40 eV. Metabolomic workflow was obtained byusing Compound Discoverer (CD) 3.3 software (Thermo Fisher, MA, USA) for compound identifications and statistical evaluation asalso described in our previous researches (Pavlovic et al., 2020; Leoni et al.,2021). Putative identification of metabolites was obtainedby CD workflow chosen as a combination of a few different assets: a mzCloud match score higher than 80% and the same identificationbeing proposed by at least one external web database: Human Metabolome platform HMDB (https://hmdb.ca/),Kyoto Encyclopedia ofGenes and Genomes (KEGG), (https:// www.genome.jp/kegg), Pubchem (www.pubchem.com) or Small Molecule Pathway Database(SMPDB) (http://smpdb.ca). MzCLoud (https://www.mzcloud.org and Chempider https://www.chemspider.com), was also used torecognise compounds from procedural blank and medium, thus particularly critical for identification of polyphenolic and flavonoids. Ifmass fragmentation pattern did not correspond to any of databases software, manual verification of fragmentation pattern programwas achieved using ChemDrow software or it was compared with recent publications (Silva et al., 2021). Differential analysis wasperformed as a part of the CD workflow and the resulting statistical evaluation was expressed by Hierarchical Cluster processing,Principal Component Analysis, and Metabolic Pathway schematization. 2.6. Cell cultures The IPEC-J2 were maintained in DMEM/Ham’s F12 supplemented with 10% Porcine serum (Fisher Scientific, Leicestershire, VS),50 U/mL penicillin, and 50 U/mL streptomycin. Cells were differentiated on TranswellTM permeable support (Corning, New York,USA)as described previously (Schmidt et al., 2008). 2.7. Cytotoxicity of INFOGEST Digestive Juice and effects of digested CHE on IPEC-J2 viability Before running the proliferation and epithelial cell integrity assays, an evaluation of the toxicity of the digestive juice on the IPEC-J2 cells was tested. INFOGEST juice (without samples) was diluted in DMEM/Ham’s F12 supplemented with 1% porcine serum. Then,the different dilutions obtained were incubated with IPEC-J2 cells for 4 h and 24 h at 37 °C and 5% CO2. The viability of the cellsexposed to digestive INFOGEST juices was optically evaluated and further assessed using the 3-(4,5-dimethylthiazol-2-yl)- 2,5-diphenyl-2 H-tetrazolium bromide assay (Kumar et al., 2018). Culture of differentiated IPEC-J2 cells, was employed to determine changes in viability after addition of the SPI-, SPS-, SES-,SPI+,SPS+ and SES+ samples digested using the previously described INFOGEST protocol. The viability was tested by measuring theintegrity of the monolayer, determining the trans-epithelial electrical resistance (TEER) using an EVOM2 epithelial voltmeter (WorldPrecision Instrument, Sarasota, FL, USA). 2.8. Ex-vivo experiments on pig jejuna The Swiss Cantonal Committee for Animal Care and Use (Fribourg, Switzerland) approved all procedures involving animals(2018_30_FR). 2.9. Experiment 1: response of the jejunum to different digested CHE dilutions Seven Swiss Large White pigs housed at the Agroscope animal facilities were used. Only females were selected to avoid the sex effect. The pigs were reared in pens with the slatted metal floor, with ad libitum access to a low-crude-protein grower-finished diet andtap water. The ambient temperature was maintained at around 24°C. No welfare-related interventions were needed before, during,orafter the grower-finisher period. Animals were slaughtered at 171 ± 2.8 d of age (mean and SD) at the research station abattoir afterbeing fasted for approximately 15 h. Eight jejunal samples per pig were excised starting from the third meter distal to the pylorus. The outer muscular layer was strippedand then tissues were immediately mounted between the two halves of an Ussing chamber (Physiologic Instruments, San Diego, UnitedStates). Each segment was mounted in a different Ussing chamber and bathed on its mucosal and serosal surfaces (exposed area 1.0cm²) with the corresponding Kreb’s Ringier buffers (KRB). After a stabilization period of 30-40 min, two jejunal samples per pig were randomly assigned to one of the different dilutions (1:4,1:8, 1:16 in apical KRB) of digested CHE, apically added for 4 h. The remaining two jejunal samples per pig were used as a negativecontrol (KRB without CHE). These dilutions were chosen according to the cytotoxicity assay results obtained from the IPEC-J2 cells.For each CHE dilution and negative control, two replicates were used for each independent experiment. After a 30-40 min equili-bration period, the baseline of short-circuit current (Isc, in mV) values was measured. The TEER was also measured at 2 min intervalsunder current clamped conditions. The TEER was determined at an applied current of 100 mA, and the Isc was calculated using Ohm'slaw (R = V/I). Active uptake was evaluated according to electrical changes in the Isc. The total active transport through the tissue wasverified by monitoring the change in Isc (AIsc), which was representative of ion flux, and thus, active transport within the jejunaltissue. After a run of 4 h, forskolin (10 umol/L,Sigma-Aldrich, St. Louis, MO, USA) was added to the apical compartment to test tissueviability. Data obtained from tissues not responding to forskolin were excluded from statistical analysis. Then, at the end of theexperiment, tissues were transferred into CellLytic MT (Sigma-Aldrich, St. Louis, MO, USA) complemented with protease inhibitors forsubsequent analysis of TJ gene expression. 2.10. Experiment 2: evaluation of the effects of digested CHE on intestinal epithelial integrity in jejunum segments incubated withindomethacin For this second ex vivo experiment, eight jejunal tissues from seven pigs of the same breed, sex, and BW described in Experiment 1were used. After a stabilization period of 30 min, two jejunal samples per pig were randomly assigned to one of the four apicaltreatments: i) dilution 1:16 (in apical KRB) of digested CHE for 3 h. ii) dilution 1:16 in combination with the indomethacin (INDO, 250umol * L-l) dissolved in apical KRB. iii) negative control group (KRB without CHE and/or INDO). iv) positive control group (KRB withINDO only). The TEER was continuously measured as described in Experiment 1. 2.11. Western blots The cells and tissues collected in the in-vitro and ex-vivo experiments were lysed in CelLytic M and CelLytic MT (Sigma-Aldrich,Buchs, Switzerland), respectively, complemented with protease inhibitors. After centrifugation at 12,000 g x at 4 °C for 10 min, theprotein concentration in the supernatant was determined with Coomassie Plus Assay Reagent (Thermo Scientific, Waltham, USA).Absorbance was read on an Asys UVM 340 microplate reader (Biochrom, Cambridge, UK). Of the total protein extracts, 20 ug weredenatured at 95 °C for 5 min, separated via 7% or 10% SDS-PAGE gel (polyacrylamide: 30% [w/v], acrylamide: 0.8% [w/v] andbisacrylamide [37.5:1]); 1.5 M Tris HCl, pH 8.8; 0.4% sodium dodecyl sulfate; 10% ammonium persulfate; and 0.01% tetramethy-lethylenediamine. Proteins were then blotted on a WesternBright (polyvinylidene difluoride) membrane (Witec, Luzern, Switzerland)at 90 V for 90 min using the Bio-Rad Trans-Blot Turbo Transfer System (Bio-Rad, Hercules, USA). The membranes were blocked for 60min at room temperature with 1x phosphate-buffered saline supplemented with 0.1% Tween 20% and 5% bovine serum albumin(BSA). Membranes were further incubated at 4°C overnight in the same buffer with primary antibodies (ZO1, OCLN, and CLDN1,Abcaam, C riidge, UK, and Vinculin, Sigma-Aldrich, St.Louis, USA) at the appropriate dilutions. Once washed, membranes wereincubated with diluted goat-anti-rabbit or goat-anti-mouse HRP-conjugated (Sigma-Aldrich, St.Louis, USA or in phosphate-bufferedsaline containing 0.1% Tween 20% and 5% milk powder. Signals were revealed using a Quantum Kit (Witec, Luzern, Switzerland) andquantified with Syngene G: BOX and Gene Tools software (Syngene International Ltd., Bangalore, India). The vinculin signal was usedto normalize the relative abundance of tight junctions proteins, its signal being constant between animals and experimental conditionsconsidered (data not shown). 2.12. Statistical analysis The sample size was justified by statistical power analysis using SYSTAT (2018) (Wilkinson, 2010). The main parameter used wasarginine (Arg)-induced AIsc in jejunal tissues. These values were obtained by a similar study performed on jejuna in Ussing chamberswhere the absorption of Arg after gallic acid incubation was tested (Tretola et al., 2021). The other parameters included for the poweranalysis were: statistical model= one-way ANOVA, number of groups =3, standard deviation = 0.13, significance level=0.05,powerthreshold=80% and effect size =0.97. Using these parameters, a sample size of five samples per treatment was requested to test ordisprove the hypothesis. The data were analyzed using SPSS (IBM, 2016) and are presented as mean ± SEM. The in-vitro results were obtained by threetechnical replicates in three independent experiments. For the Ussing-chamber experiments and the related Western Blot analysis,results were obtained from five experimental units for the dilution (1:8) and six for the remaining treatments. For the ex-vivoExperiment 2, the results were obtained from five animals per group. The data were tested for normality using the Shapiro-Wilk test and analyzed using the ANOVA procedure. Specifically, to compare the effect of CHE inclusion on substrates’ in-vitro digestibility,one-way ANOVA was performed (a=0.05), followed by the posthoc Tukey test. The statistical analysis for the Ussing chamber experiments was performed with the nonparametric Mann-Whitney U test, as thedata were not normally distributed. Data were tested with a mixed linear model in which the pig was considered a random effect anddata were Bonferroni corrected. When necessary, a repeated measurement analysis has been performed. Differences between thecontrol and treatment groups were considered significant at P <0.05. 3. Results 3.1. Chemical composition of soybean-based meals and CHE The processing technique of the SPS, SES and SPI meals strongly affected their chemical composition (Table 1). The CP of the SPIwas twice as high compared to the SES and SPS. The level of EE was greater in the screw pressed SPS meal compared to the SES and SPI,while the solvent extract (SES) had a higher amount of crude fiber compared SPS and SPI meals. CHE had low ash and CP content, asimilar CF content compared to the SPI but, as expected, a high amount of HT (Table 1). 3.2. In-vitro digestion of soybean derived products with and without CHE The addition of CHE reduced both the IVDMD and IVCPD independently of the substrate (Table 2). However, both the IVDMD andIVCPD were reduced to a greater extent when CHE was added to SPI (-8.1% and -8.2%, respectively) compared to SES (-7.2% and-5.5%) and SPI (-3.2% and -2.3%) (D× C interaction,P<0.05). 3.3. Polyphenol quantification after INFOGEST in-vitro digestion After INFOGEST in vitro digestion, the polyphenol content of SPS, SES, and SPI decreased between - 7.0 and - 17.6% (Table 3).However, the highest total polyphenol content in digested samples was observed in the CHE (88.6±12.6 mg/g), even if those valueswere reduced by - 83% after in-vitro digestion. Similar range of reductions were observed when CHE was added to the soya-basedmeals. 3.4. Metabolomics profile of digested Soy extracts The preliminary analysis of the digestive fluid itself has confirmed this matrix as a complex one that influenced the metabolomicprofile of investigated samples. Therefore, the metabolomics workflow was divided into two steps: (I) complete CD analysis of samplesincluding the signals that derive from the digestive fluid. (II) limited CD analysis of samples subtracting digestive fluid substances. Thefirst approach revealed a total of 438 signals whose relative ratio is presented by the heatmap (Fig. 1 A) and PCA score (Fig. 1B).The SPI- and SPI+ resulted as the samples with the highest concentration of metabolites, while CHE presented the lowest overall concentration (Fig. 1 A). The SPS+ differed significantly from SPS- and was closer to CHE (Fig. 1B). Other groups were more homogeneous regarding CHE addition (Fig. 1 A). After having analyzed all signals, the putative identi-fication of the most abundant signals was performed, followed by the semi-quantitative evaluation of expressed IS equivalents(Supplementary table S1). As it can be noticed the group of the amino acids was the most abundant class: 16 proteogenic amino acidswere identified with arginine, leucine, phenylalanine, tryptophan, tyrosine, and valine as the most abundant while 38 di/tripeptideswere identified unambiguously (Supplementary table S1). In addition, among the initial 438 signals, a cohort of more than 200peptides'structures was established, but with the CD-workflow their sequence and full identification couldn’t be achieved probablybecause of the interfering signals of the digestive fluids. The CD-workflow gave limited information about the polyphenolic and flavonoids identification due to high interfering signals Table 2 Effects of 30 g/kg, as fed supplemented chestnuts extract (CHE) on in vitro digestibility of the DM (IVDMD) and CP (IVCPD) of soybean meal productsand soy protein isolate. Treatment° Item SPS SES SPI SEM P-value” 十 十 一 十 S C SxC IVDMD 0.736° 0.656° 0.762° 0.691d 0.901° 0.869f 0.007 <0.05 <0.05 <0.05 IVCPD 0.911 0.829” 0.903° 0.848° 0.913 0.891° 0.001 <0.05 <0.05 <0.05 Values are reported as mean values and standard errors of the means. Different letters in a row indicate significant differences (P<0.05) aSPS-: screw-pressed soybean meal without CHE; SPS+ :screw-pressed soybean meal with 30 g/kg, as fed CHE; SES-: solvent-extracted soybeanwithout CHE; SES+: solvent-extracted soybean with CHE 30 g/kg, as fed; SPI-: soy protein isolate without CHE; SPI+: soy protein isolate with 30 g/kg, as fed CHE DS = substrate (SPS, SES, SPI); C = CHE supplementation (+,-) Table 3 The level of polyphenols expressed as mg ellagic acid equivalents/g in the undigested and after in vitro digestion with the INFOGEST procedure ofscrew-pressed soybean meal (SPS), solvent-extracted soybean meal (SES) and soy protein isolate (SPI) un-supplemented or supplemented withchestnut extract (CHE;-/+). Experimental data are expressed as means ± standard deviations. SPS SES SPI CHEs 一 十 一 十 一 十 mg EAG/g Undigested 4.0±0.6 18.8* 3.3±0.3 18.1* 6.1±0.7 20.8* 511.1±27.8 Digested 3.3±0.3 6.1±0.6 3.1±0.4 5.8±0.8 5.7±0.5 8.2±0.2 88.6±12.6 Variation (%)² -17.6 -67.5 -7.61 -68.2 -7.00 -60.3 -82.7 mg EAG/g CHE Undigested 一 8 14.8 一 14.7 一 Digested 一 2.8 一 2.7 2.6 一 Variation (%) -81.1 -81.8 -82.3 一 Abbreviations: SPS =screw pressed soybean; SES =solvent extracted soybean; SPI= soy protein isolate; CHEs =chestnut extracts.EAG: equivalents of ellagic acid 2% change in the level of EAG compared to the undigested sample 3% change in the level of polyphenols espressed as ellagic acid equivalents/g compared to the undigested sample. The level of polyphenols in theundigested SPS+ , SES+ and SPI+ samples were calculated data based on the polyphenol content of the SPS-, SES- and SPI-samples and the poly-phenol content of 30 g/kg, as fed CHE supplementation Except for the calculated values, results are expressed as the average ± SD of 3 technical repetitions from the digestive fluids. Consequently, a CD-identification strategy that removed the digestive fluids background was applied. In thismanner, it was possible to distinguish the most relevant flavonoids structures with a high level of confirmation certainty. This enabledthe reconstruction of two metabolic pathways: 1) genistein precursors and metabolite interrelationship (Supplementary Fig. S1,Table 4) and 2) daidzein-formononetin conversion (Supplementary Fig. S2, Table 5). 3.5. Cytotoxicity and functional assessment of INFOGEST digesta on IPEC-J2 No effects of the five dilutions of the INFOGEST digestive juices on IPEC-J2 viability were observed after 4 h (Fig. 2 A). By contrast,after 24 h the 1:2 (v/v) dilution reduced P=0.001) whereas the 1:4 (v/v) dilution increased (P =0.01) the cell viability. The 1:8,1:16, and 1:32 (v/v) dilutions did not change the viability compared to the control (Fig. 2B). Consequently, the ratio of 1:8(v/v)digestion juice/medium was chosen as the optimal dilution rate for further assays. After full differentiation, digested CHE diluted in culture medium at ratios of 1:8, 1:16, and 1:32 (v/v) were added to the apicalchamber and further incubated with cell monolayer for 24 h. As a measure of monolayer integrity, the TEER was monitored before(t= 0 h) and after incubation (t=24 h). Compared to the control (586.7±76.4 Q/cm), the TEER expressed as a percentage of initialvalues at t =0 h incubation was not altered by the three dilutions (Fig. 2C). 3.6. Ex-vivo mucosal electrolyte transport of digested CHE The Isc was monitored as a measure of net electrolyte transport across the tissue. In all samples, a consistent increase in Isc over thewhole experiment was observed (Fig. 3 A). Compared to the control, the three dilution levels of digested CHE induced no changes inthe Isc suggesting a poor or absent ion-mediated active transport of digested CHE polyphenols from the mucosal to the basolateral sideof the pig jejunal segments. 3.7. Trans-epithelial resistance in jejuna incubated with digested CHEs After 60 min but not after 120 and 180 min incubation, the 1:4 (v/v) dilution of digested CHE increased (P=0.03) the TEER valuesof the jejunum compared to the tissues incubated with 1:16 (v/v) dilution, with intermediate TEER values for the 1:8 and control(CTRL) groups (Fig. 3B). The repeated measurement analysis revealed no differences in the jejunal TEER within groups over the entire experimental timecourse. 3.8.7Tight junction protein expression in jejuna On the same tissues utilized for monitoring Isc and TEER over time, the expression of TJ proteins CLDN1, ZO1 and OCLN wereinvestigated. None of the tested digested CHE dilutions affected the protein expression of CLDN1 (Fig. 3 C). However, compared to thecontrol and the 1:4 (v/v) dilution, the 1:8 (v/v) dilution increased (P <0.05) the protein expression of both ZO1 and OCLN (+60%),while the 1:16 (v/v) dilution only doubled (P <0.05) the expression of the ZO1 protein. Fig.1. A) Hierarchical cluster analysis for the 458 signals. Each metabolite is represented by a row and each sample (two replicates per sample) by acorresponding column. The heatmap reflects the differences between the relative amount through normalized chromatographic peak areas betweenthe screw-pressed soybean meal without chestnut extract (CHE) (SPS-), screw-pressed soybean meal with 30 g/kg, as fed CHE (SPS+), solvent-extracted soybean meal without CHE (SES-), solvent-extracted soybean meal with 30 g/kg, as fed CHE (SES+), soy protein isolate without CHE(SPI-) and soy protein isolate with 30 g/kg, as fed CHE (SPI+). The z-color scale indicates normalized peak area value. Red and green coloursindicate lower and greater metabolite abundance, respectively. B) Principal Component Analysis (PCA) projection on the distribution of samples ofthe screw-pressed soybean meal without chestnut extract (CHE) (SPS-), screw-pressed soybean meal with 30 g/kg, as fed CHE (SPS+), solvent-extracted soybean meal without CHE (SES-), solvent-extracted soybean meal with 30 g/kg, as fed CHE (SES+), soy protein isolate without CHE(SPI-) and soy protein isolate with 30 g/kg, as fed CHE (SPI+) concerning PC-1 with PC-2 when signals of 458 detected compounds were used. 3.9. Effect of digested CHE on the indomethacin-induced effect on TEER in jejuna Given the highest change in ZO1 expression evoked by luminal application of the 1:16 (v/v) dilution of digested CHE, this dilutionwas chosen to test the hypothesis of a protective effect of digested CHE against the detrimental effects of INDO on jejunum perme-ability (Fig.4). The INDO-incubated tissues showed lower (P=0.02) TEER values compared to untreated jejunal samples. However,when tissues were incubated with both INDO and digested CHE (1:16 (v/v) dilution), no differences were observed compared to thecontrol. Table 4 Genistein precursors and metabolites semi-quantification. Data are presented as Internal standard IS equivalents (ug/mL; mean ± SD for 2 replicates). Treatment SPS SES SPI CHE Item 十 十 十 Genistein 0.281±0.02 0.243 0.207 0.591 0.05±0.022 0.308 0.008±0.01 ±0.082 ±0.058 ±0.078 ±0.042 Apigenin 0.034 0.021 0.019 0.069 0.037 ±0.009 ±0.002 ±0.002 ±0.012 ±0.012 Prunetin 0.004 0.007 0.006 0.011 0.001 ±0.001 ±0.005 ±0.001 ±0.003 ±0.002 Biochanin A 0.005 0.009 0.007 0.013 一 0.004 0.001 ±0.002 ±0.004 ±0.002 ±0.005 ±0.002 ±0.001 Naringenin 0.006 0.002 0.009 0.014 0.003 一 ±0.002 ±0.001 ±0.002 ±0.003 ±0.003 Dalbergioidin 0.004 0.004 0.005 0.009 0.003 0.004 0.003 ±0.001 ±0.001 ±0.003 ±0.006 ±0.001 ±0.001 ±0.002 2,4',7-Trihydroxyisoflavone 0.003 0.004 0.002 0.007 一 0.003 ±0.001 ±0.003 ±0.001 ±0.002 ±0.001 2,5,7-Trihydroxy-4'- 0.007 0.018 0.016 0.026 一 0.002 methoxyisoflavanone ±0.002 ±0.008 ±0.022 ±0.012 ±0.001 Abbreviations: SPS = screw pressed soybean; SES = solvent extracted soybean; SPI = soy protein isolate; CHEs = chestnut extracts. Table 5 Daidzein-formononetin and their metabolites semi-quantification. Data are presented as Internal standard IS equivalents (ug/mL; mean ± SD for 2replicates). SPS SES SPI CHE Item 一 十 一 十 二 十 Daidzein 0.585±0.018 0.171±0.052 0.361±0.063 0.433±0.08 0.528±0.002 0.562±0.05 0.121±0.012 Hydroxyhydrodaidzein 0.011±0.003 0.006±0.001 Hydroxydaidzein 0.006±0.002 0.001±0.005 0.161±0.081 0.011±0.001 0.006±0.001 0.006±0.003 一 Formononetin 0.001±0.001 一 0.002±0.002 0.003±0.001 一 一 2-hydroxyformononentin 0.003±0.002 0.001±0.001 0.009±0.002 0.003±0.003 0.002±0.003 0.002±0.002 一 SSP-: screw-pressed soybean meal without CHE; SSP+: screw-pressed soybean meal with 30 g/kg, as fed CHE; SES-: solvent-extracted soybeanwithout CHE; SES+: solvent-extracted soybean with 30 g/kg, as fed CHE; SPI-: soy protein isolate without CHE; SPI+ : soy protein isolate with 30 g/kg, as fed CHE Data (average ± SD) are presented as internal standard (IS) equivalents (ug/mL). Each s; media ± SD for 2 replicates). 4. Discussion 4.1. Effects of CHE on the IVD of soybean-derived products The main goals of this study were to investigate the effects of CHE on the IVD of three different soybean-based sources, the amountof total polyphenol and metabolites released by those meals, and the effects of CHE-derived polyphenol on epithelial barrier functionsin pig jejunum. The SPI- showed the highest IVDMD and IVCPD values. As reported elsewhere (Zhang et al., 2018) the commercial foodgrade SPI is usually heated at high temperatures of approximately 100°C and the heating process greatly increases the surface hy-drophobicity of the protein (Sorgentini et al., 1995). The same author (Zhang et al., 2018) observed a slight increase in the release oftrichloroacetic acid soluble nitrogen during the digestion process in 100 °C-heated SPI compared to untreated SPI, probably because ithad the highest DM and CP content, respectively, compared to SPS- and SES-. The lowest IVDMD was observed in SPS. Screw pressingtypically consist in a mechanical process, the soybeans are cracked, dried, heated and fed to a mechanical press (screw press), then theresulting flakes are dried and ground. The entire process inactivates the anti-nutritional properties of raw soybeans. While in thesolvent extraction process, soybeans are cracked, heated, flaked, and passed through an expander. The expander produces a porouspellet with increased cell rupture and greater density. This makes oil extraction by solvent easier (Dunford, 2012). More severetechnical treatment of solvent extraction process might positively affect the nutrient modification and in turn in vitro digestibility ofsoybean. However, the slight difference (<3%) in in vitro DM digestibility might be interaction between original chemical compositionand technical treatment., likely due to screw pressing, given that the DM, ash, and CF content do not explain the obtained result.Although statistical difference have been observed in term of in vitro CP digestibility among three tested soybean based matrix thedifference might be considered negligible, since difference were less than 1% out of over 90% in in vitro CP digestibility in all, SPS, SESand SPI. A 140 B Dilution ration (juice to medium ratio, v/v) C Dilution ration (juice to medium ratio,v/v) Fig. 2. The effect of digestive juice dilution (control = medium without digestion juices, 2=1:2,4=1:4,8=1:8,16=1:16 and 32=1:32) on cellviability (expressed as % of the control). The IPEC-J2 cells were incubated for 4 h (A) and 24 h (B) with digestive fluids obtained from INFOGEST in-vitro digestion. Juices did not contain chestnut extracts. Values are means with their standard deviations. C) change in trans-epithelial electricalresistance (TEER; expressed as % change relative to the control) after 24 h incubation of the digested CHE with the IPEC-J2 culture. The TEER valuesare expressed as a percentage of the initial values at t=O h. Dilutions of the digested samples (control = no digested samples, 8=1:8,16=1:16and 32=1:32) were chosen based on the results of the cytotoxicity of the INFOGEST digestive juice. Results are based on three technical replicatesof three independent experiments. Error bars represent standard deviation. animals (Redondo et al., 2014). Their ability to bind dietary proteins and digestive enzymes (Redondo et al., 2014) could have led tolower bioavailability of dietary proteins and a block of the enzymes'catalytic sites and their activity, resulting in decreased in-vitronutrient digestion. However, the impact of the CHE on both the IVDMD and IVCPD differed among the sources, as the extent of thedecrease in IVD was greater in SPS compared to SES and SPI. One might hypothesize that these differences were due to different levelsof CP, as CHE-derived polyphenols are known to interact with proteins. However, the CP level of SPI was twice as great as the CP levelof the other two sources; whereas, the CF level was up to seven times lower in the SPI than the SPS and SES. For this reason, anexplanation could be found in the potential inhibitory effects of the CHE on lipase contained in the pancreatic enzymatic componentsinvolved in the hydrolysis of the EE (Pinto et al., 2021). Further investigations are needed to clarify the inhibitory effects of CHEinclusion in different meals with different chemical compositions and processing. 4.2. In-vitro digestion and polyphenol quantification A Fig. 3. A) Changes in the short current circuit (Isc, expressed as % change of the control) after 4 h evoked by luminal application of 1:4, 1:8, and1:16 dilutions of digested chestnut extracts (CHE) (v/v) (sample to apical Kreb’s Ringier buffers) to the porcine intestinal mucosa. Values arepercentages of the control with their standard errors of five independent experiments. B) Changes in trans-epithelial resistance (TEER; expressed as% of the basal TEER) induced by luminal application of three dilutions (4=1:4;8=1:8; 16=1:16) of digested chestnut extracts (CHEs, v/v)(sample to apical Kreb’s Ringier buffer) to the porcine intestinal mucosa. Different letters indicate a significant (P <0.05) statistical difference. Datafor each dilution were obtained in five (n=5) independent experiments. C) Tight junction protein induction fold in tissue incubated for 180 minwith three digested chestnut extracts (CHEs) dilutions (4=1:4; 8=1:8;16=1:16 v/v sample to apical Kreb’s Ringier buffer). CLDN1: claudine-1;ZO1: zonula occludens-1; OCLN: occludin. Data are ls-means ± standard deviations. Data were obtained by at least five independent experiments. extent this structure is changed after digestion. This would help to understand why the bioavailability of CHE compared to soybeanproducts’ polyphenols is low and why the IVD of SPI, SPS and SES differed. Different studies revealed that digestion, especially duringthe intestinal phase, could affect both the stability and bioavailability of polyphenols. As shown by Gunathilake et al. (2018) significantpH changes, body temperature and gut microbiota composition can alter the chemical structure of the phenolic compounds, togetherwith the activity of the digestive enzymes that can accelerate the HT hydrolysis during digestion. The spectrophotometric method usedfor the quantification of phenolic compounds is a useful tool for the rapid evaluation of total phenolic content; however, it cannotprovide information about the chemical structures of the metabolites present in samples after in-vitro digestion. Thus, the detectionlimit of the technique used in this study for polyphenol quantification after digestion must be considered, given its limitation. 4.3. Metabolic profile of in vitro digested soy-based substrates with or without chestnut -●- CTRL-INDO--HT16→◆-HT16/INDO Fig. 4. Effect of indomethacin (INDO, 250 pM) on the barrier function of pig jejunum and protection by digested CHE at a 1:16 dilution (v/v)(sample to apical Kreb’s Ringier buffer). 16/INDO = digested CHE diluted 1:16 (v/v) (sample to apical Kreb’s Ringier buffer) in the presence ofindomethacin; 16=digested CHE diluted 1:16 (v/v). isoflavones, in accordance with previous reports in the literature on soybeans and soy products (Ho et al., 2002; Lee et al., 2015). Tonote that CHE increased the amount of genistein in SPI+ and SES+ but not in SPS+ samples. By contrast daidzein level remainedunchanged between SP- and SPI+ and SES-and SES+ whereas the level decreased SPS+ compared to SPS-samples. Summarizing, CHEdecreased the nutritional properties of SPS and the bio-accessibility of specific isoflavones after digestion. 4.4. Chestnut-derived metabolites and intestinal epithelial integrity In this study, we used CHE-derived metabolites obtained after gastric and small intestinal in-vitro digestion to determine theireffects on epithelial integrity and their potential protective effects. An intact intestinal barrier is mainly related to a correct expressionof TJ proteins, which can separate the intestinal lumen by the systemic compartment of the organism, blocking the paracellularpenetration of potentially dangerous microorganisms or toxins (Wijtten et al., 2011). The alteration of this epithelial integrity rep-resents a well-known risk factor for several intestinal diseases that could lead to reduced overall health (Wijtten et al., 2011). Amongthe proteins involved in the formation of the tight junctions, the CLDN1, OCLN, and ZO1 proteins are probably the most investigated.In accordance with the literature (Tretola et al., 2021), an acute exposition to a mixture of polyphenols obtained by in-vitro-digestedCHE affected both the TEER and the expression of the selected proteins involved in TJ formation. Specifically, the 1:4 (v/v) dilutionincreased the TEER values after 60 min of treatment, compared to the control group, while the 1:8 (v/v) and 1:16 (v/v) dilutionsincreased the protein expression of both Z01 and/or OCLN but not the TEER. It is not clear why increased protein expression of ZO1and OCLN observed in the small intestine incubated with the 1:8 and 1:16 dilution does not correspond to an increased TEER in theUssing-chamber experiment. An explanation could be related to the regulation of TJs via ion channels. It has been demonstrated thatthe sodium-hydrogen exchanger (NHE) family can regulate paracellular barrier functions and TJ function ex vivo by binding the actincytoskeleton (Slifer and Blikslager, 2020). Similarly, we recently found that only low concentrations of punicalagin and gallic acid canmodulate the expression of different intestinal transporters both in vitro (Biolley et al., 2019) and ex vivo (Tretola et al., 2021). Thesedata suggest that the lowest concentrations of CHE-derived polyphenols indirectly increased TJ protein expression without affectingthe TEER of jejuna segments because of their effects on other mechanisms that increased the epithelial membrane permeability, such asan increased expression of members of the NHE protein family. The higher Zo1 and OCLN protein expression observed in this studycould also explain the protective effects of the polyphenol mixture in the jejunal segments exposed to INDO. This conclusion can bedrawn from the fact that intragastric INDO administration in vivo increased the intestinal paracellular permeability, which is mainlydetermined by TJ integrity (Gotteland et al., 2001). In our study, INDO decreased TEER in the jejunum, but this effect was counteractedby the presence of CHE-derived polyphenols, consistent with the higher Z01 protein expression observed. These results suggest aprotective role of digested HT against the action exerted by INDO in pigjejunum samples. Similar results have already been observed inCaco-2 cells exposed to INDO, where polyphenols protected the epithelial barrier function through the increased expression of OCLNand ZO1 proteins (Carrasco-Pozo et al., 2013). It is important to note that this protective effect has been tested with the lowestconcentration of polyphenols (1:16 dilution), since concentrations of polyphenols in the swine or human colon tend to be low due tomodification by commensal microbiota. In addition, the highest change in TJ protein expression, specifically that of Z01, was evokedby luminal application of the lowest concentration of digested CHE. These results suggest that CHE, once digested, could exert pro-tective effects against functional damage induced by external factors, such as INDO. 5. Conclusions Chestnut extracts exert some anti-nutritional effects on the feed digestibility when included at 30 g/kg, as fed in soy-based meals.Their effects on the in-vitro digestibility vary according to the chemical composition of the meal. The chestnut extracts are animportant source of polyphenols, and digestive processes affect their bioavailability. The chestnut extracts also influence the aminoacids profile of the soy-based product depending on the processing conditions. The bio-accessible polyphenols after chestnut extractsin-vitro digestion exert protective effects on the intestinal epithelial cell integrity ex vivo when used at low concentration. Furtherstudies are necessary to clarify the involvement of the chestnut extracts -derived polyphenols on paracellular permeability when notaffected by tight junction proteins. Ethics approval The Swiss Cantonal Committee for Animal Care and Use (Fribourg, Switzerland) approved all procedures involving animals(2018_30_FR). Financial support statement This research received no specific grant from any funding agency or commercial or not-for-profit sectors. CRediT authorship contribution statement Marco Tretola: Conceptualisation, investigation, methodology, data curation, writing-original-draft preparation. Paolo Silacci:Conceptualisation, visualization, Writing- Reviewing and Editing, supervision and validation. Raquel Sousa: methodology, datacuration. Francesca Colombo: methodology, data curation. Sara Panseri: methodology, data curation. Matteo Ottoboni: meth-odology, data curation. Luciano Pinotti: Reviewing, Editing, visualization. Giuseppe Bee: Conceptualisation, Writing- Reviewingand Editing, supervision and validation. All the authors have read and agreed to the published version of the manuscript. Data Availability Raw data is available upon request. Acknowledgements The authors would like to thank Claudine Biolley, Tamara Gobet, and Carmen Vonnez for their precious help with laboratoryanalysis and tissue collection. Declaration ofinterest None. Authors statement All recommendations from the editor and the reviewers were taken into account. In the revised version, the changes are marked inyellow to make the review process easier for the editor and the reviewers. Appendix A. Supporting information Supplementary data associated with this article can be found in the online version at doi:10.1016/j.anifeedsci.2022.115501. References Aires, A., Carvalho, R., Saavedra, M.J., 2016. Valorization of solid wastes from chestnut industry processing: extraction and optimization of polyphenols, tannins andellagitannins and its potential for adhesives, cosmetic and pharmaceutical industry. Waste Manag 48, 457-464. Amasheh, M., Schlichter, S., Amasheh, S., Mankertz, J., Zeitz, M., Fromm, M., Schulzke, J.D., 2008. Quercetin enhances epithelial barrier function and increasesclaudin-4 expression in Caco-2 cells. J. Nutr. 138, 1067-1073. Biolley, C., Tretola, M., Bee, G., Jud, C., Silacci, P., 2019. Punicalagin increases glutamate absorption in differentiated Caco-2 cells by a mechanism involving geneexpression regulation of an EAAT3 transporter. Food Funct. 10, 5333-5338. Blomhoff, R., Carlsen, M.H., Andersen, L.F., Jacobs, D.R., 2006. Health benefits of nuts: potential role of antioxidants. Br. J. Nutr. 96, S52-S60. Boisen, S., Fernandez, J., 1997. Prediction of the total tract digestibility of energy in feedstuffs and pig diets by in vitro analyses. Anim. Feed Sci. Technol. 68,277-286. Carrasco-Pozo, C., Morales, P., Gotteland, M., 2013. Polyphenols protect the epithelial barrier function of Caco-2 cells exposed to indomethacin through themodulation of occludin and zonula occludens-1 expression. J. Agric. Food Chem. 61, 5291-5297. Cires, M.J., Wong, X., Carrasco-Pozo, C., Gotteland, M., 2017. The gastrointestinal tract as a key target organ for the health-promoting effects of dietaryproanthocyanidins. Front. Nutr. 3, 57. Di Lorenzo, C., Badea, M., Colombo,F., Orgiu, F., Frigerio, G., Pastor, R.F., Restani, P., 2017. Antioxidant activity of wine assessed by different in vitro methods. BIOWeb of Conferences. EDP Sciences, p. 04008. Dunford, N.T., 2012. Food and Industrial Bioproducts and Bioprocessing. John Wiley & Sons, Stillwater, Oklahoma, USA. Egger, L., Menard, O., Baumann, C., Duerr, D., Schlegel, P., Stoll, P., Vergeres, G., Dupont, D., Portmann, R., 2019. Digestion of milk proteins: comparing static anddynamic in vitro digestion systems with in vivo data. Food Res. Int. 118,32-39. Girard, M., Bee, G., 2020. Invited review: tannins as a potential alternative to antibiotics to prevent coliform diarrhea in weaned pigs. Animal 14, 95-107. Gotteland, M., Cruchet, S., Verbeke, S., 2001. Effect of Lactobacillus ingestion on the gastrointestinal mucosal barrier alterations induced by indometacin in humans.Aliment. Pharmacol. Ther. 15, 11-17. Gunathilake, K., Ranaweera, K., Rupasinghe, H., 2018. Change of phenolics, carotenoids, and antioxidant capacity following simulated gastrointestinal digestion anddialysis of selected edible green leaves. Food Chem. 245, 371-379. Ho, H.M., Chen, R.Y., Leung, L.K., Chan, F.L., Huang, Y., Chen, Z.-Y., 2002. Difference in flavonoid and isoflavone profile between soybean and soy leaf. Biomed.Pharmacother. 56, 289-295. IBM, 2016. IBM SPSS Statistics for Windows, Version 24.0, Google Search, Armonk, NY, USA: IBM Corp. ISO, 1999. Animal Feeding Stuffs: Determination of Fat Content. International Organization for Standardization, 6492:1999. Geneve, Switzerland. ISO, 2000. Animal Feeding Stuffs-Determination of Crude Fibre Content, International Organization for Standardization Publ. Geneva, Switzerland. ISO, 2008. Food products-determination of the total nitrogen content by combustion according to the Dumas principle and calculation of the crude protein content.Oilseeds and animal feeding stuffs, 16634-16631. Geneve, Switzerland. Johnson, M.T., Ives, A.R., Ahern, J., Salminen, J.P., 2014. Macroevolution of plant defenses against herbivores in the evening primroses. N. Phytol. 203,267-279. Kumar, P., Nagarajan, A., Uchil, P.D., 2018. Analysis of cell viability by the MTT assay, in: Green M.R., Sambrook, J. (Eds.), Cold Spring Harbor Protocols, New York,USA. doi:10.1101/pdb.prot095497. Lee, M.J., Chung,I.-M., Kim, H., Jung, M.Y., 2015. High resolution LC-ESI-TOF-mass spectrometry method for fast separation, identification, and quantification of 12isoflavones in soybeans and soybean products. Food Chem. 176, 254-262. Minekus, M., Alminger, M., Alvito, P., Ballance, S., Bohn, T., Bourlieu, C., Carriere, F., Boutrou, R., Corredig, M., Dupont, D., Dufour, C., Egger, L., Golding, M.,Karakaya,S., Kirkhus, B., Le Feunteun, S., Lesmes, U., MacIerzanka, A., MacKie, A., Marze, S., McClements, D.J., Menard, O.,Recio,I., Santos, C.N., Singh, R.P., Vegarud, G.E., Wickham, M.S.J., Weitschies, W., Brodkorb, A., 2014. A standardised static in vitro digestion method suitable for food-an international consensus.Food Funct. 5,1113-1124. Pinto, D., Silva, A.M., Freitas, V., Vallverdu-Queralt, A., Delerue-Matos, C., Rodrigues, F., 2021. Microwave-assisted extraction as a green technology approach torecover polyphenols from castanea sativa shells. ACS Food Sci. Technol. 1, 229-241. Redondo, L.M., Chacana, P.A., Dominguez, J.E., Fernandez Miyakawa, M.E.D., 2014. Perspectives in the use of tannins as alternative to antimicrobial growthpromoter factors in poultry. Front. Microbiol. 5, 118. Reggi, S., Giromini, C., Dell'Anno, M., Baldi, A., Rebucci, R., Rossi, L., 2020. In vitro digestion of chestnut and quebracho tannin extracts: antimicrobial effect,antioxidant capacity and cytomodulatory activity in swine intestinal ipec-j2 cells. Animals 10 (2), 195. Schmidt, L.D., Kohrt, L.J., Brown, D.R., 2008. Comparison of growth phase on Salmonella enterica serovar Typhimurium invasion in an epithelial cell line (IPEC J2)and mucosal explants from porcine small intestine. Comp. Immunol. Microbiol. Infect. Dis. 31, 63-69. Selje, N., Hoffmann, E.M., Muetzel, S., Ningrat, R., Wallace, R.J., Becker, K., 2007. Results of a screening programme to identify plants or plant extracts that inhibitruminal protein degradation. Br. J. Nutr. 98,45-53. Silva, E., Perez da Graca, J., Porto, C., Martin do Prado, R., Nunes, E., Correa Marcelino-Guimaraes, F., Conrado Meyer, M., Jorge Pilau, E., 2021. Untargeted metabolomics analysis by UHPLC-MS/MS of soybean plant in a compatible response to phakopsora pachyrhizi infection. Metabolites 11, 179. Singleton, V.L., Rossi, J.A., 1965. Colorimetry of total phenolics with phosphomolybdic-phosphotungstic acid reagents. Am. J. Enol. Vitic. 16,144-158. Slifer, Z.M., Blikslager, A.T., 2020. The integral role of tight junction proteins in the repair of injured intestinal epithelium. Int. J. Mol. Sci. 21, 972. Sorgentini, D.A., Wagner, J.R., Anon, M.C., 1995. Effects of thermal treatment of soy protein isolate on the characteristics and structure-function relationship ofsoluble and insoluble fractions. J. Agric. Food Chem. 43, 2471-2479. Sorice, A., Siano, F., Capone, F., Guerriero, E., Picariello, G., Budillon, A., Ciliberto, G., Paolucci, M., Costantini, S., Volpe, M.G., 2016. Potential anticancer effects ofpolyphenols from chestnut shell extracts: modulation of cell growth, and cytokinomic and metabolomic profiles. Molecules 21,1411. Tretola, M., Bee, G., Silacci, P., 2021. Gallic acid affects intestinal-epithelial-cell integrity and selected amino-acid uptake in porcine in vitro and ex vivo permeabilitymodels. Br. J. Nutr. 126 (4),492-500. Tretola, M., Maghin, F., Silacci, P., Ampuero, S., Bee, G., 2019. Effect of supplementing hydrolysable tannins to a grower-finisher diet containing divergent pufa levelson growth performance, boar taint levels in back fat and intestinal microbiota of entire males. Animals 9 (12), 1063. Wijtten, P.J., van der Meulen, J., Verstegen, M.W., 2011. Intestinal barrier function and absorption in pigs after weaning: a review. Br. J. Nutr. 105, 967-981.Wilkinson, L., 2010. Systat. Wiley Interdisciplinary Reviews: Computational Statistics 2, 256-257. Xu, B., Chang, S.K., 2008. Total phenolics, phenolic acids, isoflavones, and anthocyanins and antioxidant properties of yellow and black soybeans as affected bythermal processing. J. Agric. Food Chem. 56,7165-7175. Zhang, Y., Chen, S., Qi, B., Sui, X., Jiang, L., 2018. Complexation of thermally-denatured soybean protein isolate with anthocyanins and its effect on the proteinstructure and in vitro digestibility. Food Res. Int. 106,619-625.
关闭-
1/14
-
2/14
还剩12页未读,是否继续阅读?
继续免费阅读全文产品配置单
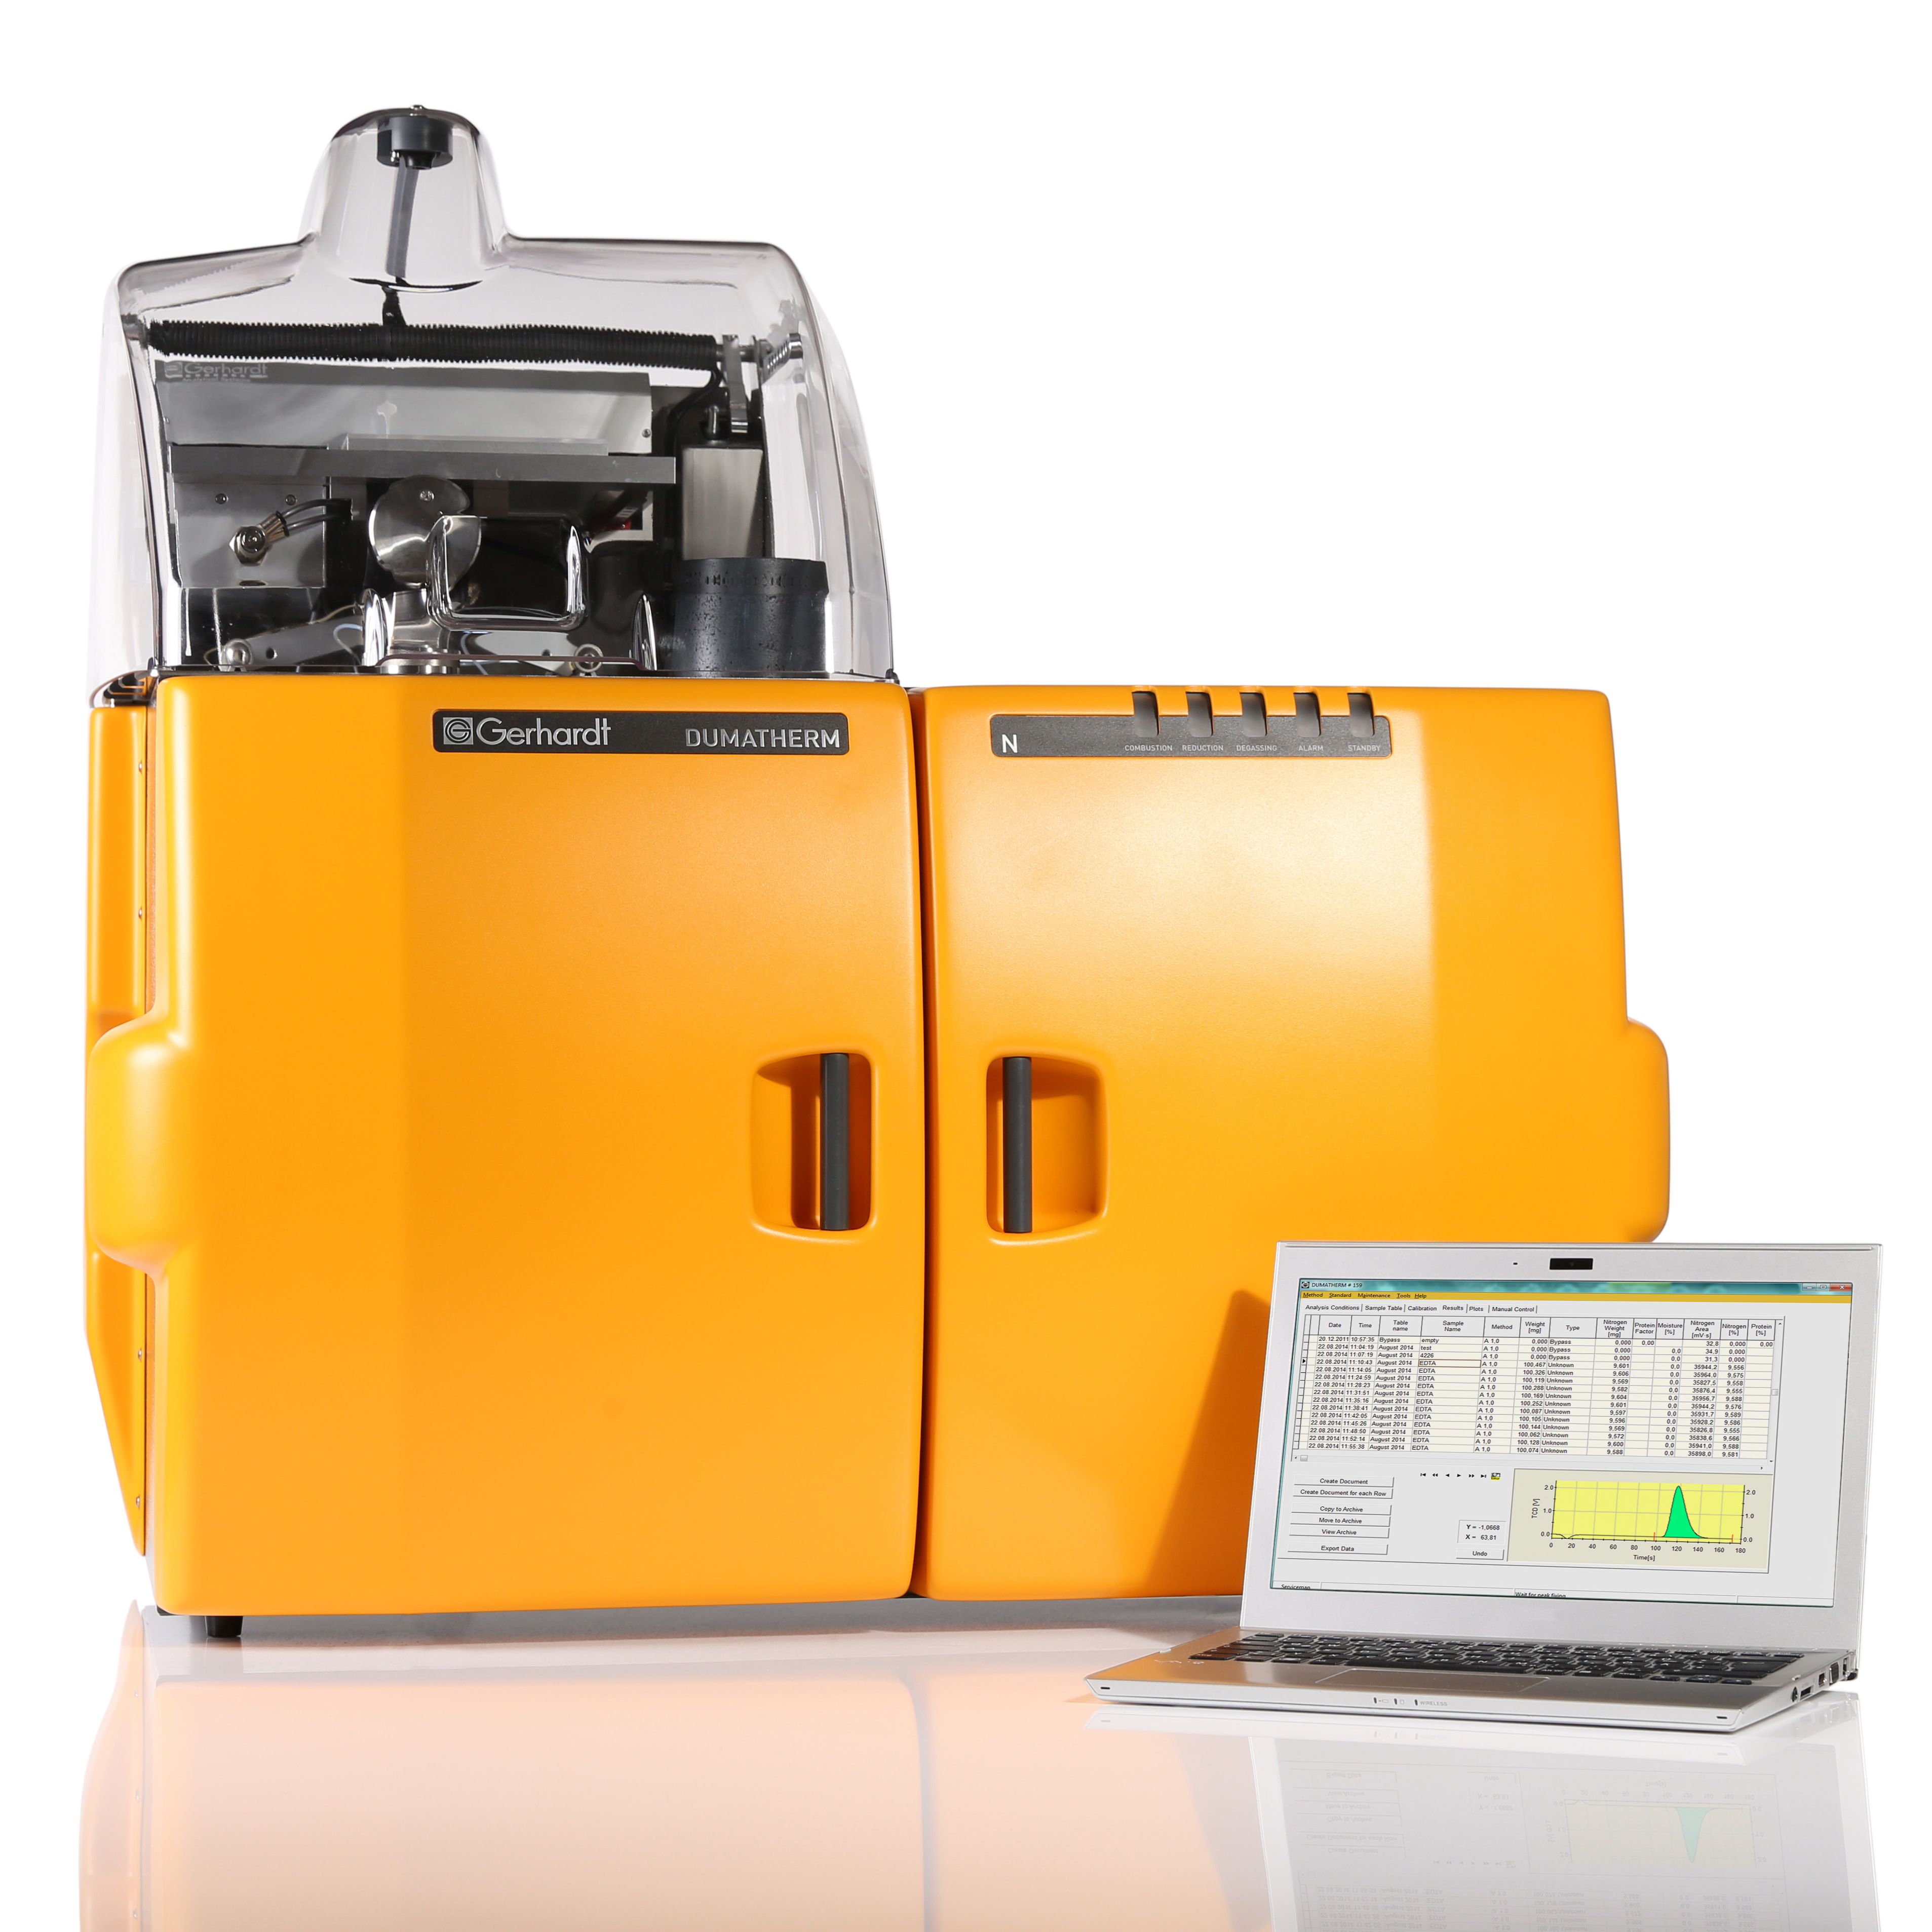
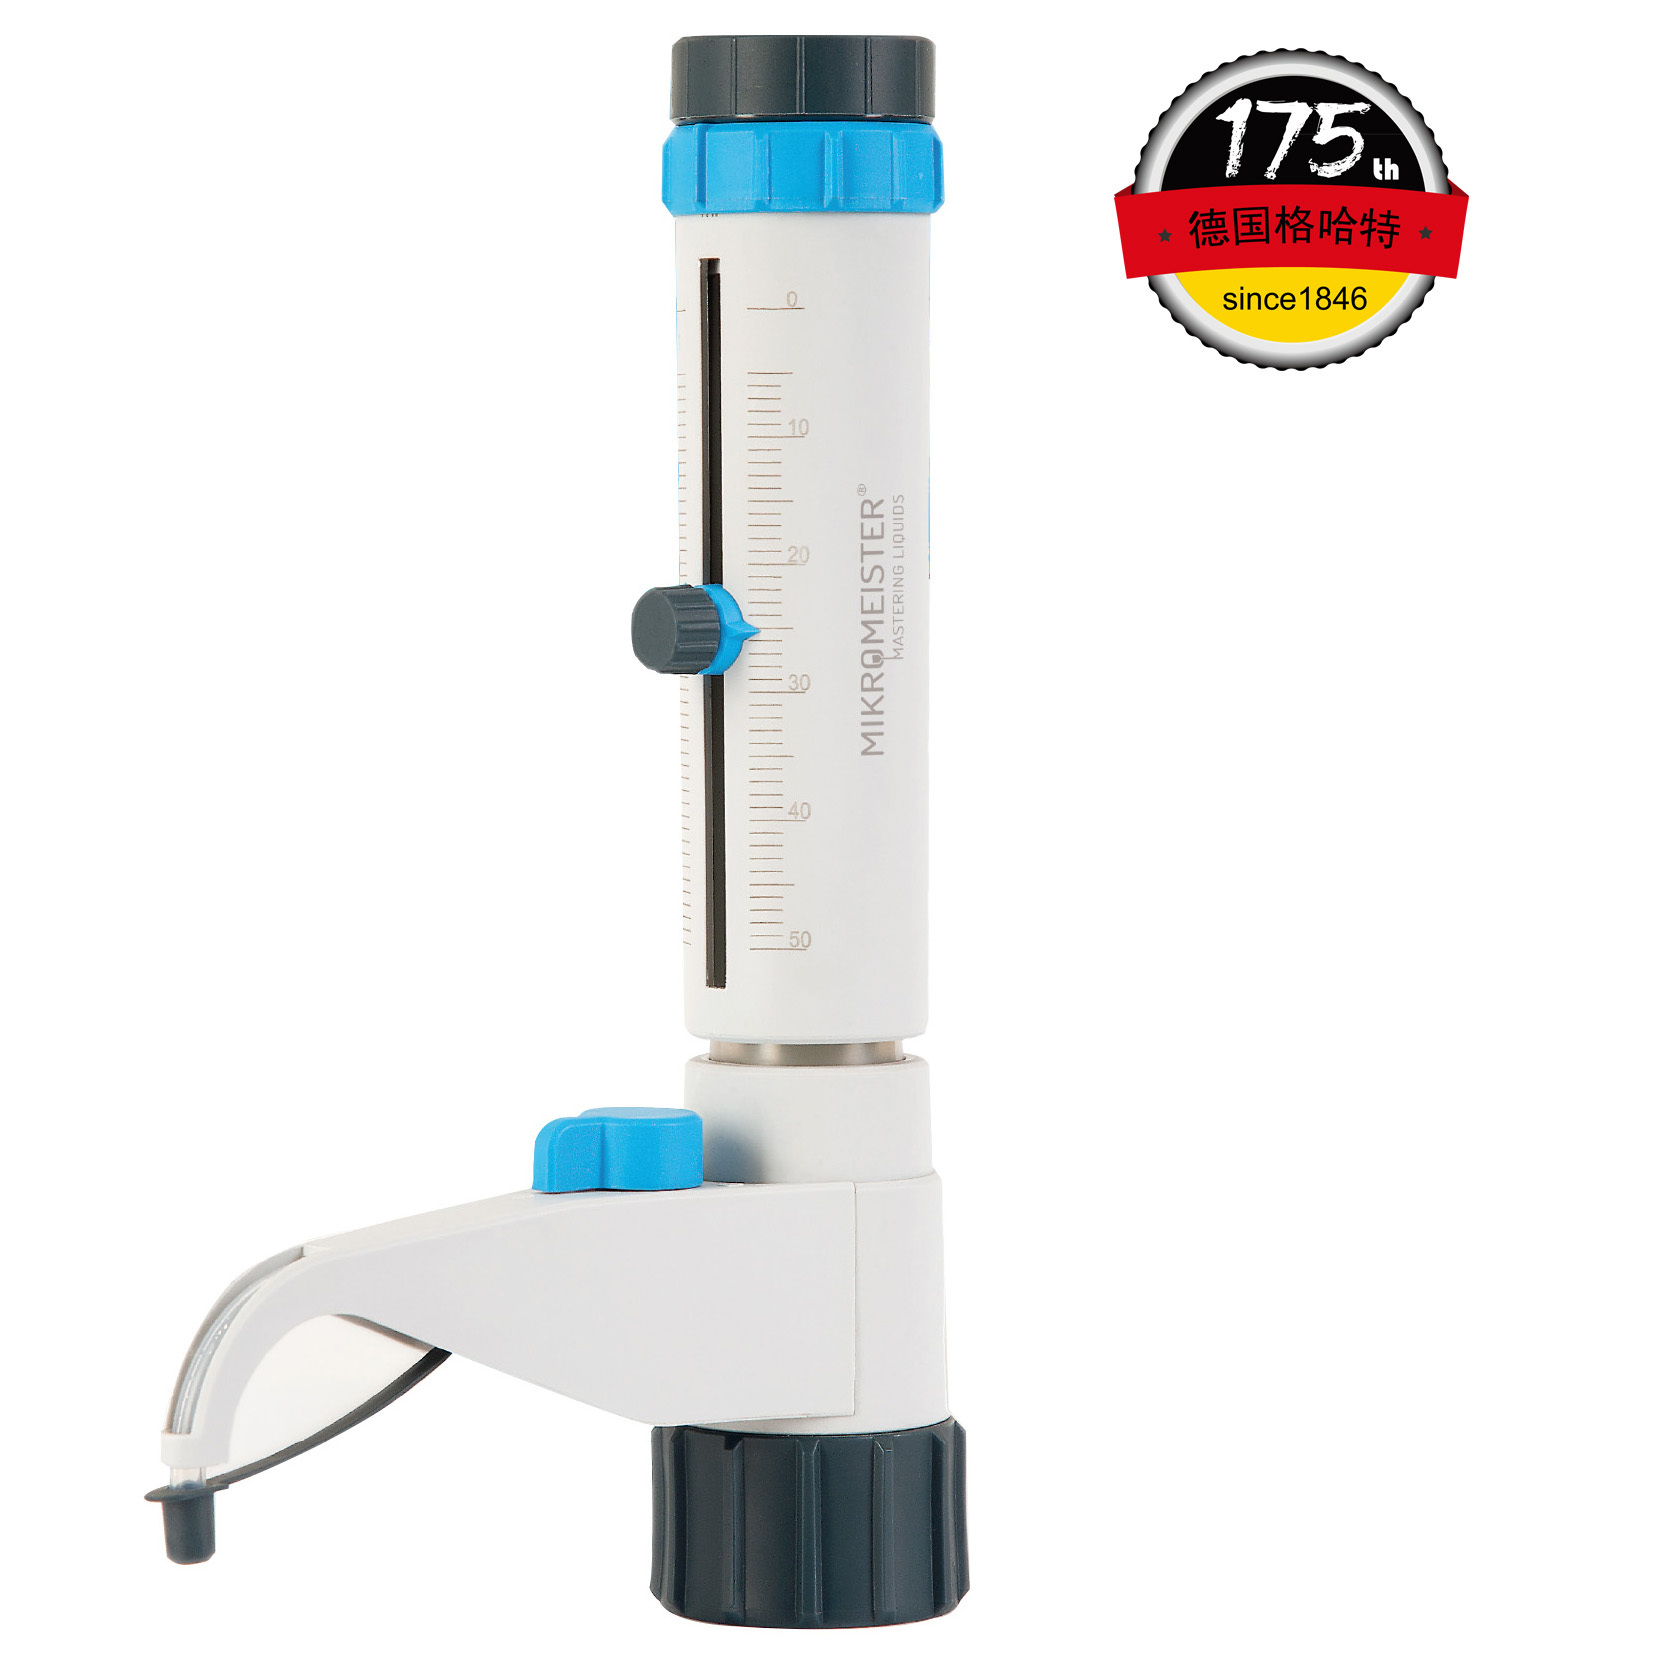
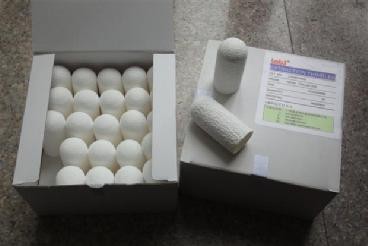
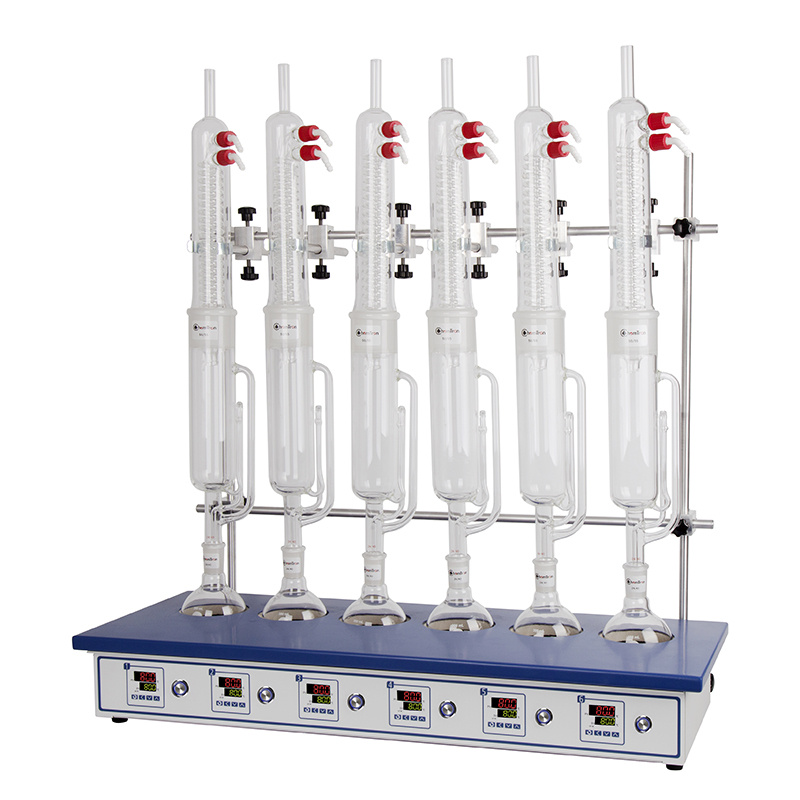
中国格哈特为您提供《螺旋压豆粕(SPS)、溶剂提取豆粕(SES)、大豆蛋白分离物中蛋白质CP、酸水解总脂肪AEE和粗纤维含量的检测》,该方案主要用于饲料中营养成分检测,参考标准《暂无》,《螺旋压豆粕(SPS)、溶剂提取豆粕(SES)、大豆蛋白分离物中蛋白质CP、酸水解总脂肪AEE和粗纤维含量的检测》用到的仪器有格哈特全自动超级总脂肪测定系统HT6+SOX416、格哈特全自动型纤维分析仪FT12、格哈特杜马斯定氮仪DT N Pro、德国加液器MM、滤纸筒。
我要纠错


相关方案
 咨询
咨询