方案详情文
智能文字提取功能测试中
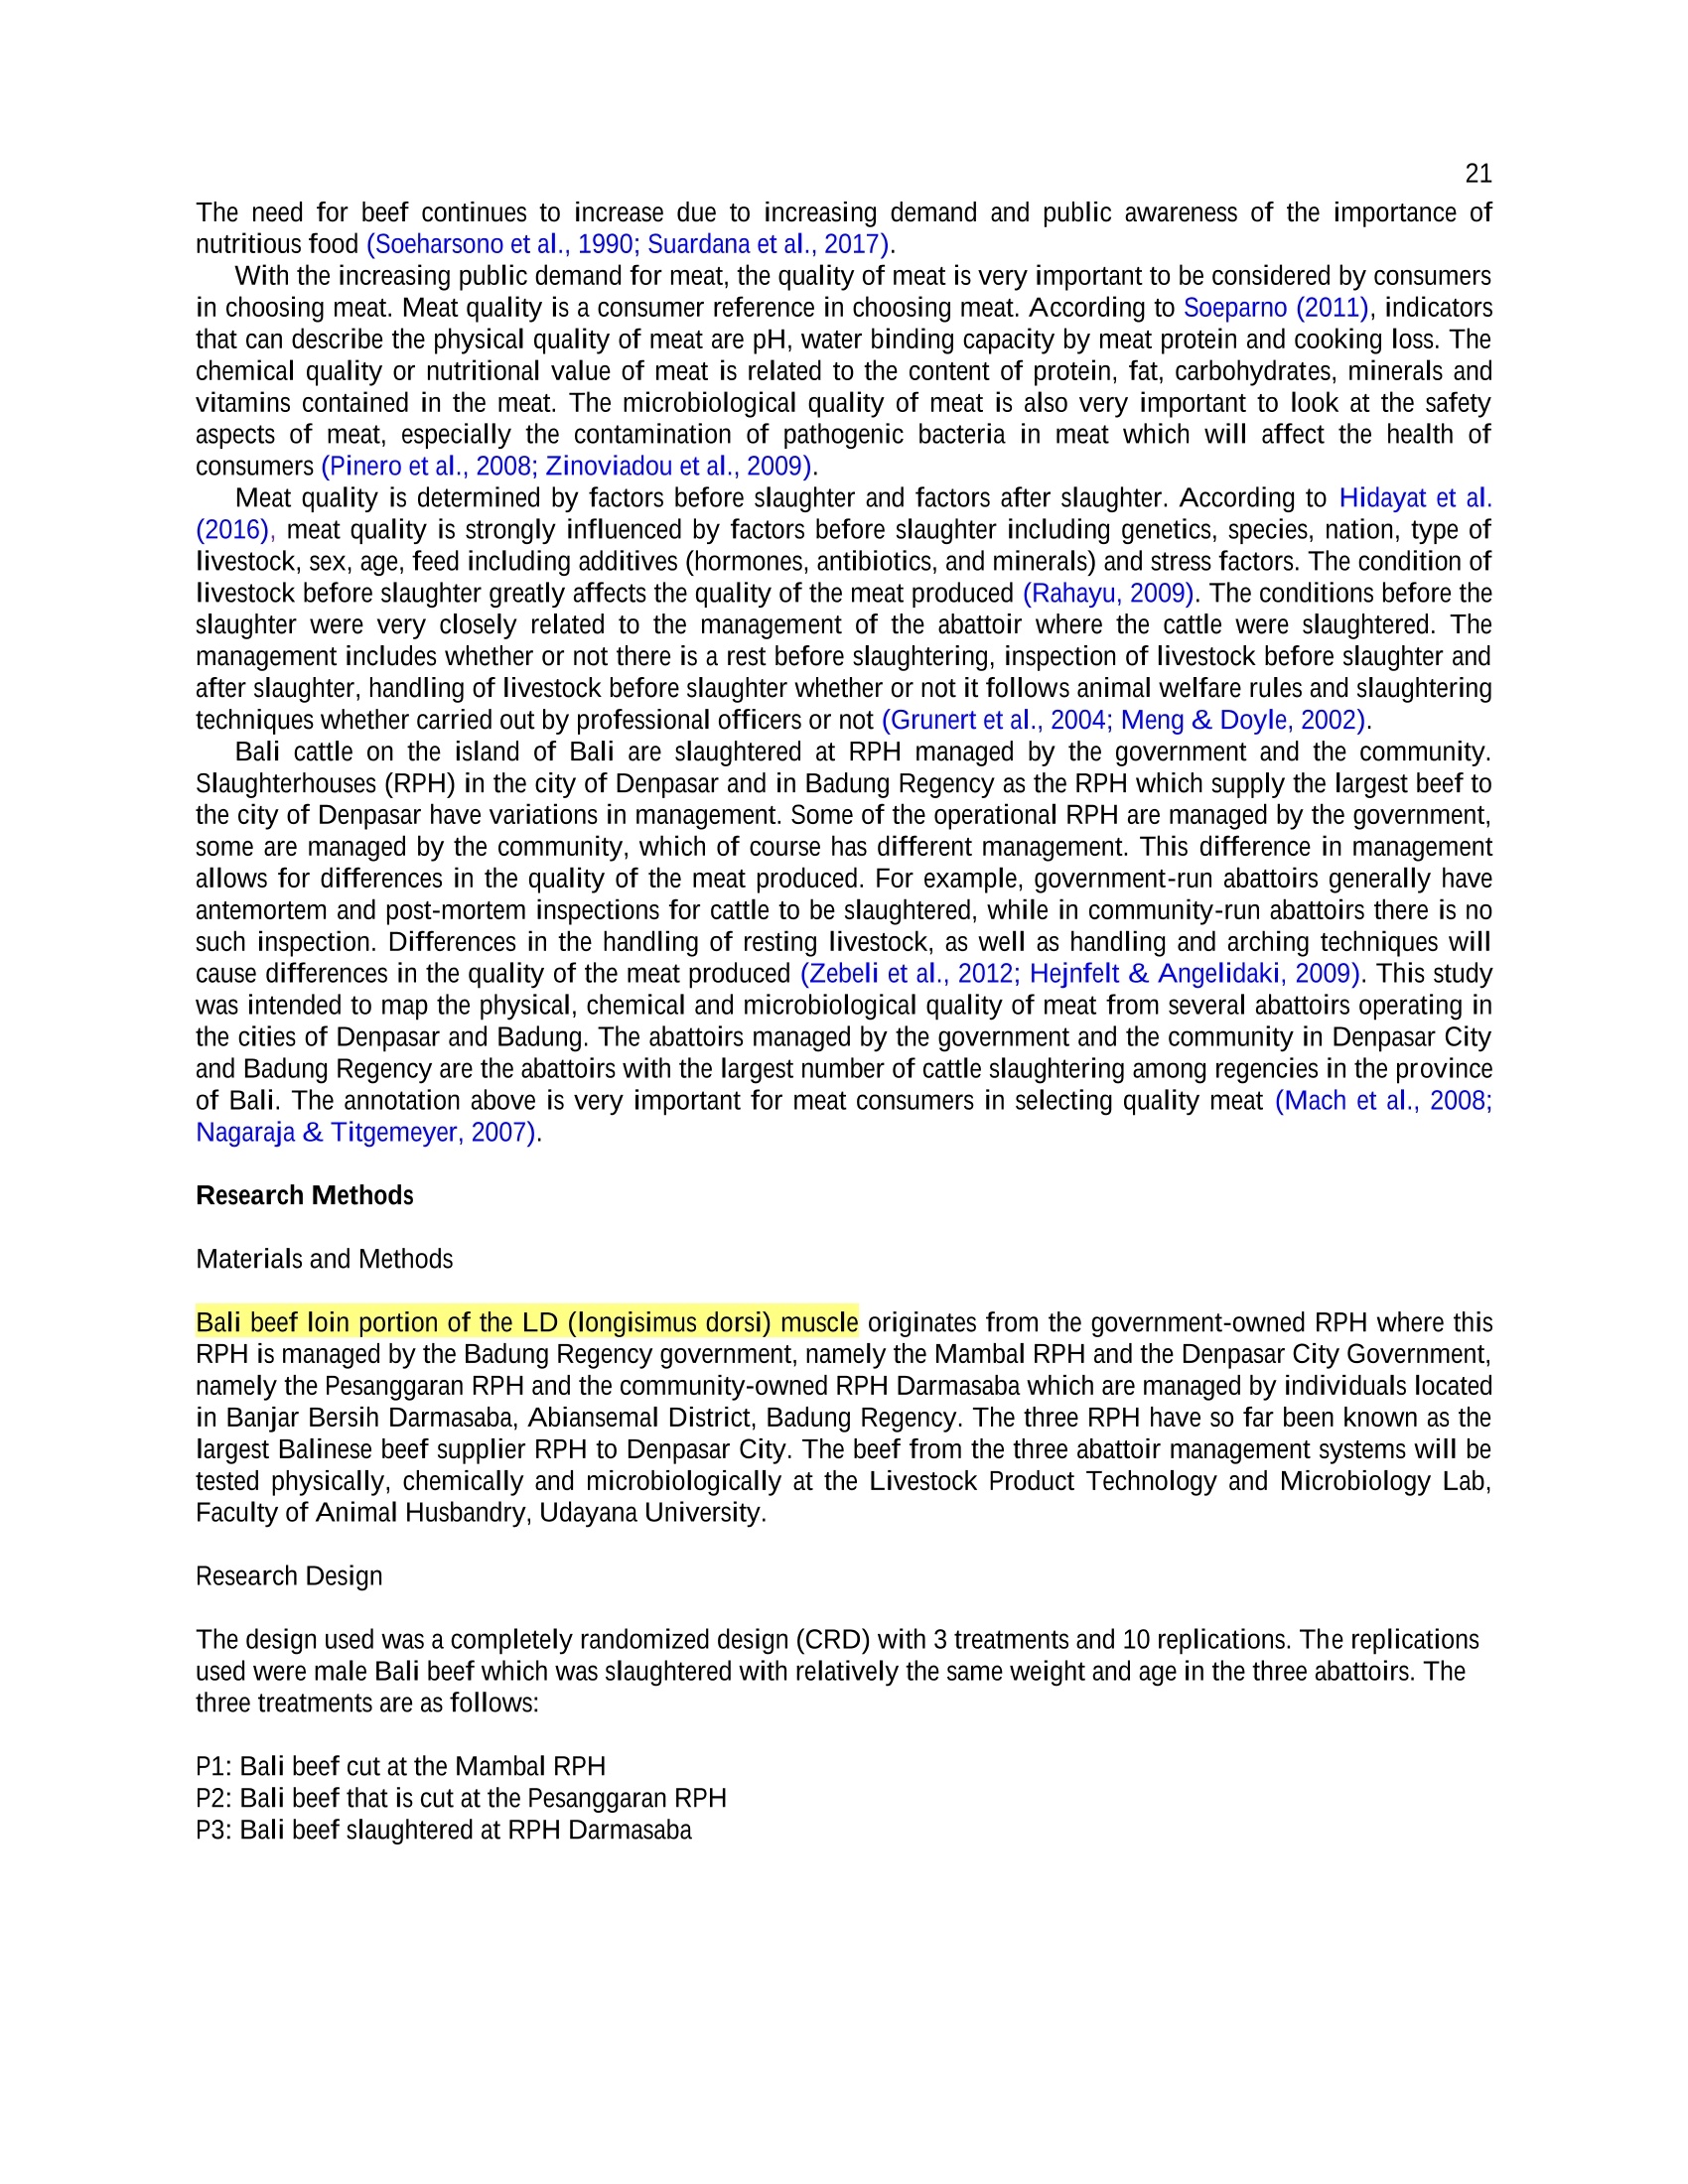
不同管理的巴厘岛屠宰场(RPH)的巴厘牛肉屠宰质量Quality of Bali Beef Cut on Different Management of Slaughterhouses (RPH) in Bali Province 2 grams of meat sample were weighed and wrapped in filter paper and put in a lead, dried in an oven for 9 hours at a temperature of 1050C. The soxtherm tube was dried in an oven for 3 hours at 1050C, then cooled in a desiccator and weighed (B). The lead containing the sample after being dried was put into a soxtherm tube, filled the soxtherm tube with 200 ml of n-Hexane until the sample was completely immersed. Extraction for 4 hours in a soxtherm apparatus, then air dry the soxtherm tube in a forced oven for 15 minutes then dry for 3 hours in a dry oven at 1050C, cool in a desiccator for 30 minutes, weigh the soxtherm tube containing fat extract.0.3克样品,1克催化剂,5毫升浓硫酸,消化1.5小时。A total of 0.3 grams of sample, was placed in a vapodest tube and added 1 grain of selenium catalyst and 5 ml of concentrated H2SO4, then carried out destruction (heating in a boiling state) for 1.5 hours until the solution is clear. After cooling, 50 ml of distilled water and 20 ml of 40% NaOH were added, then distilled. The results of the distillation were accommodated in an Erlenmeyer flask containing a mixture of 20 ml H3BO3 and 2 drops of pink green bromine cresol. After the distillate volume (distillate) became 100 ml and turned bluish in color, the distillation was stopped and the distillate was titrated with 0.1 N HCL until pink.21 22 How to Cite Sriyani , N. L . P., Sampurna, I . P., Dewi, G. A. M. K., & Sumardani, N . L. G. (2022). Quality of Bali beef cut on different management of slaughterhouses (RPH) in Bal i provi n ce. International Journal ofChemical & Material Sciences , 5(1),20-28. https://doi.org/10.21744/ijcms.v5n1.2011 不同管理的巴厘岛屠宰场(RPH)的巴厘牛肉屠宰质量 Quality of Bali Beef Cut on Different Management of Slaughterhouses (RPH) in Bali Province N. L. P. Sriyani Faculty of Animal Science, Udayana University, Denpasar, Indonesia Corresponding author email: sriyaninlp@unud.ac.id I Putu Sampurna Faculty of Veterinary Medicine, Udayana University, Denpasar, Indonesia Email: putu sampurna@unud.ac.id Gusti Ayu M. K. Dewi Faculty of Animal Science, Udayana University , Denpasar, Indonesia Email: kristinadewi@unud.ac.id N. L. G. Sumardani Faculty of Animal Science, Udayana University, Denpasar, Indonesia Email: nlg_sumardani@unud.ac.id Abstract---The purpose of this study was to determine the physical, chemical and microbiological quality of Balinese beef from Slaughterhouses (RPH) with different management in Denpasar City and Badung Regency as abattoirs that supply most of Bali beefon the island of Bali. The material used was male Bali beef in the Longisimus Dorsi (LD) muscle which was cut at three different abattoirs. The RPH are UPT RPH Mambal, UPT RPH Pesanggaran and RPH belonging to the community ofRPH Darmasaba i n Banjar Bersih Darmasaba Village. This study used a completely randomized design (CRD) with 3 treatments where three abattoirs were treated and each treatment consisted of 10 repetitions of Bali beef cuts. The variables sought in this study were physical quality variables,namely pH, color, water holding capacity, and meat cooking loss. Chemical quality variables are meat moisture content, protein content, fat content and ash content. Meat microbiological variables were TPC, colliform, e-coli and salmonella. The results showed that the physical quality of Bali beef slaughtered at the Darmasaba RPH had the lowest physical quality compared to the Mambal and Pesanggaran abattoirs, especially on the pH and meat color variables. The chemical quality of Bali beefslaughtered at the three abattoirs had no significant difference in water content , protein content, and ash content. The total plate count, coliform was below the SNI threshold while e-coli was not identified and salmonella was negative. Keywords---Bali cattle, chemical, meat quality, microbiological, physical, Slaughterhouse Introduction ISSN 2632-9468 Submitted: 18 August 2022 Revised: 09 September 2022 Accepted: 27 October 2022 The need for beef continues to increase due to increasing demand and public awareness of the importance of nutritious food (Soeharsono et al., 1990; Suardana et al., 2017). With the increasing public demand for meat, the quality of meat is very important to be considered by consumers in choosing meat . Meat quality is a consumer reference i n choosing meat. According to Soeparno (2011), indicators that can describe the physical quality of meat are pH, water binding capacity by meat protein and cooking loss. The chemical qual i ty or nutritional value of meat is related to the content of protein, fat, carbohydrates, minerals and vitamins contained in the meat. The microbiological quality of meat i s also very important to look at the safetya spects of meat, especial l y the contamination of pathogenic bacteria in meat which wil l affect the health of consumers (Pinero et al., 2008;Zinoviadou et al., 2009). Meat quality is determined by factors before slaughter and factors after slaughter. According to Hidayat et al.(2016), meat qual i ty is strongly influenced by factors before slaughter including genetics, species, nation, type of livestock, sex, age, feed including additives (hormones, antibiotics, and minerals) and stress factors. The condition of livestock before slaughter greatly affects t he quality of the meat produced (Rahayu, 2009). The conditions before the slaughter were very closely related to the management of the abattoir where the cattle were slaughtered. Them anagement i ncludes whether or not there i s a rest before slaughtering, inspection of l ivestock before slaughter and after slaughter, handling of l ivestock before slaughter whether or not it follows animal welfare rules and slaughtering techniques whether carried out by professiona l officers or not (Grunert et al., 2004; Meng & Doyle,2002). Bali cattle on the island of Bali are slaughtered at RPH managed by the government and the community.Slaughterhouses (RPH) i n the city of Denpasar and in Badung Regency as the RPH which supply the largest beef to the city of Denpasar have variations in management. Some of the operational RPH are managed by the government,some are managed by the community, which of course has different management. This di f ference in management allows for differences in the quality of the meat produced. For example, government-run abattoirs generally have antemortem and post-mortem inspections for cattle to be slaughtered, while in community-run abattoirs there is no such inspection. Differences in the handling of resting livestock, as well as handling and arching techniques will cause differences in the quality of the meat produced (Zebeli et al., 2012; Hejnfelt & Angelidaki, 2009). This study was i ntended to map t he physical, chemical and microbiological quality of meat from several abattoirs operating in the cities of Denpasar and Badung. The abattoirs managed by the government and the community i n Denpasar City and Badung Regency are the abattoirs with the largest number of cattle slaughtering among regencies in the prov i nce of Bali. The annotation above is very important for meat consumers in selecting quality meat (Mach et al., 2008;Nagaraja & Titgemeyer, 2007). Research Methods Materials and Methods Bali beef loin portion of the LD (longisimus dorsi) muscle originates from the government-owned RPH where this RPH is managed by t he Badung Regency government, namely the Mambal RPH and the Denpasar City Government,namely the Pesanggaran RPH and the community-owned RPH Darmasaba which are managed by individuals located in Banjar Bersih Darmasaba, Abiansemal District, Badung Regency. The three RPH have so far been known as t he largest Balinese beef supplier RPH to Denpasar City. The beef from t he three abattoir management systems will be tested physically, chemically and microbiologically at the Livestock Produc t Technology and Microbiology Lab,Faculty of Animal Husbandry, Udayana University. Research Design The design used was a completely randomized design (CRD) with 3 treatments and 10 replications. The replications used were male Bali beef which was slaughtered with relatively the same weight and age in the three abattoirs. The three treatments are as follows: P1: Bal i beef cut at the Mambal RPH P2: Ba l i beef that is cut at the Pesanggaran RPH P3: Bali beef slaughtered at RPH Darmasaba Physical Quality Test Method Flesh color The color of the meat was observed by comparing the color of the meat sample with the standard of meat color. The comparison color standard used is “Photographic Color Standard For Muscle and Fat Color”, Department of Agriculture, Western Australia with the following color scores: light brown (1), pale pink (2), pink (3), pink (4),bright red (5), (6) dark red. Degree ofacidity (pH) Measurement of meat pH using a pH meter, starting with standardization of a pH meter with a buffer solution of pH 4 and pH 7. Then, ± 10gram meat samples were crushed and then put i n a glass beaker and added with aquadest with a ratio of meat samples: aquadest (1:1). The sample was stirred and then allowed to stand for 1 minute. After that, the pH meter was i mmersed in the sample solution. Water holding capacity Measurement of water holding capacity using a Clement 2000 centri f uge. A total of ± 10 grams of meat samples were crushed, then weighed and recorded as i nitial weight. Furthermore, the meat was wrapped in Whatman 41 filter paper, put into a centrifuge at a high speed of 36,000 rpm for 60 minutes. Then the sample was weighed without filter paper to obtain the f inal weight . The percentage (DIA) is calculated by the formula: Cooking loss Meat cooking loss measurement begins with preparing a sample of ±30 grams of meat, then the sample is put in a plastic bag. The plastic bag was folded and clipped , after t hat, i t was boiled at 80°℃ for 60 minutes. The sample was then taken and wiped with a t issue without pressing i t and weighed as t he final weight. The percentage of cooking loss is calculated by the formula: Meat Chemical Quality Test Method Water content Moisture content was determined directly using an oven at 105C. First, the empty cup was dried in an oven at 105℃for 15 minutes and cooled i n a desiccator, then weighed. A total of 1.5 grams of the sample was put i n a weighing cup and then dried in an oven at 105℃ for 3-4 hours. The cup containing the dried sample was then transferred to a desiccator, cooled for 30 minutes and t hen weighed. Drying was carried out unti l a constant weight was obtained.Calculation of water content can be calculated by the formula: Protein Level A total of 0.3 grams of sample, was placed in a vapodest tube and added 1 grain of selenium catalyst and5 ml of concentrated H2SO4, then carried out destruction (heating in a boiling state) for 1.5 hours until the solution is clear.After cooling, 50 ml of distilled water and 20 ml of 40% NaOH were added, then disti l led. The results of thedist i llation were accommodated i n an Erlenmeyer flask containing a mixture of 20 ml H3BO3 and 2 drops of pink green bromine cresol. After the distillate volume (dist i llate) became 100 ml and t urned bluish in color, the disti l lation was stopped and the distillate was t itrated with 0.1 N HCL unti l pink. The same treatment was carried out for the blanks. With this method, crude protein content is obtained which is calculated by the formula: Annotation: S: sample t itrant volume B: Volume of blank titrant W: dry sample weight Fat level Determination of fat content by Soxhlet method . 2 grams of meat sample (A) were weighed and wrapped i n fi lter paper and put in a lead, dried in an oven for 9 hours at a temperature of 105C. The soxtherm tube was dried in an oven for 3 hours at 105 C, then cooled i n a desiccator and weighed (B). The lead containing the sample after being dried was put i nto a soxtherm tube, filled the soxtherm tube with 200 ml of n-Hexane unti l the sample was completely immersed. Extraction for 4 hours i n a soxtherm apparatus, then air dry the soxtherm tube in a forced ovenfor 15 minutes t hen dry for 3 hours in a dry oven at 105C, cool i n a desiccator for 30 minutes, weigh the soxtherm tube containing fat extract (C). The percentage of fat content i s calculated as follows: Annotation: A: sample weight (grams) B: weight of soxtherm tube (grams) C : soxtherm tube weight + fat extract (grams) Ash Level The porcelain dish was heated i n an oven at 100-105℃ for 30 minutes, then cooled in a desiccator and weighed to a constant weight. A total of 1 gram of the meat sample was put into a porcelain dish and weighed, then burned unt i l i t no longer smoked and ashed in a kiln at 600℃ for 3 hours unt il i t was white and the weight was constant. Turn off the furnace, leave for 12 hours and then cool in a desiccator for 30 minutes. After that, the sample was weighed. Microbiological Quality Test Total Plate Count (TPC) The TPC test steps are: smoothing the sample (beef), weighing the sample as much as 5 grams. According to Waluyo (2008), the dilution stage starts from making a sample solution of 10 ml (a mixture of 1 ml/gram sample and 9 ml of peptone solution). From t his solution, 1 ml was taken and put i nto the next test tube so that the desired dilution was obtained. Next, take the solution f rom t he last 2 t est tubes (10 and 10), pour i t i nto a petri dish then add agar i n the form of media and rotate it like number 8 so that the sample and media are well mixed and solidified then the tube is incubated at 37℃ for 2 x 24 hours. The number of bacterial colonies can be calculated using the following formula: Total Coliform and Escherichia coli The method used to obtain total Escherichia coli and Coliform bacteria is the spread method Fardiaz (1989), using EMBA media, which is 5 grams of beef put i nto an Erlenmeyer tube which already contains 0.1% peptone water solution with a volume of 45 ml, so that a dilution of 10 was obtained. The 10 dilution was then homogenized and diluted again by taking 1 ml through a pipette and then put into a test tube which already contained 9 ml of peptone solution to obtain dilutions of 102 and 103. From a dilution of 10 taken using a sterile pipette as much as 0.1 ml was then poured on the surface of the solid EMBA media into a petri dish and then incubated at 37'C in an inverted state, and t he results can be calculated after 24-48 hours. Planting was carried out at dilution l evels of 10-1, 10 and 10. To count bacterial colonies t hat grew using the plate count method, namely by selecting the number of colonies that grew i n petri dishes ranging from 30-300 colonies (Fardiaz, 1989). 1Formula : Colonies/gram =Number of Colonies per cup x -faktorpengencer Statistical analysis The data on the physical and chemical quality of the meat obtained were analyzed using a variance. If there was a significant difference (P<0.05) between treatments, the analysis was continued with Duncan's multiple-distance test (Steel & Torrie, 1993). Meat microbiological data were analyzed descriptively. The analysis was assisted by the SPSS 20 program. Results and Discussion Physical quality of meat The value of the physica l quality of the meat (Table 1) which is reflected i n the variables of pH, color, water binding capacity of the meat and the cooking loss value of the meat produced by the three abattoirs are as follows: Table 1The physical quality of Bali beef slaughtered at different abattoirs Variable RPH RPH RPH Variable RPH Mambal Mambal Pesanggaran pH 5,77a2) 5,73a 5,93 0,03 5,4-5,8 Color 5a 5,25a 6 0,15 1-5 SNI 3932:2008 Water Holding 23,48a 23,35a 27,44 0,48 20-60% Capacity (%) Cooking Loss (%) 32,84a 33,17a 31.995 0,16 15-40% Annotation: 1. SEM is“Standard Error of Treatment ” 2. Values with different letters i n the same row, signi f icantly different (P<0.05) The pH values of Bali beef slaughtered at the Mambal RPH (P1), Pesanggaran RPH (P2) and Darmasaba RPH (P3)were 5.77, 5.73, 5.93, statistically significantly different (P<05). The highest PH value was found in meat slaughtered at Darmasaba RPH, which was 5.93. This pH value is above the ultimate meat pH from 5.4 to 5.8(Soeparno, 2011). It i s suspected that t he meat produced from the s l aughter of the Darmasaba abattoir is produced from Bali cattle which are thought to be under stress. It is suspected that the animals experienced stress during slaughter and handling before slaughter . The handling of cows at the Darmasaba RPH before slaughter when t he cow is laid down st i ll uses the manual method, namely by using rigging. The cow i s tied on al l four legs then the rope is pulled together and causes the cow to fall. When a cow falls, it is slaughtered by a butcher. In contrast to the handling of cows at the Mambal and Pesanggaran RPH, in these two government-owned abattoirs, the handling or laying down of cows before being slaughtered uses mechanization, namely with a threshing machine. Cows that are ready to be slaughtered are put into a threshing machine and slowly the machine will lay down the cow perfectlywithout violence. The slaughtering at the Darmasaba RPH is carried out by uncertified or untrained butchers.Meanwhile, the cuts at RPH Mamba l and Pesanggaran are carried out by Juleha (halal slaughter attendant ) who has been certified from MUI (Indonesian Ulema Council). Factors that affect the rate and magnitude of t he decrease in pH are divided into two, namely intrinsic factors consisting of species, muscle type, muscle glycogen, and variability among livestock. While extrinsic factors include environmental temperature, cutting treatment, cutting process and stress before cutting. When cattle are stressed, a A high pH va l ue of meat will result in a higher or darker color of the meat. This is reflected in the color of meat slaughtered at Darmasaba RPH which has the highest/darkest value compared to the color of Bali beef slaughtered at Mambal RPH and Pesanggaran RPH which was statistically significantly different, (P<0.05). A high pH value of meat wil l cause the meat to be dark in color. Mounier et al . (2006) stated that stress conditions can increase blood cortisol concentrations and are accompanied by glycogen depletion in muscles. This causes a decrease in postmortem lact i c acid production and the pH of t he meat remains high. The high pH value of meat results in a closed meat structure, so that the water holding capacity i s high (Buckle et al., 2007). The water-holding value of Balinese beef slaughtered at RPH Mambal, RPH Pesanggaran and RPH Darmasaba were 23.48%, 23.35% and 27.44% statist i cally significantly different (P<0.05). The value of the water holding capacity of the meat in this study was influenced by the pH value of the meat. This i s in accordance with the opinion of Jamhari (2000), that several factors can cause variations in the water holding capacity of meat including: pH factor. The increased pH value results in high water holding capacity Sunarlim & Usmiati (2009), this is due to the high pH value of the meat resulting in a closed structure of the meat so that the high water holding capacity of the low pH value of the meat results in the open structure of the meat thereby reducing the water holding capacity. Table 1 shows that the increase in the pH value was followed by an increase in the water holding capacity of the meat. The value of the meat binding capacity of the three abattoirs was still in the normal range of 20-60% (Soeparno 2011). According to Soeparno (2011), cooking loss is influenced by water holding capacity, high water holding capacity causes low cooking loss, and vice versa. The increase in the value of water holding capacity in this study on meat slaughtered at the Darmasaba RPH was followed by a decrease i n the cooking loss value. This is also in accordance with the opinion of Tambunan (2009) that the cooking loss value is closely related to the binding capacity of water.The higher the water binding power, the less water and nutrient l iquid will come out or wasted during the heating process, so that the mass of t he meat will decrease slightly. A low cooking loss value will make the quality of the meat better. This is confirmed by Yanti et al., (2008), that meat that has a low cooking loss value below 35% has good quality because the possibility of releasing nutrients from the meat during cooking i s also low. In accordance with this statement, the data of this study showed that all meat slaughtered in the three abattoirs was within the normal range of 15-40%. Chemical quality ofmeat Moisture content is the percentage of water content of a material which can be expressed by wet weight or dry weight. The results of variance showed that Bali beef with different slaughterhouse treatments at different abattoirs had no significant effect (P<0.05). Although there was a difference in the water holding capacity of the meat, namely the highest water holding value of Balinese beef slaughtered at the Darmasaba RPH, it did not affect the water content of the meat. This is because the range of water-holding capacity of the meat in the three treatments is still i n the normal range (20-60%). Muscle contains about 75% water with a range of 68-80%, if the water content of t he meat exceeds the normal water content (75%) i t can reduce the quality of the meat. Fausiah & Al Buqhor (2019),research found that the water content of Bali beef in the traditional market of Polewal i Mandar district, South Sulawes i , 74.85-77.98% Meat with high water content will look pale, runny and have a soft texture because a lot of water is bound to come out of meat . The high water content in meat causes less water-soluble protein so the water-holding capacity of meat protein will decrease. Table 2Chemical quality of Bali beef slaughtered at different abattoirs Variable RPH Mambal RPH RPH SEM Pesanggaran Darmasaba Water content (%) 70,88a 71,54a 70,64a 0,20 Protein Content (%) 25,93a 26,09a 26,19a 0,13 Fat level (%) 1,57a 0,88 1,65a 0,09 Ash content (%) 1,048 0,98a 1,068 0,01 Annotation: 1. SEM is“Standard Error of Treatment ” 2. Values with different l etter s in the same row, significantly different (P<0.05) Along with the water content which was not significantly different, the protein content of Bal i beef slaughtered at the three abattoirs also showed results t hat were not significantly different (P<0.05). Protein is the largest chemical component in meat that has an important role for growth, cell maintenance and as a source of calories. Different water content can cause differences in protein content, because protein has a close relationship with the water content of meat, especially the hydrophilic nature of musc l e protein i n binding meat molecules. In general, meat contains re l atively constant amounts of protein and there may be no difference between breeds. According to Soeparno (2011)the protein content of meat ranges from 16-22%. The results in this study protein levels can be said to be very good because the number i s above t he normal value. The fat content of meat i n this study was Bali beef slaughtered at t he Mambal RPH 1.57%, at the Pesanggaran RPH 0.88% and at the Darmasaba RPH 1.65% statistically significantly different (P<0.05). The lowest fat content i n Balinese beef slaughtered at the Pesanggaran RPH. This is because the water content of the meat s l aughtered at the Pesanggaran RPH is the highest. Body water content is inversely proportional to body fat content. According to Soeparno (2011) the fat content of meat ranges from 1.5-13%.Research by Abustam & Ali (2004) found that the fat content of Bali beef ranged from 1.56 to 4.31%. Ash content is a component of inorganic substances that are not burned in the combustion process. The results of variance showed that Bali beef slaughtered at different abattoirs had no significant effect (P>0.05) on the ash content of Bali beef. According to S ug eng (2004), foods derived from animal sources have a high ash content, this is due to some of the minerals contained in them such as calcium, iron, and phosphate. The high and low ash content is determined by the presence of minerals t hat are difficult to dissolve in the meat. In general, the chemical quality of Bali beef slaughtered at different abattoirs did not have a significant effect. These results are consistent with previous studies where meat quality i s more influenced by extrinsic f actors such as feed and rearing management (Guerrero et al. 2013). Table 3Microbiological quality of Bali beef slaughtered at different abattoirs Variable RPH Mambal RPH RPH Pesanggaran Darmasaba TPC cfu/g 7,1x10² 9.5x10² 1,2x10 Coliform cfu/g 2x10 1x10 3x10 E-Coli 一 一 Salmonella Negative Negative Negative Meat is a source of protein that is very susceptible to microbial contamination. Although the muscles of healthy animals are not contaminated with microbes, the surface of the meat can be contaminated during several stages of slaughter and t ransportation (Ercolini et al ., 2010). This is i n accordance with S yu kur (2006), report that foodstuffs of animal origin (meat, eggs, and milk) and their processed products are easily damaged and are excellent media for microbial growth. Some microbial contamination can be caused by the sanitation of equipment, workers, exposure to floor surfaces, contamination of digestive tract contents, and water use in abattoirs, and can also increase during packaging, transportation, and distribution processes.Microbial contamination of meat can occur before and after thePaC animal is slaughtered. According to Gustiani (2009), shortly after the cattle are slaughtered, the blood is still circulating throughout t he animal’s body, so using an unclean knife can cause microorganisms to enter the blood.Meat contamination can be prevented if the slaughtering process is carried out hygienically. Based on t he results of microbiological data in this study (Table 3), i t was found that the highest TPC and coliform contents were in Bal i beef slaughtered at Darmasaba RPH. RPH Darmasaba i s a community managed RPH whose management is simple and of course the level of sanitation is still low. Based on observations in the field,slaughtering livestock on t he floor and then proceeding with grounding on the floor without hanging, of course resulted in a high level of bacterial contamination. The absence of a special viscera also allows contamination to occur. It is different with the RPH Mambal and Pesanggrana which are managed by the government with more adequate facilities. In these two RPH, the garages are hung by hanging and there is already a special innards room so that contamination can be minimized. Based on t he provisions set by the National Standardization Agency (BSN),the microbiological requirements for beef circulat i ng in Indonesia are a total plate count (TPC) of 1 x 10° cfu/g, Coliform bacteria 1 x 10²cfu/g, and Escherichia coli bacteria 1 x 10l cfu/g and Salmonella were negative (SNI 7388,2009). If you look at the data in Table 3, the microbiological quality of Bali beef at the three abattoirs has good quality because i t is below the SNI threshold. So, microbiologically, the meat of the three abattoirs is still safe for consumption Conclusion The physical quality of Bal i nese bee f slaughtered at the Darmasaba RPH has t he lowest physical qual i ty compared to the Mambal and Pesanggaran abattoirs, especially on the pH and meat color variables. The chemical quality of Bali beef slaughtered at the three different abattoirs had no significant difference in water content, protein content, and ash content. The total plate count, col l iform was below the SNI threshold while e-col l i was not identified and salmonella was negative. Acknowledgements The acknowledgements are expressed to the laboratory staff of Livestock Products Technology and Microbiology,Faculty of Animal Science, Udayan University. Thanks are also expressed to all staff of RPH Mambal, RPH Pesanggaran and RPH Darmasaba. References Abustam, E., & Ali, H. M. (2004). Bahan Ajar Ilmu dan Teknologi Pengolahan Daging. Fakultas Peternakan.Universitas Hasanuddin, Makassar. Buckle, A ., Edwars, R. A., Fleet, G. H., & Wootton, M. (2007). I l mu Pangan [Food Science)(Jakarta. Ercoli n i, D., Ferrocino, I., La Storia, A., Mauriello, G., Gig l i, S., Masi, P., & Villani, F. (2010). Development of spoilage microbiota in beef stored in nisin activated packaging. Food microbiology,27(1), 137-143. Ernawati, F., Imaningsih, N ., Nurjanah, N., Sahara, E., Sundari, D., Arifin , A. Y., & Prihatini, M. (2018). Nilai pH dan kualitas zat gizi makro daging beku, dingin dan segar pada pasar tradisional dan pasar swalayan. Penelitian Gizi Dan Makanan, 41(1), 21-30. Fardia z , S. (1989). Analisis Mikrobiologi Pangan Petunjuk Laboratorium. Institut Pertanian Bogor. Bogor. Fausiah, A., &Al Buqhori, I. P. (2019). Karakter i stik Kualitas Kimia a D Daging S Sapi Bali I Di F Pas a r Tradisional. AGROVITAL: Jurnal Ilmu Pertanian, 3(1),8-10. Guerrero, A., Velandia Valero, M., Campo, M. M., & Sanudo, C. (2013). Some factors that affect ruminant meat quality: from the farm to the fork. Review. Acta Scientiarum. Animal Sciences, 35,335-347. Gustiani, E. (2009). Pengendalian cemaran mikroba pada bahan pangan asal ternak (daging dan susu) mulai dari peternakan sampai dihidangkan. Jurnal L i tbang Pertanian, 28(3),96-100. Hejnfelt, A., &Ange l idaki, I. (2009). Anaerobic digestion of slaughterhous s e e b by-products. Biomass and bioenergy, 33(8), 1046-1054. https://doi .org/10.1016/j .biombioe.2009.03.004 Hidayat, M. A., Kuswati , K., & Susilawat i , T. (2016). Pengaruh lama ist i rahat terhadap karakteristik karkas dan kual i tas fisik daging sapi Brahman Cross Steer. Jurnal Ilmu-Ilmu Peternakan (Indonesian Journal of Animal Science),25(2),71-79. Jamhar i , J. (2000). Perubahan sifat fi sik dan 1 organoleptik daging sapi selama penyimpanan beku . Buletin Peternakan, 24(1),43-50. J a muna, R. (2015). Data mining technique appl i ed to DNA sequencing . International Research Journal of Management, IT and Social Sciences,2(7), 15-19. Retrieved from https://sloap.org/journals/index.php/irjmis/article/view/314 J u dge, M. D., Aberle, E . D., Forrest, J . C., Hedrick, H. B., & Merkel, R. A. (1989). Principles of meat science.Dubuque : Kendall. Mach, N., Bach, A., Velarde, A., & Devant, M. (2008). Assoc i ation between animal, transpor t ation, slaughterhouse practices, and meat pH in beef. Meat Science, 78(3), 232-238. ht tp s://doi.org /10.1016/j .m eatsci.2007.06.021 Meng, J ., & Doy l e, M. P. (2002). Introduction. Microbiological food safety. Microbes and Infection, 4(4), 395-397.https://doi .org/10.1016/S1286-4579(02)01552-6 Mounier, L., Dubroeucq, H., Andanson, S., & Veissier, I . (2006). Variations in meat pH of beef bulls i n relation to condi t ions of transfer to slaughter and previous history of the animals. Journal ofanimal science, 84(6), 1567-1576. Nagaraja, T. G., & Titgemeyer, E. C. (2007). Ruminal acidosis in beef cattle: the curren t microbiological and nutritional outlook. Journal of dairy science, 90,E17-E38. https://doi.org/10.3168/jds.2006-478 Pinero, M. P., Parra, K., Huerta-Leidenz, N., De Moreno, L. A., Ferrer, M., Araujo, S., & Barboza, Y. (2008). Effect of oat ’s soluble fibre (B-glucan) as a fat replacer on physical, chemical, microbiological and sensory properties of low-fat beef patties. Meat science, 80(3), 675-680. https://doi.org /10.1016/j.meatsci.2008.03.006 Rahayu, S. (2009). Sifat Fisik Dagi n g Sapi, Kerbau dan Domba pada Lama Postmortem yang Berbeda (Physical Characteristics of Beef, Buffalo and Lamb Meat on Different Postmortem Periods). Buletin Peternakan, 33(3),183-189. Soeharsono, S., Hartaningsih, N., Soetrisno, M., Kertayadnya, G., & Wilcox, G. E. (1990). Studies of experimental Jembrana disease in Bal i cat t le. I. Transmission and persistence of the i nfectious agent i n ruminants and pigs, and resistance e of recovereddcattle to re-infection. Journal of Comparative Pathology ,103(1), 49-59.https://doi.o rg/10.1016/S0021-9975(08)80134-X Soeparno. (2011). I l mu dan Teknologi Daging. Fakultas Peternakan Universitas Gadjah Mada . Yogyakarta. Steel & Torrie. (1998). Prinsip dan Prosedur Statistika suatu Pendekatan Biometrik (terjemahan). PT. Gramedia Jakarta. Suardana, I. W., Widiasih, D. A., Nugroho, W. S., Wibowo, M. H., & Suyasa, I. N. (2017). Frequency and risk-factors S analysi I s S ofH Escherichiacolii (O157: H7 in Bali-cattle.Acta tropica,172, 223-228.https://doi.org/10.1016/j.actatropica.2017.05.019 Sugeng.(2004). Sapi Potong. Penebar Swadaya. Jakarta. Sunarlim, R. O. S. W. I . T. A., & Usmia t i, S. (2009). Karakter i stik daging kambing dengan perendaman enzim papain. In Seminar Nasional Teknologi Peternakandan Veteriner. Syukur, D. A. (2006). Biosecurity terhadap Cemaran Mikroba dalam Menjaga KeamanannPangan Asal Hewan. Dinas Peternakan dan Kesehatan Hewan Provinsi Lampung, Bandar Lampung. Tambunan,R. D. (2009). Keempukan daging dan faktor-faktor yang mempengaruhinya. Balai Pengkajian Teknologi Pertanian Lampung. Thyagaraju , N. (2016). Water pol l ution and it s i mpact on environment of society . International Research Journal of Management, IT and Social Sciences,3(5), 1-7. Re t rieved f r o m https://sloap.org/journals/index.php/irjmis/article/view/360 Waluyo, L. (2008). Tekni k dan metode dasar dalam mikrobiologi. Universitas Muhammadiyah Malang Press.Malang. Yant i , H., Hidayati, H., & Elfawati, E. (2008). Kualitas daging sapi dengan kemasan plast i k PE (polyethylen) dan plast i k PP (polypropylen) Di pasar arengka kota pekanbaru. Jurnal Peternakan, 5(1).
关闭-
1/9
-
2/9
还剩7页未读,是否继续阅读?
继续免费阅读全文产品配置单
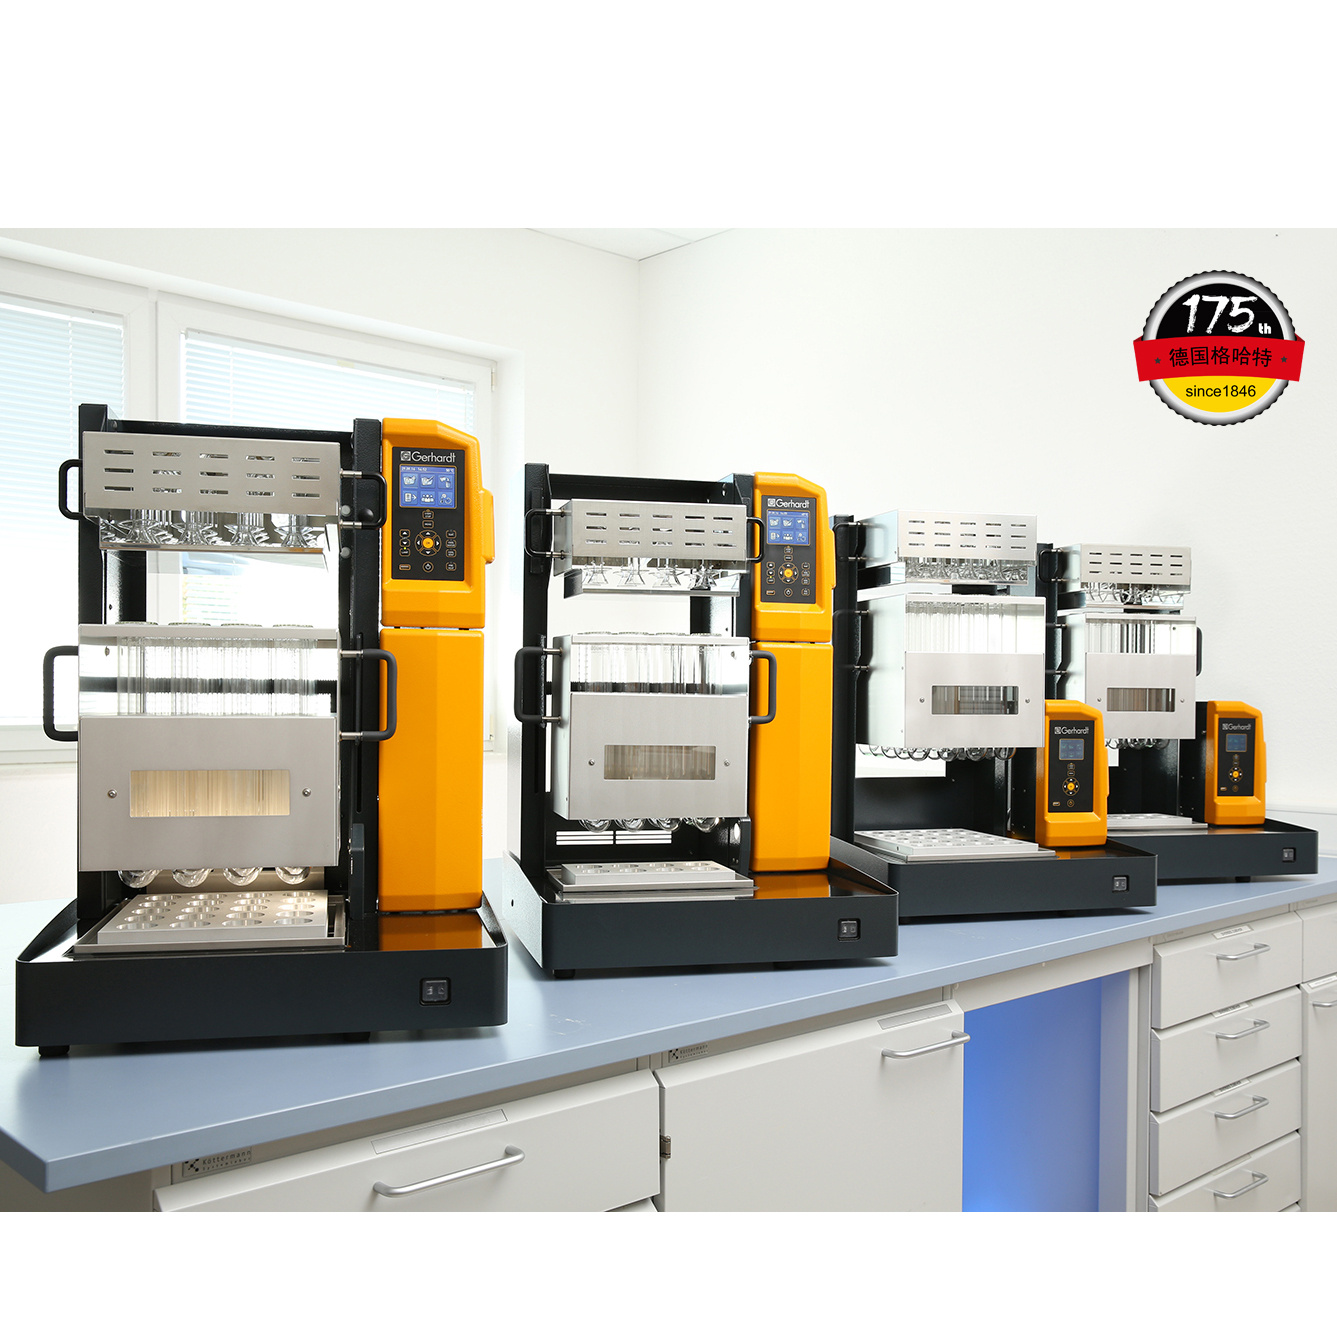
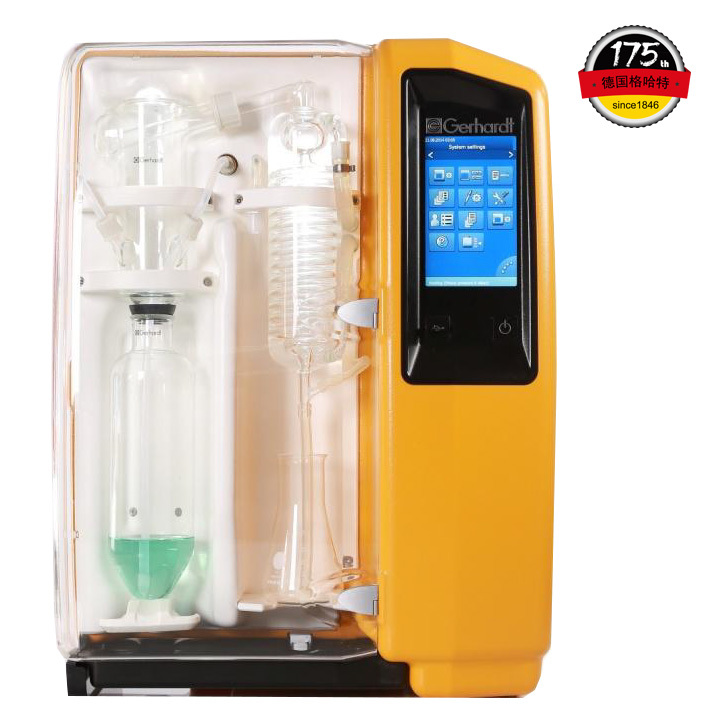

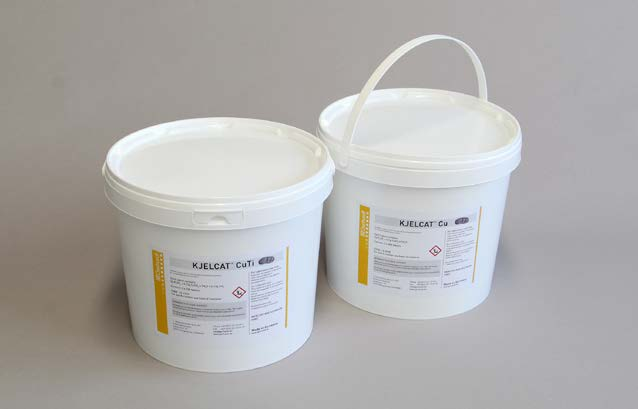
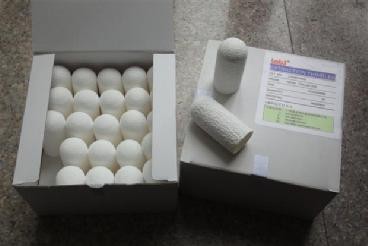
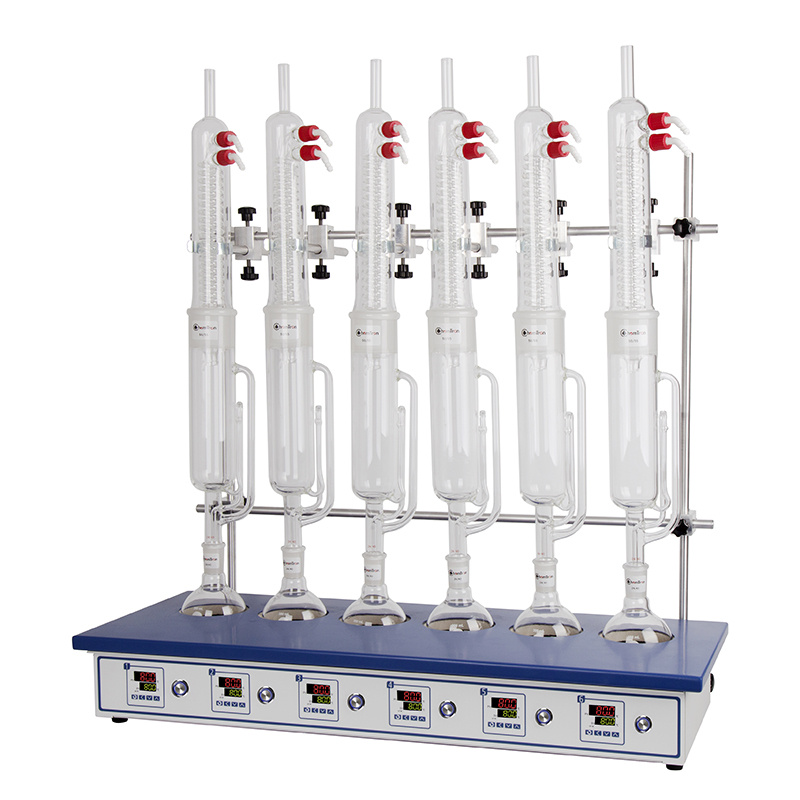
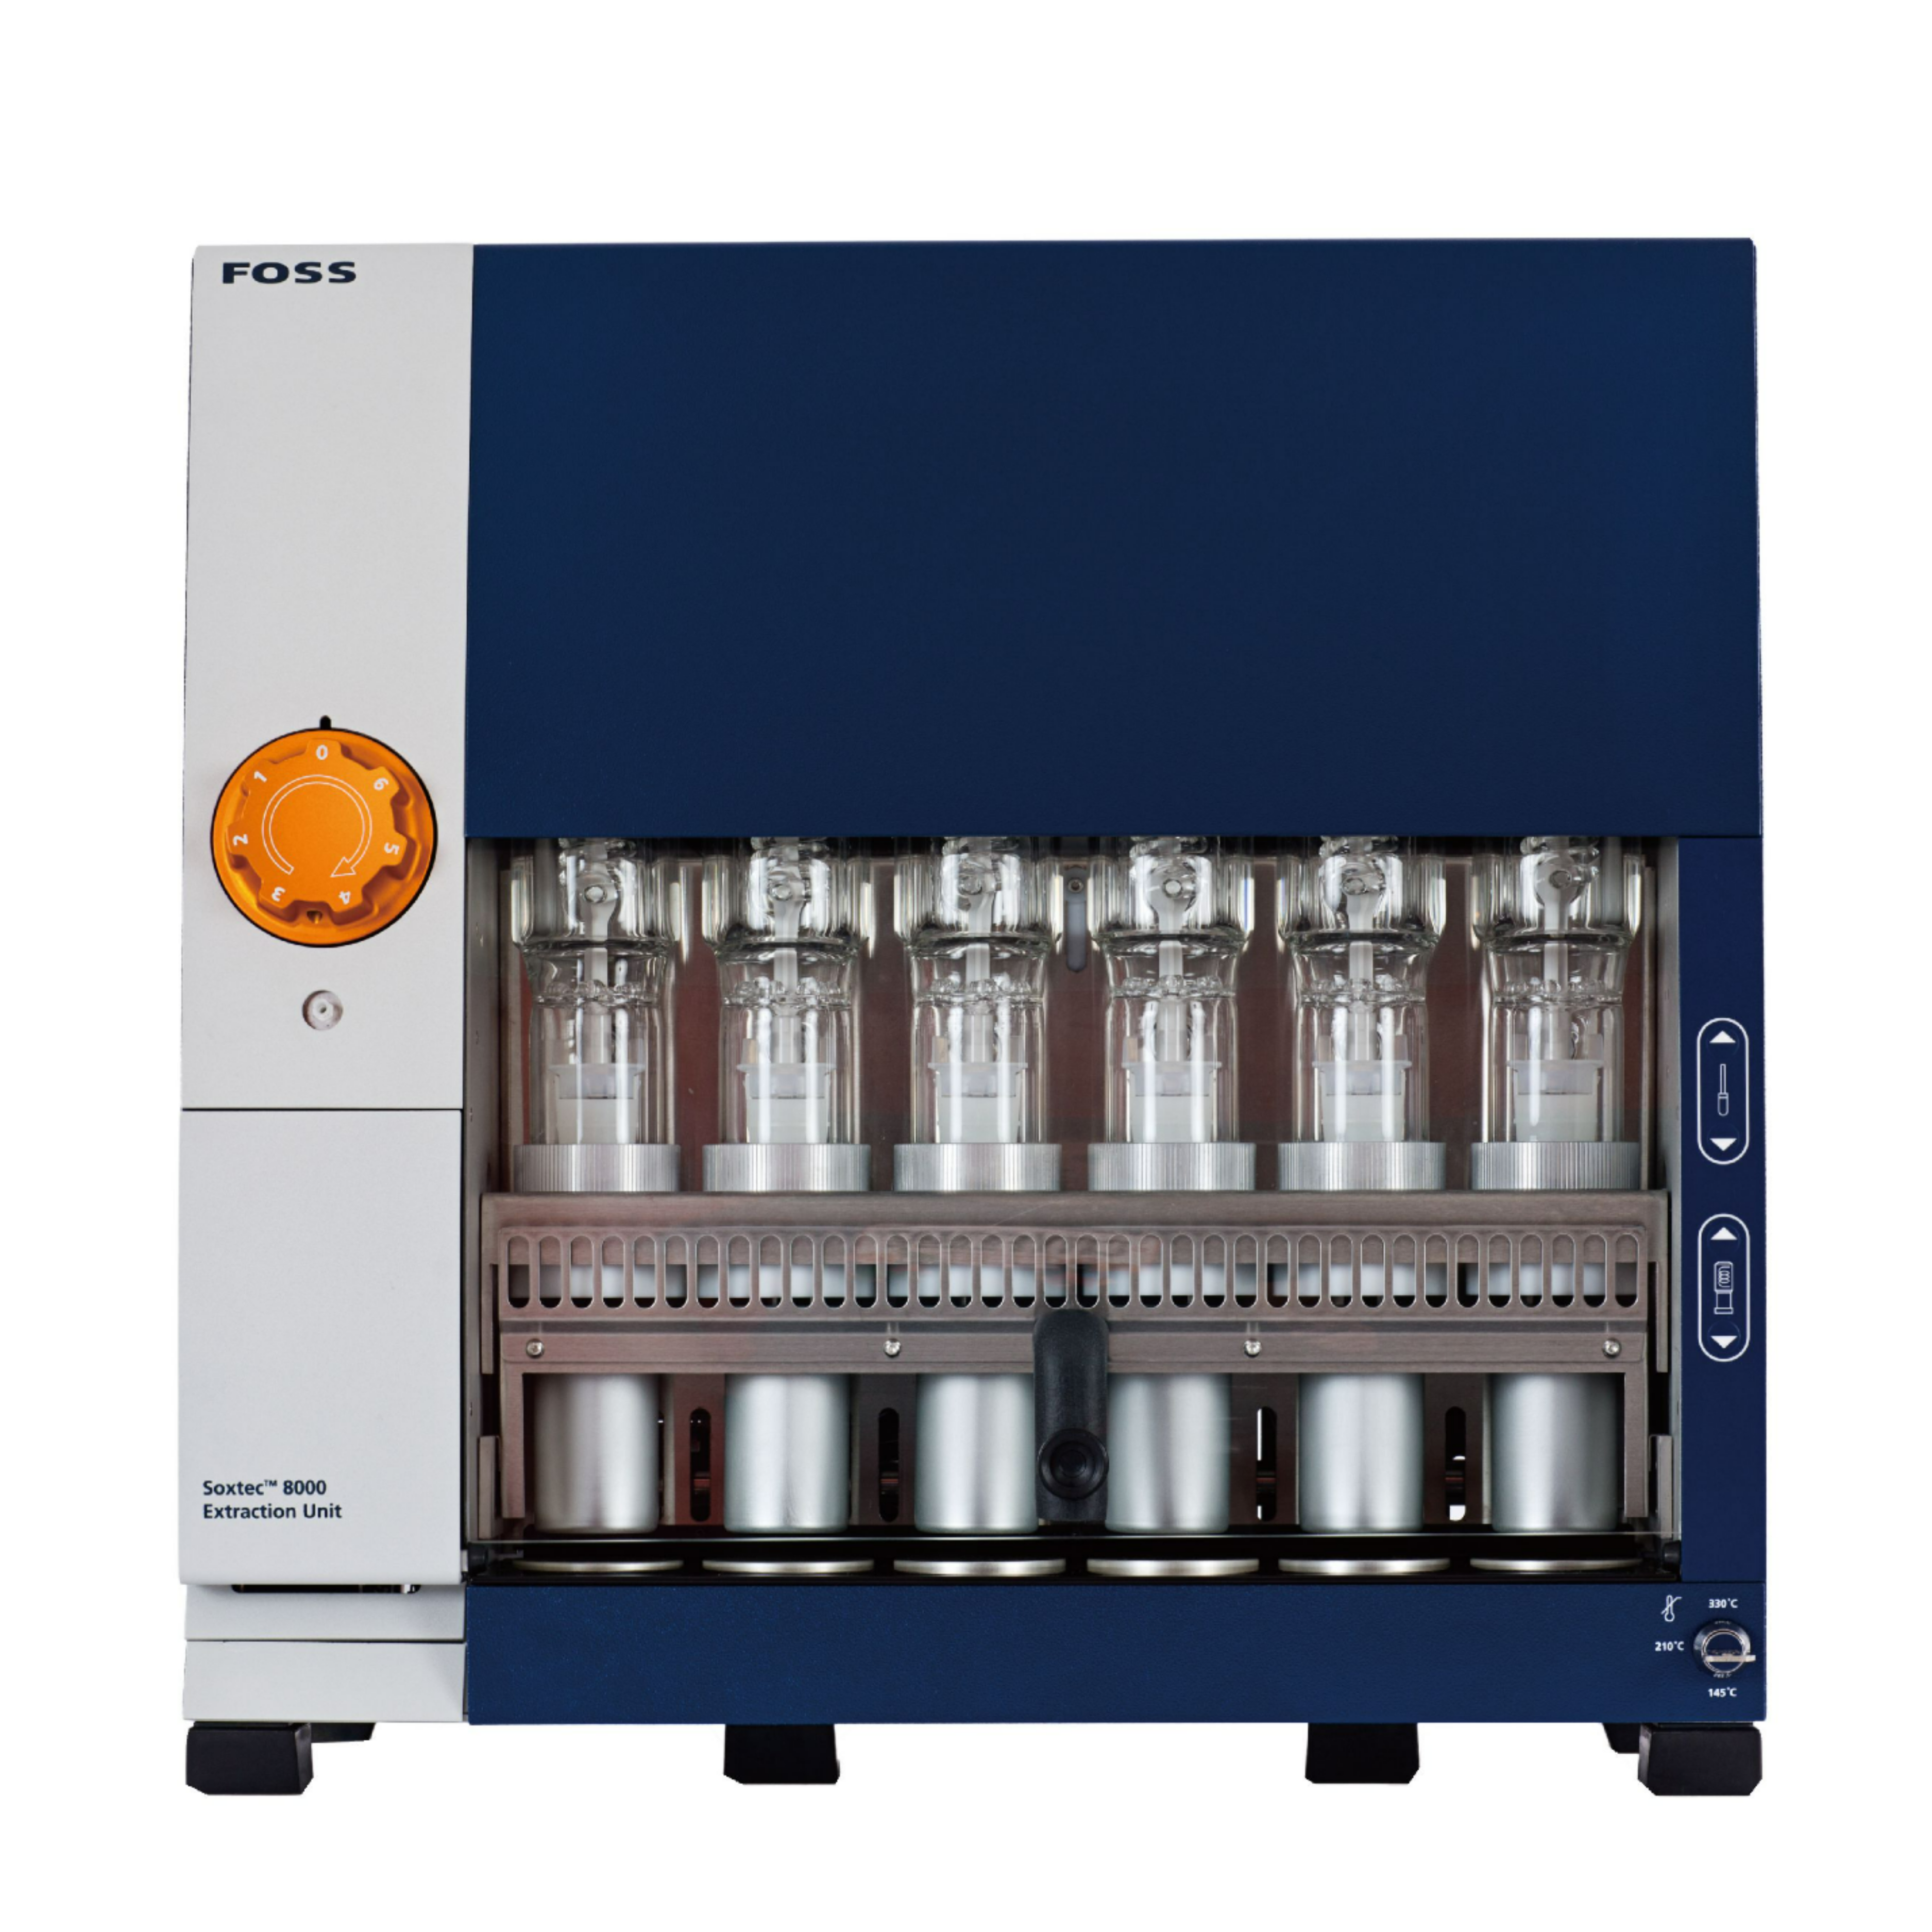
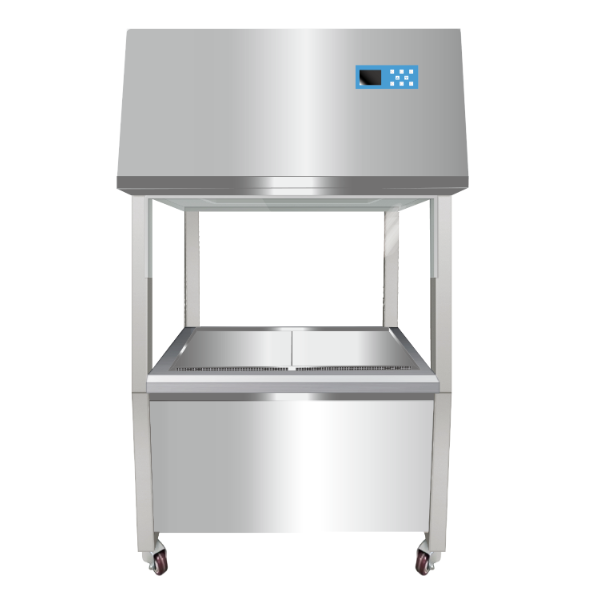
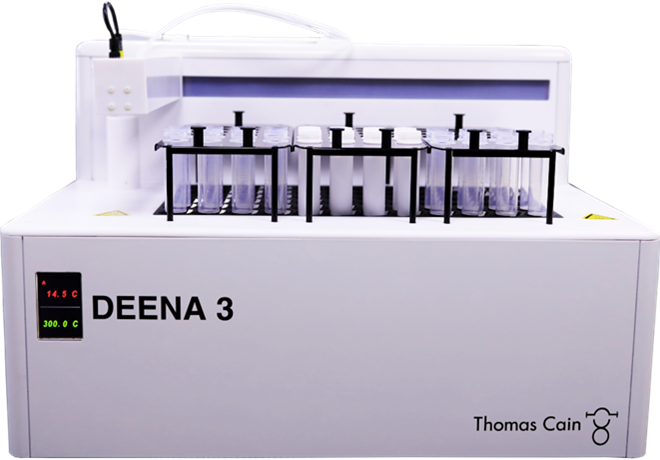
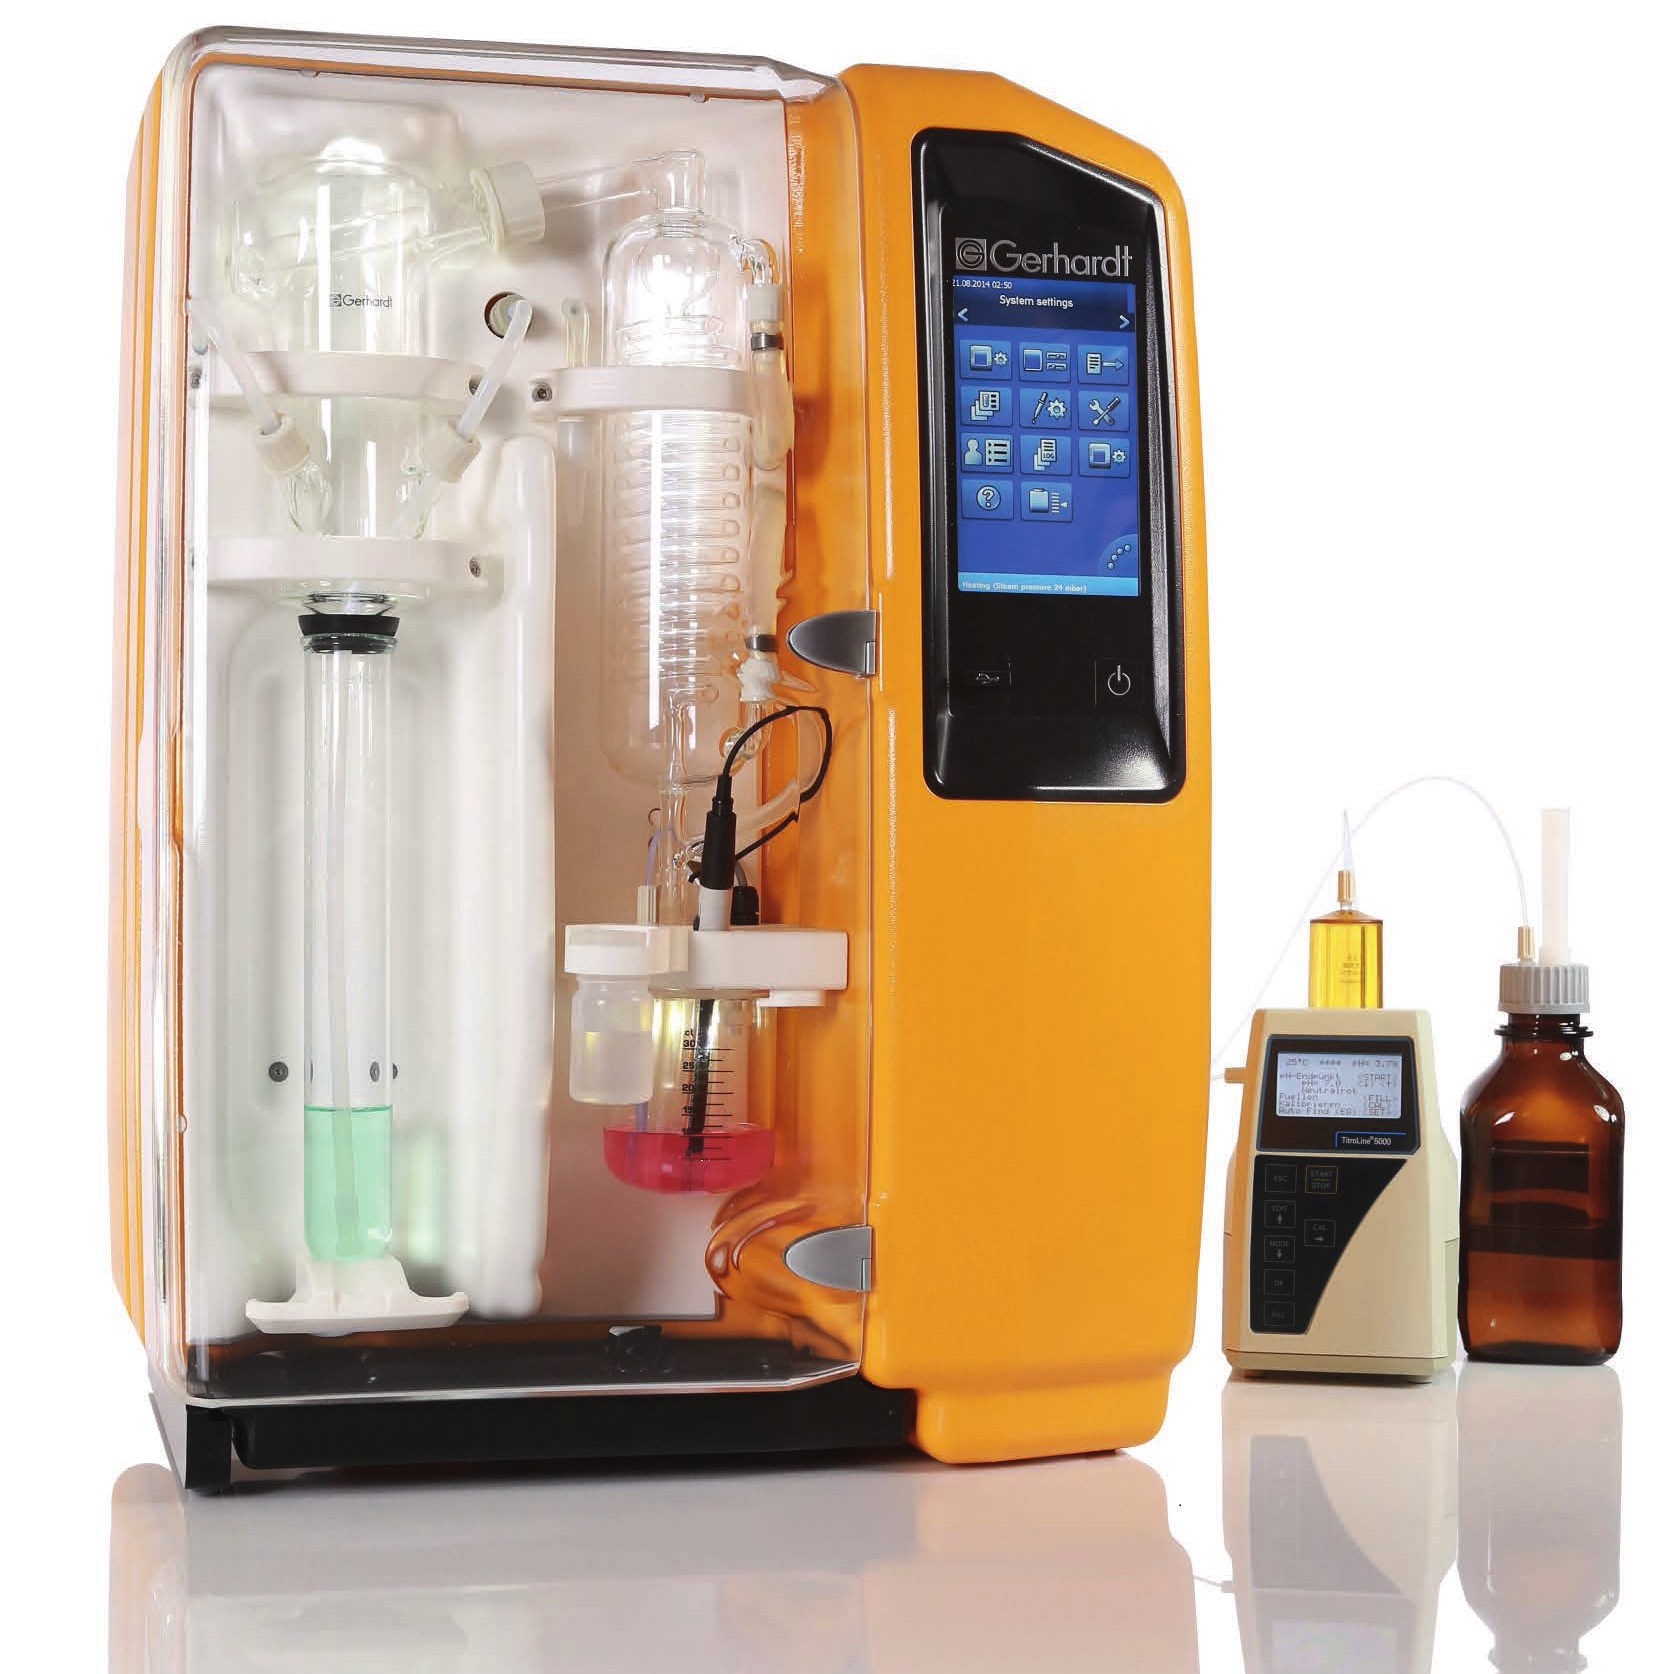
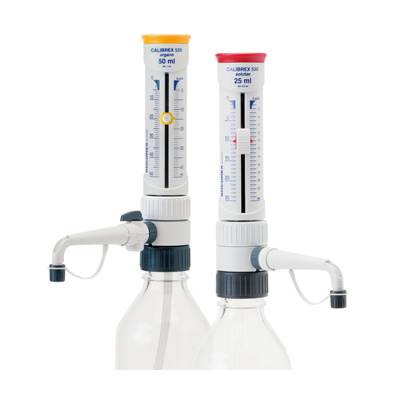
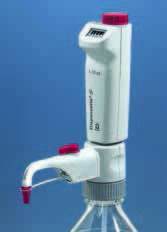
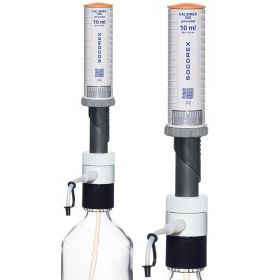
中国格哈特为您提供《牛里脊肉中蛋白质和脂肪含量的检测》,该方案主要用于畜禽肉及副产品中营养成分检测,参考标准《GB 5009.6 食品中脂肪的测定》,《牛里脊肉中蛋白质和脂肪含量的检测》用到的仪器有格哈特全自动超级总脂肪测定系统HT6+SOX416、格哈特维克松废气实验室废物处理系统涤气VS、格哈特凯氏消化系统KT8S、格哈特自动凯氏定氮仪VAPODEST、德国加液器MM、凯氏定氮催化片、滤纸筒。
我要纠错


相关方案
 咨询
咨询